| Journal of Food Bioactives, ISSN 2637-8752 print, 2637-8779 online |
| Journal website www.isnff-jfb.com |
Original Research
Volume 30, June 2025, pages 40-46
Quantification of 3,3-dimethyl-1-butanol (DMB) in olive oil: a rapid and novel method
Apostolos Kiritsakisa, *, Rifat Gimatdinb, c, Hasan Yavuz Görend, Nikos Sakellaropoulosf, Konstantinos Kiritsakisg, Charalampos Anousakish, Fereidoon Shahidii, Ahmet Ceyhan Görend, e, *
aInternational Hellenic University, International Observatory of Oxidative Stress in Agrifood and Health, Thessaloniki, Greece
bGebze Technical University, Graduate School, 41400, Gebze, Kocaeli, Türkiye
cKeymen Drug Ind. and Comp, Alagöz Holding 06530, Çankaya, Ankara, Türkiye
dDepartment of Chemistry, Faculty of Natural Sciences, Gebze Technical University, 41400, Gebze, Türkiye
eTroyasil HPLC Column Technologies, Doruk Analitik, Mehmet Akif Mah. Yumurcak Sok. No, 43 Ümraniye İstanbul, Türkiye
fSakellaropoulos Organic Farms, Sparta, Greece
gDpt. of Quality and Phytosanitary Control, Directorate of Rural Development, Region of Crete, Greece
hCEO in a Development Company, Chanea, Greece
iDepartment of Biochemistry, Memorial University of Newfoundland, Canada
*Corresponding author: Apostolos Kiritsakis, International Hellenic University, International Observatory of Oxidative Stress in Agrifood and Health, Thessaloniki, Greece; Ahmet Ceyhan Gören, Department of Chemistry, Faculty of Natural Sciences, Gebze Technical University, 41400, Gebze, Türkiye, Troyasil HPLC Column Technologies, Doruk Analitik, Mehmet Akif Mah. Yumurcak Sok. No:43 Ümraniye İstanbul, Türkiye. E-mail: kyritsak@gmail.com(AK), acgoren@gtu.edu.tr(ACG)
DOI: 10.26599/JFB.2025.95030413
Received: May 9, 2025
Revised received & accepted: June 17, 2025
| Abstract | ▴Top |
A novel headspace gas chromatography-mass spectrometry (HS-GC/MS) method for identifying and quantifying 3,3-dimethyl-1-butanol (DMB), a bioactive compound, in extra virgin olive oil was developed. In this study, solvents with similar properties to DΜB but potentially different molecular masses, namely isopropanol, n-butanol, n-pentanol, and 2-pentanol, were tested and 2-pentanol was selected as the internal standard due to both chromatographic separation and distinctive mass spectrum pattern. The method for DMB determination and quantification was validated according to Eurochem CITAC Guide. Sensitivity, specificity, linearity, accuracy, and precision parameters were evaluated. The validation process included an assessment of the method’s robustness and repeatability, ensuring that it produces reliable results for future analyses of olive oil. A linear regression equation was developed for DMB concentrations ranging from 100 to 5,000 µg/L, expressed as y = x.11.462.10−6, where y represents the peak area ratio and x is the DMB concentration in µg/L. This equation has a high correlation coefficient of 0.9989 (R2), and the uncertainty budget was estimated to be 8.22% at a confidence level of k = 2. In addition, the lower concentration range of 0 to 100 µg/L was characterized by the equation y = x.17.860.10−6 which has a correlation coefficient of 0.9983 (R2). The uncertainty of DMB measurements in extra virgin olive oil was estimated to be 7.0% at a confidence level of k = 2. This new method was applied to determine the presence of DMB in various olive oil samples from Greece and Türkiye. The DMB values for olive oil samples were: N1(Plus health blue multi varietal ) 9.7 μg/L, Ν2 (Plus health DMB multi varietal) 11.4 μg/L, N3 (Fyllikon first harvest organic) 8.3 μg/L, N4 (Plus health green multi varietal) 7.8 μg/L, N5 (Agourelaio early harvest organic) 6.8 μg/L, N6 (unknown) 4.8 μg/L, N7 (Armonia monovarietal organic) 4.8 μg/L and N8 (Edremit type olive oil from Kırkağaç, Manisa) 8.8 μg/L and N9 (Market product in Türkiye) 1.5 μg/L.
Keywords: Virgin olive oil; 3,3-dimethyl-1-butanol (DMB); Novel method for DMB determination; DMB values in olive oil; Oleocanthal; Trimethylamine N-oxide (TMAO)
| 1. Introduction | ▴Top |
Olive oil, a natural juice obtained by mechanical means from the fruit of the tree Olea europaea L., plays a crucial dietary role in the Mediterranean culture for thousands of years (Kiritsakis and Karamesinis-Kiritsakis, 2017). However, in recent years this popularity has started to spread worldwide (Kiritsakis et al., 2020a). Numerous studies have highlighted olive oil as a significant source of antioxidants based on its phenolic profile, which includes phenolic acids and alcohols, polyphenols, lignans, secoiridoids, oleacein, and oleocanthal (Kiritsakis et al., 2020b). The biological effects of olive oil components include protection against cardiovascular diseases, anti-inflammatory action, and neuro- and endothelial protection. Both in vitro and in vivo studies in humans and animals have been conducted to better understand the metabolism and bioactivity of olive oil phenolics (Kiritsakis et al., 2024; Micheli et al.,2023; Manach et al., 2004). Antioxidants from olive oil are not only absorbed by the body but can also bind to the lining of the digestive tract, contributing to its health benefits (Manach et al., 2004).
Consumption of extra virgin olive oil (EVOO) is associated with the prevention of cardiovascular diseases (CVDs) and certain types of cancer. This is linked to its well-balanced fatty acid composition, with oleic acid being the main component, as well as the presence of minor compounds such as polar phenols, tocopherols, and sterols. These characteristics make olive oil a premium functional food (Keceli Mutlu et al., 2017; Kiritsakis and Keçeli Mutlu, 2023).
Recently, a new compound, namely 3,3-dimethyl-1-butanol (DMB) in extra virgin olive oil, was found to play a key role in inhibiting the enzyme TMA-lyase, involved in the formation of trimethylamine N-oxide (TMAO). TMA is produced by the microbiome from foods such as red meat and then is absorbed into the bloodstream and oxidized to TMAO in the liver. TMAO seems to facilitate the development of atherosclerosis in animal models fed on a diet rich in animal protein (Wang et al., 2015). TMAO, an intestinal microbiota-dependent metabolite, is associated with inflammatory diseases such as atherosclerosis, whose immunologic processes mirror those of rheumatoid arthritis (RA). Gut microbiota-dependent metabolite TMAO is associated with poor prognosis in pulmonary arterial hypertension (Yang et al., 2022).
Researchers in the Cleveland Clinic, Ohio, USA and the University of California, Los Angeles, USA, who conducted experiments on mice, reported that dietary supplementation with DMB safely inhibited atherosclerosis (plaque buildup in arteries) and significantly lowered the production of TMAO (Wang et al., 2015). A pre-clinical study by Wang (2015) showed that DMB reduced TMAO levels, inhibiting atherosclerosis in animal models. Thus, DMB is an orally active inhibitor of trimethylamine (TMA) and TMAO (Wang et al., 2015).
Gut microbiota-derived metabolites, including TMA, TMAO, and short-chain fatty acids (SCFAs), have been linked to hypertension (Hsu et al., 2021). Treatment with DMB during pregnancy and lactation has been shown to rescue hypertension, providing insights into the therapeutic potential of DMB as a microbiome-based metabolite treatment for the prevention of hypertension of developmental origins (Hsu et al., 2021). Researchers have suggested that if future studies in humans show similar effects, DMB could lead to new strategies for preventing or even treating heart disease and stroke, two of the leading causes of death globally.
TMAO has also been linked to aging, cognitive impairment, and other brain disorders. A study by Mao (2021) for the first time provided direct evidence that repeated DMB exposure produces significant effects on the social dominance of adult mice without any effects on anxiety, depression-like behavior phenotype, or memory formation. This highlights the regulatory effects of gut-brain interaction on social behavior (Mao et al., 2021).
Trimethylamine N-oxide has been demonstrated to promote vascular inflammation across various cardiovascular diseases. Notably, microbial populations involved in TMAO metabolism are elevated in patients with pulmonary hypertension (PH) (Huang et al., 2022). In a murine model of heart failure (HF), Wang et al. (2020) reported that treatment with DMB significantly reduced circulating TMAO levels and mitigated both structural and electrical cardiac remodeling. As a gut microbiota-derived metabolite, TMAO is linked to increased cardiovascular (CV) risk due to its role in vascular dysfunction. Yet, this pathological effect can be attenuated through DMB supplementation (Casso et al., 2022).
Since no data on DMB analysis in olive oil has been published, this work was undertaken to establish a method for determining DMB and its presence in olive oil. The method developed here was applied internationally for DMB analysis for the first time to detect its presence in olive oil.
| 2. Materials and methods | ▴Top |
2.1. Chemicals
The chemicals used included 2-pentanol (99.7%, Sigma-Aldrich, 8.07501.0500, Dusseldorf, Germany), 3,3-dimethyl-1-butanol (DMB) (≥99.3%, TCI, D1333, Tokyo Japan), 1-butanol (≥99.4%, Sigma-Aldrich, 360465-2.5L, Dusseldorf, Germany) and ethanol (≥99.9%, ISOLAB chemicals, LR0090606ANQ, Eschau, Germany). Stock solutions of 2-pentanol (internal standard) and DMB 4000 mg/L and 100 mg/L were prepared in ethanol.
2.2. Preparation of stock and calibration solutions
The stock solution of DMB at 100 mg/L was added to a 20 mL headspace vial to obtain final concentrations of 10, 15, 20, 50, 100, 250, 500, 750, 1,000, 2,500, and 5,000 µg/L in 500 µL of oil. Then, 6.25 µL of 4,000 mg/L 2-pentanol in ethanol stock solution was quickly added to the vial to obtain an internal standard concentration of 50 mg/L. The required amount of Riviera-type olive oil devoid of DMB was added to the vials to make a final solution volume of 500 µL. The cap of the headspace vial was quickly placed, tightly closed with a clamp, and vortexed in a Heidolph device for 1 min at room temperature. Prepared samples were stored at ambient temperature in the absence of sunlight until the time of analysis.
2.3. Olive oil sample preparation
Nine (9) olive oil samples numbered N1-N9 were used to apply the method. Samples N1-N7 were donated by Sakellaropoulos Organic Farms (Sparta, Greece), and sample N8 was provided by Ahmet C Goren’s farm from Kırkağaç-Manisa, Türkiye, whereas N9 was the commercial olive oil sample obtained from the Turkish Market. A volume of 493.75 µL of olive oil sample was spiked by using 6.25 µL of 4,000 mg/L 2-pentanol solution (internal standard), so a final concentration of 50 mg/L was obtained. The heads space (HS) vial was sealed up and vortexed on a Heidolph device for 1 min at room temperature. Prepared samples were stored at ambient temperature in the dark until analysis.
2.4. Analysis of headspace gas chromatography mass spectrometry (HS-GC/MS)
The HS-GC/MS analyses were carried out with a Thermo Scientific TriPlus 500 Head Space, connected to Thermo TSQ 9610 MS-MS system on a VF-WAXms (V, Varian) capillary column (60 m × 0.25 mm, 0.25 µm film thickness) where helium is used as carrier gas (1.0 mL/min). The headspace equipment was programmed for a 20 mL vial; the samples were incubated for 10 min at 120 °C with a medium shaking rate. The vial was pressurized to 90 kPa for 1.0 min. The loop was enabled, set to 120 °C with a pressure of 70 kPa, and allowed to equilibrate for 1 min. Injection mode was configured as MHE with an injection time of 1.0 min. The GC oven temperature was initially maintained at 40 °C for 2 min, then increased to 120 °C at a rate of 15 °C/min, and held at 120 °C for 12.67 min. The total analysis duration was 20 min. A retention time window of 2 min was selected. The split ratio was adjusted to 10:1, and the injector temperature was set at 120 °C. The MS transfer line temperature was maintained at 280 °C, while the ion source temperature was set to 250 °C. The mass spectra were acquired in SIM mode. SIM parameters were set at m/z 45 and 55 for 2-pentanol and m/z 57 and 69 for DMB, corresponding to retention times of 9.94 and 12.07 min, respectively.
2.5. Method validation
The developed method for DMB quantification in olive oil was validated according to the Eurachem Citac Guide (Eurachem, 2012; Magnusson and Ornemark, 2014). Experiments for the validation of the method were carried out by spiking DMB into the olive oil samples as described in the preparation of stock and calibration solutions section. Matrix-matching calibration samples were prepared using DMB-free olive oil samples with added DMB. Two calibration curves were obtained covering low and high concentration levels. The five-point calibration curve was obtained in the lower concentrations of 10, 15, 25, 50, and 100 µg/L. The seven-point calibration curve was obtained in 100, 250, 500, 750, 1,000, 2,500, 5,000 µg/L levels. Each sample of both calibration series included 2-pentanol as an internal standard solution (IS), which was obtained by plotting the peak area ratio (analyte/IS) versus the expected analyte concentration for both. The method validation parameters of the current method were selected as specificity, linearity, accuracy, precision, repeatability, recovery, robustness, the limit of detection (LOD), the limit of quantitation (LOQ), and stability (Ozer et al., 2024; Shah et al., 2024; Magnusson and Ornemark, 2014).
2.5.1. Specificity
The ICH (International Council for Harmonization) (ICH, 2025) guideline defines specificity (widely known also as Selectivity) as “the ability to assess the analysis in the presence of components accurately.” Therefore, the specificity of the method was evaluated by performing six replicates of HS-GC/MS measurements of blank samples (water), non-spiked DMB-free blank olive oil, and standard mixture solution separately (ICH, 2025). No peaks were observed in the blank matrixes for IS (2-pentanol) at RT 9.94 min and target compound (DMB) at 12.07 in the GC/MS chromatogram of olive samples (Figures S1–S3).
2.5.2. Linearity
Two calibration curves were prepared using the matrix-matched methodology. Meanwhile preparing this calibration curve for the higher concentrations, solutions of DMB at concentrations of 100, 250, 500, 750, 1,000, 2,500, and 5,000 µg/L were used on the DMB free matrix with 50 mg/L as the internal standard at each concentration level and, linear least-squares regression analysis was performed, correlation coefficients (R2) was determined as 0.9989 and, linear regression equation was obtained as y = x.11.462.10−6 where y is peak area ratio, X is the DMB concentration in µg/L. The calibration curve for the lower levels was obtained by preparing DMB solutions at 10, 15, 20, 50, 100 µg/L concentrations in the DMB free matrix with 50 mg/L of 2-pentanol as internal standard at each level, correlation coefficient (R2) was determined as 0.9983 and, linear regression equation was obtained as y = x.17.860.10−6. The linear range of the method was worked as 0–100 and 100 - 5,000 µg/L (Figures S4 and S5, respectively, Table S1). Herein, Statistical analysis was performed in Microsoft Excel spreadsheets (See Figures S4 and S5 for supporting information).
2.5.3. Repeatability, accuracy, precision and recovery
Samples (n-6) with three different DMB concentration levels (100, 1,000, and 5,000 µg/L) were prepared to assess the method’s performance. These points cover the matrix’s low, medium, and high analyte concentrations. RSD of the recovery values and recovery values themselves obtained from the six replicates of the olive oil matrix provided information on the method accuracy (Figures S6–S8, Table 1, Table S2). The data’s recovery and relative standard deviation (RSD) were calculated as shown below.
 Click to view | Table 1. Method accuracy parameters of determination of DMB in Olive oil by HS-GC/MS |
2.5.4. Limit of detection (LOD) and limit of quantitation (LOQ)
LOD and LOQ values were estimated using spiked standard solutions (obtained with dilutions) to the matrix at significantly lower mass fractions such as 1, 2, and 10 µg/L. The developed HS-GC/MS method was applied to the six spiked samples from each level, and the LOD and LOQ values were calculated by multiplying the standard deviation (SD) by 3 and 5, respectively. As a result, the LOD value of the method reported here for DMB was determined as 1.91 µg/L, while it was deemed appropriate to determine 5 times this value for the LOQ value (Figures S4, S5, and S9).
2.5.5. Robustness
The method’s robustness patterns were assessed for three concentration levels (100, 1,000, and 5,000 µg/L) by changing the mobile phase flow rate in the range 0.90–1.00–1.10 (ml/min) and the HS oven thermostat temperature in the range of 115–120–125 °C. The high selectivity properties of HS-GC/MS measurements showed no significant change in the analytes’ peak areas and resolution. RT changed with flow rate according to our expectations. The HS-GC/MS measurements are presented in Figures S10–S12.
2.6. Uncertainty assessment
The primary sources of uncertainty for the developed method were estimated according to the Eurochem/Citac Guide and literature data (Magnusson and Ornemark, 2014; Ozbay et al., 2023; García-Alegría et al., 2023). The bottom-up approach methodology for uncertainty budget estimation was considered initially. The potential uncertainty sources were sample weighting, glassware volume and pipetting, standard purity, calibration curve, experiment recovery, and method repeatability. Some sources were neglected due to their minor effect on the total uncertainty budget; the identified primary sources of uncertainty are repeatability, calibration curve, and recovery. Uncertainty was determined as 8.2% for 100–5,000 µg/L and 7.0% for 10–100 µg/L range. The combined uncertainty (UCombined) was estimated as follows: The primary source of uncertainty budget comes from the experiment’s recovery, calibration curve, and repeatability.
The expanded uncertainty (UExpanded), giving a 95% confidence level was evaluated using a coverage factor k of 2 as follows:
| 3. Results and discussion | ▴Top |
3.1. Optimization of headspace gas chromatography mass spectrometry (HS-GC/MS) measurements
The HS-GC/MS analyses were carried out by using a Thermo Scientific TriPlus 500 HeadSpace, connected to Thermo TSQ 9610 MS-MS system on a VF-WAXms (V, Varian) capillary column (60 m × 0.25 mm, 0.25 µm film thickness). Different solvents were used to choose the best for the evaluation of the proposed method and the identification and determination of the 3,3-dimethyl-1-butanol (DMB). This target compound has a molecular mass (MW) of 102.18 g/mol, and its boiling temperature (Tb) is 143.0 °C. Compounds with similar chemical structures, close molecular weight, and boiling temperature were tested as candidates for internal standard use. The compounds were 1-butanol (MW = 74.12 g/mol, Tb = 117.7 °C, SIM parameters were determined as m/z 45 and 55) and 2-pentanol (MW = 88.15 g/mol, Tb = 119.3 °C). The study was continued with 2-Pentanol because it has a retention time (RT = 9.94 min) closer to DMB’s (RT = 12.07 min), and it has a more intense peak than 1–butanol (RT = 10.22 min). The Head Space oven temperature was adjusted to 120 °C to match the boiling temperature of 2-pentanol, the component with the lowest boiling temperature, and avoid evaporation and interference with other non-target compounds. We also tested the nonpolar type column, DB-5 (Restek Corp., Phase: RTX-5 SUMS) capillary column 30 m × 0.25 mm (0.25 mm film thickness), but the chromatograms observed, showed peaks with a tailing effect. Thus, we decided to use a polar column instead of a nonpolar one for this measurement.
In order to select the calibration range for the developed method, firstly, 1 and 10 mg/L DMB solutions were prepared in water, and single-point calibration was performed by performing HS-GC/MS analysis. Then, olive oil samples were determined, and the approximate DMB concentration range of olive oil samples was estimated. In light of the obtained data from this experiment, it was that the DMB concentration in olive oil samples was found to be at µg/L level. To ensure accuracy, the calibration range was selected as 10 - 5,000 μg/L (Figures S4 and S5, Table S1). Additionally, experiments for estimating the µg/L level, limit of detection (LOD), and limit of quantification (LOQ) values were included in the validation parameters. Then, validation parameters were selected as specificity, linearity, accuracy, precision, repeatability, recovery, robustness, the limit of detection (LOD), the limit of quantitation (LOQ), and stability.
Specificity experiments of the method were performed with six replicate measurements of blank samples (water), non-spiked DMB-free blank olive oil, and standard mixture solution individually. No peak appears at 9.94- and 12.7-min retention time in the absence of internal standard and DMB, respectively. (a). Peak d is higher than curve b because in d, the olive oil contains 20 µg/L of DMB, while in b, it contains 10 µg/L of DMB (Figure S9 in supporting this information). Thus, we can clearly say that our developed method has strong specificity for DMB measurements in olive oil.
In this study, in order to determine the linear working range of the method, and to minimize the matrix effect - although not necessarily considering the technique applied and the scarcity of interferences - the matrix-matched calibration methodology was used, and six different samples from each level were prepared by measuring them six times. As a result of the experiments, the calibration curve’s correlation coefficient (R2) was found to be 0.9983, while the linear regression equation was y = x.17.860.10−6 (See Table 2).
Click to view | Table 2. Method validation parameters of determination of DMB in Olive oil by HS-GC/MS |
In order to determine the robustness of the developed method, measurements were repeated with different flow rates at different DMB contents. When the flow rate increased from 0.9 ml/min to 1.1 mL/min in three different samples with different DMB concentrations (100, 1,000, and 5,000 μg/L), the internal standard and DMB peaks appeared earlier, as expected. However, no significant change was detected in the measured values due to the high selectivity of the mass spectrometer. For this reason, no trial was conducted regarding the change in the column oven temperature by 3–5 °C, which is the other factor affecting the RT change. As a result, it was shown that this new measurement method reported here is robust and repeatable even if the flow rates and retention time data of the analytes change at 0.9, 1.0, and 1.1 mL/min.
By using the developed HS-GC/MS method herein, DMB amounts in extra virgin olive oil samples obtained from the Sparta region of Greece and Kırkağaç from Türkiye were determined, and the experimental results are given in Tables S2 and S3 (S3 in Supplementary material). Considering these results, DMB was detected in nine extra virgin olive oil samples. Among these, the highest DMB amount was detected in the N2 coded Plus health DMB Multivarietal olive oil sample. Meanwhile, the lowest level was observed in the samples named Armonia Monovarietal Organic with N6 and N7 codes (see Table 3). Similarly, the amount of DMB in olive oil sample N8 directly obtained from the producer after olive oil pressing was found to be 8.8 µg/L. However, the olive oil obtained from the market was found to contain 1.5 µg/L. The GC-MS chromatograms of the HS-GC/MS measurements of samples are given in the supplementary material between Figures S13–S21, the chromatograms of the blank sample, 100 µg/L DMB spiked olive oil sample and Plus health DMB Multivarietal olive oil sample are given in Figure 1.
Click to view | Table 3. Amount of DMB (3,3-dimethyl-1-Buthanol) in the tested olive oil samples* |
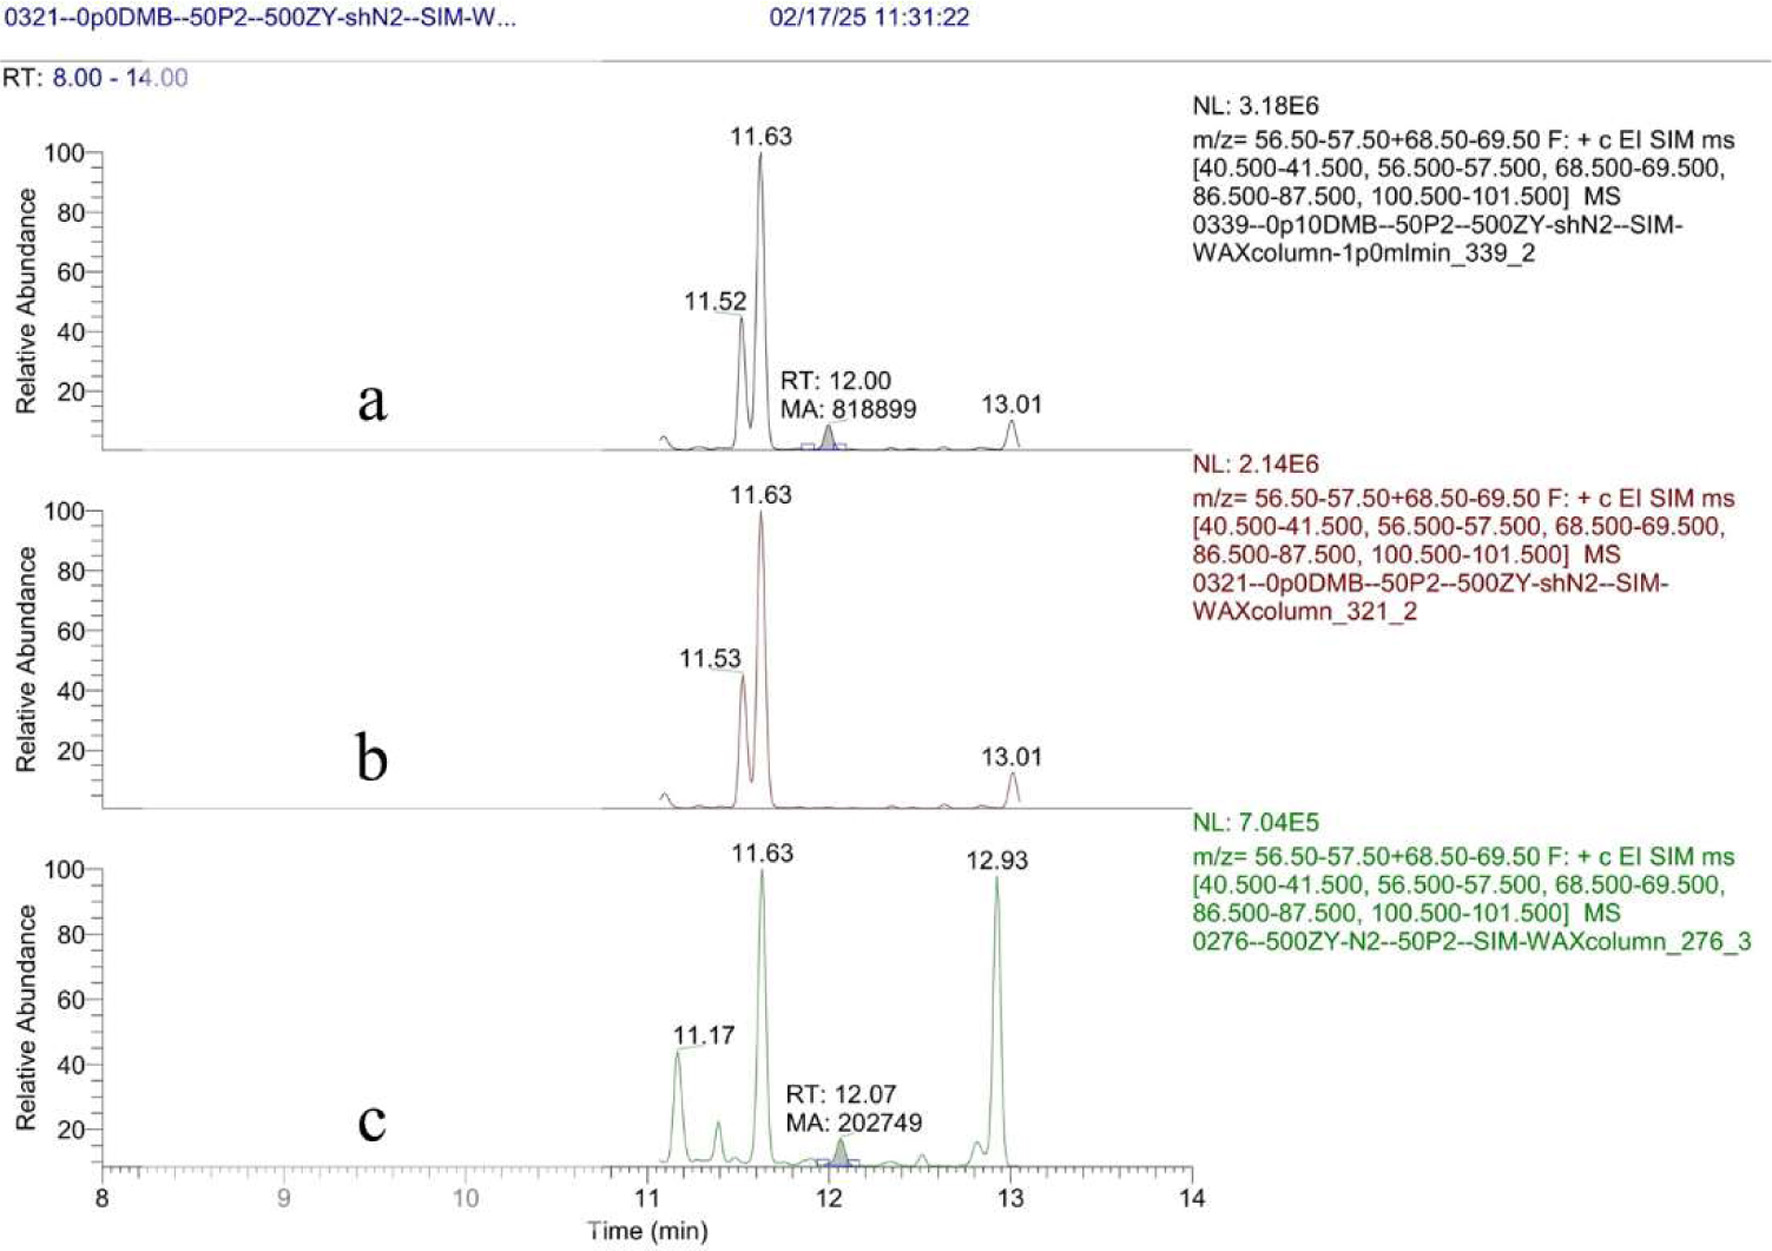 Click for large image | Figure 1. Chromatograms for 100 μg/L DMB in blank olive oil (a), blank olive oil (b), Olive oil sample N2 (c). |
| 4. Application of the method | ▴Top |
The method developed in this study was successfully applied to routine measurements of DMB in extra virgin olive oil (for the measurement chromatogram, see Figure 1). The method developed here is robust and specific that can be applied for DMB measurement in olive oil samples. Though the boiling temperature of the olive oil is around 300 °C, and the headspace oven temperature was set to 120 °C, the oil vapors produced are carried across the different parts of the HS-GC/MS system, affecting peak intensities, so the periodic maintenance of the ion source and injector sections cleaning after every 300 injections is recommended.
In the sample of extra virgin olive oil purchased from the Turkish market, approximately six times less DMB was detected compared to the fresh olive oil obtained from Türkiye. This study did not include a market survey of DMB content across various olive oils; therefore, we analyzed only a single product. However, we plan to conduct further research to evaluate the DMB levels in a broader range of market samples in future.
| 5. Conclusion | ▴Top |
Olive oil, a key component of the Mediterranean diet, has played a significant role in nutrition and health for thousands of years. Numerous scientific studies indicate the importance of specific constituents within olive oil for human well-being. Most of these constituents have been identified and characterized through various analytical methods. The development of this new headspace gas chromatography/mass spectrometry (HS-GC/MS) method encourages further studies on the presence of this compound in olive oil and the factors that affect its concentration. Our new method will likely find wide applications in olive oil research and quality as well as in health assessment. Subsequent studies using this method are likely to influence the marketing of olive oil and its production, storage, and packaging technology.
| Supplementary material | ▴Top |
Figure S1. Specificity measurements for 2-pentanol and DMB in water: (a) absence of 2-pentanol in water, (b) 50 mg/L 2-pentanol in water, (c) absence of DMB in water, (d) 50 mg/L DMB in water.
Figure S2. Specificity measurements for 2-pentanol and DMB in blank olive oil: (a) absence of 2-pentanol in blank olive oil, (b) 50 mg/L 2-pentanol in blank olive oil, (c) absence of DMB in blank olive oil, (d) 50 mg/L DMB in blank olive oil.
Figure S3. Specificity measurements for 2-pentanol and DMB in standard mixture solution: (a) pure water, (b) 50 mg/L 2-pentanol, (c) pure water, (d) 50 mg/L DMB.
Figure S4. Calibration points for a range of 10 – 5,000 µg/L of DMB (passes through the origin).
Figure S5. Calibration points for a range of 0 – 100 µg/L of DMB.
Figure S6. Accuracy control for 100 µg/L DMB samples (RT = 11.71 min) in blank olive oil
Figure S7. Accuracy control for 1,000 µg/L DMB (RT = 12.01 min) samples in blank olive oil
Figure S8. Accuracy control for 5,000 µg/L DMB (RT = 12.06 min) samples in blank olive oil
Figure S9. Determination of LOD using chromatography data. Blank Olive oil sample (a), with 10 μg/L (b), 15 μg/L (c) and 20 μg/L (d) of DMB sample chromatograms.
Figure S10. Robustness control for 100 µg/L DMB samples at different mobile phase flow rate: 0.9 ml/min (a), 1.0 ml/min (b), 1.1 ml/min (c).
Figure S11. Robustness control for 1 000 µg/L DMB samples at different mobile phase flow rate: 0.9 ml/min (a), 1.0 ml/min (b), 1.1 ml/min (c).
Figure S12. Robustness control for 5,000 µg/L DMB samples at different mobile phase flow rate: 0.9 ml/min (a), 1.0 ml/min (b), 1.1 ml/min (c).
Figure S13. Olive oil sample N1 with 50 mg/L of P2 (top) and DMB (bottom) chromatogram, 1st injection.
Figure S14. Olive oil sample N2 with 50 mg/L of P2 (top) and DMB (bottom) chromatogram, 1st injection.
Figure S15. Olive oil sample N3 with 50 mg/L of P2 (top) and DMB (bottom) chromatogram, 1st injection.
Figure S16. Olive oil sample N4 with 50 mg/L of P2 (top) and DMB (bottom) chromatogram, 1st injection.
Figure S17. Olive oil sample N5 with 50 mg/L of P2 (top) and DMB (bottom) chromatogram, 1st injection.
Figure S18. Olive oil sample N6 with 50 mg/L of P2 (top) and DMB (bottom) chromatogram, 1st injection.
Figure S19. Olive oil sample N7 with 50 mg/L of P2 (top) and DMB (bottom) chromatogram, 1st injection.
Figure S20. Olive oil sample N8 with 50 mg/L of P2 (top) and DMB (bottom) chromatogram, 1st injection.
Figure S21. Olive oil sample N9 with 50 mg/L of P2 (top) and DMB (bottom) chromatogram, 1st injection.
Table S1. Calibration points for a range 0 µg/L – 5,000 µg/L, observed peak area ratio and calculated DMB amount in the calibration sample.
Table S2. HS-GC/MS measurement results for 100*, 1,000 and 5,000 µg/L in blank olive oil with the Recovery and RSD values were estimated.
Table S3. HS-GC/MS measurement results for Olive oil samples N1-N9.
Acknowledgments
We express our thanks and our appreciation to Ioannis Lykakis professor of Chemistry in the Aristotle University of Thessaloniki Greece, for reading the manuscript and making useful corrections and suggestions.
| References | ▴Top |