| Journal of Food Bioactives, ISSN 2637-8752 print, 2637-8779 online |
| Journal website www.isnff-jfb.com |
Original Research
Volume 31, September 2025, pages 88-100
Species differentiation and quality evaluation of the roots and flowers from two Pueraria species based on an integrated approach of UPLC-ESI-MS, molecular docking and QAMS coupled with multivariate statistical analysis
Ruiru Qiana, #, Kexiang Gea, #, Ke Wua, #, Wei Sib, Xijun Sic, d, Wenqiang Guana, Hui Zhaoa, Jiachen Suna, *
aTianjin Key Laboratory of Food and Biotechnology, Tianjin International Joint Center of Food Science and Engineering, State Experimental and Training Centre of Food and Drug, School of Biotechnology and Food Science, Tianjin University of Commerce, Tianjin 300134, China
bSchool of Mechanical Engineering, Tianjin University of Technology, Tianjin 300384, China
cJingbian Tianrun Agricultural Technology Co., Ltd, Yulin, Shanxi 718500, China
dShaanxi Herbal essence Pharmaceutical Co., Ltd, Yulin, Shanxi 718500, China
#These authors contributed equally to this article.
*Corresponding author: Jiachen Sun, Tianjin Key Laboratory of Food and Biotechnology, Tianjin International Joint Center of Food Science and Engineering, State Experimental and Training Centre of Food and Drug, School of Biotechnology and Food Science, Tianjin University of Commerce, Tianjin 300134, China. E-mail: sunjiachen@tjcu.edu.cn
DOI: 10.26599/JFB.2025.95031423
Received: July 24, 2025
Revised received & accepted: September 6, 2025
| Abstract | ▴Top |
Pueraria genus [Pueraria lobata (Willd.) Ohwi and Pueraria thomsonii Benth] are widely distributed and used as health food in China and other Asia countries. However, the root and flower of two Pueraria species are commonly used as substitutes for each other and may adversely affect consumer health, as it could cause efficacy instability or not have the intended effect. In the present paper, ultra-performance liquid chromatography-electrospray ionization mass spectrometry (UPLC-ESI-MS) with relative quantitative heatmap analysis and molecular docking experiment was established for simultaneous determination of eleven chemical markers (i.e., 3′-hydroxy puerarin, puerarin, 3′-methoxy puerarin, puerarin xyloside, daidzin, genistin, tectoridin, ononin, daidzein, genistein, and tectorigenin). Based on obtained data, a method based on quantitative analysis of multi-components by single marker (QAMS) for quality evaluation of both species in detail has been developed. Then, a total of forty batches of roots and flowers covering two Pueraria species were processed using QAMS and multivariate statistical analysis. In conclusion, this study not only established a method of simultaneous determination of multiple bioactive constituents in the root and flower from different batches of Pueraria species, but also provided detailed profiles of their chemical differences of them.
Keywords: Pueraria species; UPLC-ESI-MS; Molecular docking; QAMS; Multivariate statistical analysis
| 1. Introduction | ▴Top |
Pueraria genus, including Pueraria lobata (Willd.) Ohwi and Pueraria thomsonii Benth, are mainly cultivated and distributed in China and other Asia countries. The flower of Pueraria genus, Puerariae Lobatae Flos (PLF) and Puerariae Thomsonii Flos (PTF), are used as health products to counteract the overconsumption of alcohol in Eastern Asia (Niiho et al., 2010; Xiong et al., 2010). The root of P. lobate as independent herb, namely “Gegen” (Radix Puerariae Lobatae, RPL) as well as that of P. thomsonii as another one, namely “Fenge” (Radix Puerariae Thomsonii, RPT), were commonly used as a food resource in southern China and dietary supplements in North America, and could promote blood circulation to remove blood stasis (Zhou et al., 2014; Chen et al., 2006; Keung and Vallee, 1998).
At present, owing to the close proximity of plant species and the similar appearance, the PLF and PTF (RPL and RPT) are commonly used as mutual substitutes for similar therapeutic purposes (Niiho et al., 2010; Lee et al., 2001; Wong et al., 2011). Nevertheless, if an ingredient of a dietary supplement is identified as a certain species and labeled as such on the product, appropriate analytical methodologies are required to assure authenticity (Woolfe and Primrose, 2004). In addition, the disparity in content of phytochemicals has arisen doubt about the ‘bio-equivalence’ of the two species with the same dose (Wong et al., 2014; Hu et al., 2018; Hu and Yin, 2017). Whether the two Pueraria species should be substitutes for each other needs to be clarified by scientific evidence, so as to prevent or avoid adverse effects and efficacy instability. Therefore, a comprehensive analysis of the chemical profiles is highly needed to be conducted for the root and flower of two Pueraria species.
Puerarin was usually used as the chemical marker for controlling the quality of the root and flower of Pueraria species in the pharmaceutical industry and Chinese pharmacopeia, and is also regarded as the indicator to distinguish the high-quality medicinal materials from the lower quality ones (Chen et al., 2006; Chinese Pharmacopoeia Commission, 2020; Wong et al., 2015). However, the therapeutic efficacy of botanical products is always attributed to their multi-components but not to any single ingredient (Zhou et al., 2016). In addition, distinguishing the orthologues or paralogues is a key step in the quality improvement of Pueraria products, but the compound existed in all Pueraria plants which could not be used to distinguish the species (Egan et al., 2016; Wei et al., 2014). So, besides quantification of single compound, a comprehensive multi-ingredient analytical method is necessary to be developed for more effective quality assessment of the root and flower of two Pueraria species. Meanwhile, it is meaningful to find the distinguishing chemical markers and identify which species [Pueraria lobata (Willd.) Ohwi and Pueraria thomsonii Benth] is the optimum quality of Puerariae Radix and Puerariae Flos.
In previous research, conventional phytochemical strategies have been developed for the qualitative and quantitative determination of chemical markers in the root and flower of Pueraria lobata (Willd.) Ohwi and Pueraria thomsonii Benth, such as chromatography-mass spectrometry (GC-MS) and high-performance liquid chromatography tandem ultraviolet detector (HPLC-UV), are tedious and time-consuming (Wu et al., 2011). Therefore, an effective and efficient approach for determining the chemical marker is needed. In the present study, we attempted to analyze the chemical profiles in the root and flower of Pueraria species utilizing ultra-performance liquid chromatography-electrospray ionization mass spectrometry (UPLC-ESI-MS). Then, relative quantitative heatmap analysis and molecular docking experiment were introduced to screen the chemical markers. Previous studies have suggested that alcoholism is associated with increased alkaline phosphatase activity (Li et al., 2004). In addition, thrombin plays a pivotal role in thrombotic diseases, thrombin inhibitors are used in the treatment of thrombotic diseases (He et al., 2015). In detail, to identify the bioactive constituents to discriminate the PLF and PTF (RPL and RPT), thrombin and alkaline phosphatase, which is involved in the treatment of thrombotic diseases and detoxification of alcohol, was selected as a bioactive index. On the basis of determining chemical markers, a method based on quantitative analysis of multi-components by single marker (QAMS) was developed for quality evaluation of PLF and PTF (RPL and RPT). Genistin was used as the reference standard to simultaneously determine eleven components, in forty Pueraria samples covering two species. Moreover, UPLC-based fingerprints combined with similarity analysis (SA), hierarchical cluster analysis (HCA) and principal component analysis (PCA) were performed to distinguish the PLF and PTF (RPL and RPT). The overall results provided comprehensive chemical information for the same parts of two Pueraria species, which was useful for efficient quality control, accurate species identification and appropriate clinical use of these two species.
| 2. Materials and methods | ▴Top |
2.1. Reagents and materials
Puerariae Radix and Puerariae Flos samples from different regions of China were collected and authenticated by one of the authors, professor Zhao (Tianjin University of Commerce). HPLC-graded acetonitrile and formic acid were purchased from Aladdin (Shanghai, China). A total of eleven standards, including 3′-hydroxy puerarin (1), puerarin (2), 3′-methoxy puerarin (3), puerarin xyloside (4), daidzin (5), genistin (6), tectoridin (7), ononin (8), daidzein (9), genistein (10), and tectorigenin (11), were purchased from Aladdin, China. All of the standards have the purity of more than 98% and deionized water was used.
2.2. Sample preparation
One gram of Puerariae Radix powder was added with 20 mL ethanol-water solution (70:30, v/v), and then the samples were ultrasound for 50 min at 40 °C. Similarly, one gram of Puerariae Flos powder was added with 20 mL ethanol-water solution (60:40, v/v), and then the samples were ultrasound for 40 min at 30 °C (Rezaei et al. 2023; Chen et al. 2021; Zhang et al. 2024). The mixture of Puerariae Radix and Puerariae Flos was centrifuged at 1,000 g for 10 min, respectively. Before analysis, the supernatant underwent filtration through 0.45 µm filter membrane and stored at 4 °C.
To establish a proper extraction method, we compared the yield of active substances in Puerariae Radix and Puerariae Flos with different influencing factors. Samples were taken to the ultrasonic water bath at 40 kHz, under different extraction conditions, including ethanol-water proportion (10–100%), solvent to solid ratio (10–40 mL/g), extraction time (20–60 min) and extraction temperature (30–70 °C) (Ayyildiz et al. 2018; Alasalvar, 2019). The extract was centrifuged for 10 min at 1,000 g and the supernatant was collected.
2.3. Preparation of standard solution
Standard solutions were prepared by dissolving the above mentioned eleven reference substances (3′-hydroxy puerarin, puerarin, 3′-methoxy puerarin, puerarin xyloside, daidzin, genistin, tectoridin, ononin, daidzein, genistein, and tectorigenin) in methanol, and stored at −20 °C until analysis. The mixed standard solutions (1 mg/mL) were then diluted with methanol to appropriate concentration ranges (25–600 µg/mL) for establishing calibration curves.
2.4. Molecular docking experiment
To investigate the interaction between the target protein and studied compounds, molecular docking experiments against the thrombin and alkaline phosphatase model were carried out by using AutoDock Vina program (Trott and Olson, 2010). The structures of ligands were achieved from the PubChem database (http://pubchem.ncbi.nlm.nih.gov). The structure of thrombin (PDB code: 1UVU) and alkaline phosphatase (PDB code: 1EW8) was obtained from the protein data bank (http://www.rcsb.org/pdb). Receptor preparation includes: (i) removing water molecules and impurity ions; (ii) extraction of the co-crystallized ligand; (iii) adding polar hydrogen atoms. Docking calculations were performed based on the Lamarckian genetic algorithm (LGA). Most of the parameters for the docking calculations were set to default values. The predicted binding energy (kcal/mol) was calculated. From the docking results, the best scoring (i.e., with the lowest free energy of binding) docked model of a compound was chosen to represent its most favorable binding mode.
2.5. UPLC-ESI-MS system
The sample analysis was carried out using Agilent 1290 UPLC system coupled to a 6490 triple quadrupole mass spectrometer via an electrospray ionization (ESI) source. The detection of the analytes was achieved using the ESI interface in negative and positive ionization mode: nebulizer pressure 15 psi, capillary voltage 3,500 V, gas flow 11 L/min, vaporizer temperature 300 °C. Full-scan mode with a mass range of 100–1,500 m/z was employed to detect the ions.
2.6. UPLC-PDA system
The quantitative analysis was carried out on a Waters-Acquity UPLC system equipped with the auto sampler, binary gradient pump, and PDA detector. Chromatographic data were collected and evaluated using Empower 3 software. The chromatographic separation was carried out using a Kromasil C18 column (2.1 × 100 mm, 1.8 µm, 100 Å) along with the detective wavelength of 210 nm. The mobile phase consisted of 1% formic acid in water (A) and acetonitrile (B). The gradient elution program was 6% B (0–35 min), 6–10% B (35–38 min), 10% B (38–118 min), 10–19% B (118–121 min), 19% B (121–191 min). The flow rate was set at 0.20 mL/min and the column temperature was held at 25 °C. The sample volume injected was 1.0 µL.
2.7. Validation of the UPLC-PDA method
2.7.1. Linearity, limit of detection (LOD) and limit of quantitation (LOQ)
The mixed stock solution was diluted with methanol to appropriate concentrations for establishing the calibration curves (dilution factor = 1, 2, 3, 6, 12, 24) with each testing solution analyzed in triplicate. The calibration ranges for compounds 1-11 were 25-600 µg/mL. The linear regression analysis was performed on known concentrations of each analyte versus the corresponding peak areas. The regression coefficient (R2), slope, and y-intercept of the resulting calibration curves were determined, respectively. Limits of detection (LOD) and limits of quantitation (LOQ) of the single standard were evaluated on the basis of a signal-to-noise ratio (S/N) of about 3 and 10, respectively.
2.7.2. Precision, repeatability and stability
The intra-day and inter-day precisions of each analyte were measured by six replicated injections in 1 and 3 consecutive days, respectively. The repeatability was calculated using six duplicates of the sample solutions containing the eleven standard compounds. The stability was determined with the standard solution that was stored at room temperature for 0, 2, 4, 8, 12, and 24 h. Precision, repeatability and stability were investigated by relative standard deviation (RSD) value.
2.7.3. Accuracy
The accuracy was determined by measuring the degree of approach between the real value and the experimental data. A measure of accuracy was expressed as a percentage recovered of the true value. The recovery was calculated as follows:
2.7.4. Relative correction factors (RCFs) in QAMS and its reproducibility
Genistin was chosen as the internal reference standard for its easy availability and lower cost, and it is also the common ingredient of Puerariae Radix and Puerariae Flos. RCF (fx) was calculated according to the ratio of the peak areas and the ratio of the concentration between genistin and other analytes (Equation 1), With the results of fx, the concentration of bioactive components (Cx) in the samples could be determined by the following equations (Equation 2)22:
2.8. Statistical analysis
All the data were shown as the means ± standard deviations of three parallel measurements and statistical analysis were performed using the SPSS software. The data were analyzed using Levene’s test to check the homogeneity of variances (homoscedasticity). Those data that showed homoscedasticity were analyzed using one-way analysis of variance (ANOVA), followed by Tukey’s test. Data were deemed significant at P < 0.05. For mass spectral analysis, Mass Hunter Workstation Software Qualitative Analysis (version B.07.00) was used for data acquisition and analysis. In addition, Similarity analysis, hierarchical cluster analysis, and principal component analysis were conducted by SIMCA 13.0 software.
| 3. Result and discussion | ▴Top |
3.1. Identification of chemical markers in Puerariae Radix and Puerariae Flos
In this section, in order to find out the chemical markers for distinguishing the same parts of two Pueraria species, qualitative analysis and bioactivity test was investigated to identify chemical marker compounds by applying UPLC-ESI-MS, relative quantitative heatmap analysis and molecular docking experiment.
3.1.1. Optimization of UPLC-ESI-MS conditions
The UPLC conditions for UPLC-ESI-MS, including mobile phases, and column temperature, were optimized to achieve the simultaneous separation of Puerariae Radix and Puerariae Flos. In this study, gradient programs were developed to achieve the effective separation of samples. After a series of experiments, the acetonitrile-water system was used as the mobile phase because of the better separation performance. In consideration of the influence of pH change in the mobile phase on peak symmetry, we compared the different concentrations of formic acid, and 1% formic acid was proved to achieve the best effect for the separation of eleven compounds. Column temperature (25, 30, and 35 °C) was also examined, and the preferred column temperature was eventually chosen as 25 °C.
The MS conditions for UPLC-ESI-MS were also optimized. ESI in both positive and negative modes was evaluated in order to obtain a more suitable method for simultaneous detection of the analytes. We found that for the analytes in the samples, the negative mode provides higher sensitivity than the positive mode. Therefore, the ESI negative ionization mode was used for qualitative analysis. The major peaks in the TIC chromatograms were identified, with eleven compounds unambiguously assigned as 3′-hydroxy puerarin, puerarin, 3′-methoxy puerarin, puerarin xyloside, daidzin, genistin, tectoridin, ononin, daidzein, genistein, and tectorigenin by comparison of their chromatographic retention times, accurate molecular weights and characteristic mass fragment ions with those of the references (Fig. S1). The detailed chemical compositions of Puerariae Radix and Puerariae Flos are summarized in Table 1.
 Click to view | Table 1. MS data for characterization of compounds in Puerariae Radix and Puerariae Flos |
3.1.2. Relative quantitative heatmap analysis for chemical markers
To further display the difference between the different species samples, a total of forty samples belonging to two Pueraria species were collected (Table 2). The relative quantitative heatmap analysis was used to show the clustering effect using the normalized peak areas of the aforementioned eleven compounds. As shown in Fig. S2, these different Pueraria species samples were obviously clustered into two categories based on the compounds. These compounds could also be divided into two categories by the Ward linkage with Euclidean distance. Among them, the components of puerarin account for the largest proportion in the root of Pueraria species, and the flower of Pueraria species showed the highest level of tectoridin. Moreover, regardless of the flower or root parts, the total contents in the Pueraria lobata (Willd.) Ohwi was higher than that of the Pueraria thomsonii Benth. The results clearly demonstrated the distinct chemical profiles of the root and flower of Pueraria species. In detail, different species samples of Puerariae Radix and Puerariae Flos can also be distinctive from each other. Based on obtained data, these compounds were considered as the potential chemical markers.
Click to view | Table 2. Different species and geographical locations of forty Puerariae Radix and Puerariae Flos samples |
3.1.3. Determination of inhibitory activity against thrombin and alkaline phosphatase for chemical markers
The meaning of chemical marker is defined as the species-specific component from the plant, whose biological activity is closely related to its therapeutic effects (Rasheed et al., 2012). Thus, each potential chemical marker was tested for thrombin and alkaline phosphatase inhibition activity using the molecular docking experiment. The more negative value of the binding energy, as well as the maximum number of hydrogen bonds, showed how strongly a ligand binds to the receptor, and hence lower binding energy may lead to a higher inhibition activity.
Thrombin plays a pivotal role in thrombogenesis, thrombin inhibitors are used in the treatment of thrombotic diseases (Liu et al., 2010). As shown in Table S1, the eight components in Puerariae Radix showed stronger inhibitory activity against thrombin, when the DCH [name: 3-(7-diaminomethyl-naphthalen-2-yl)-propionic acid ethyl ester] positive control exhibited a binding energy value of −5.8 kcal/mol. Among these components, ononin showed the strongest inhibitory activity against thrombin. The interactions between thrombin and inhibitors was shown in Figs. 1 and 2.
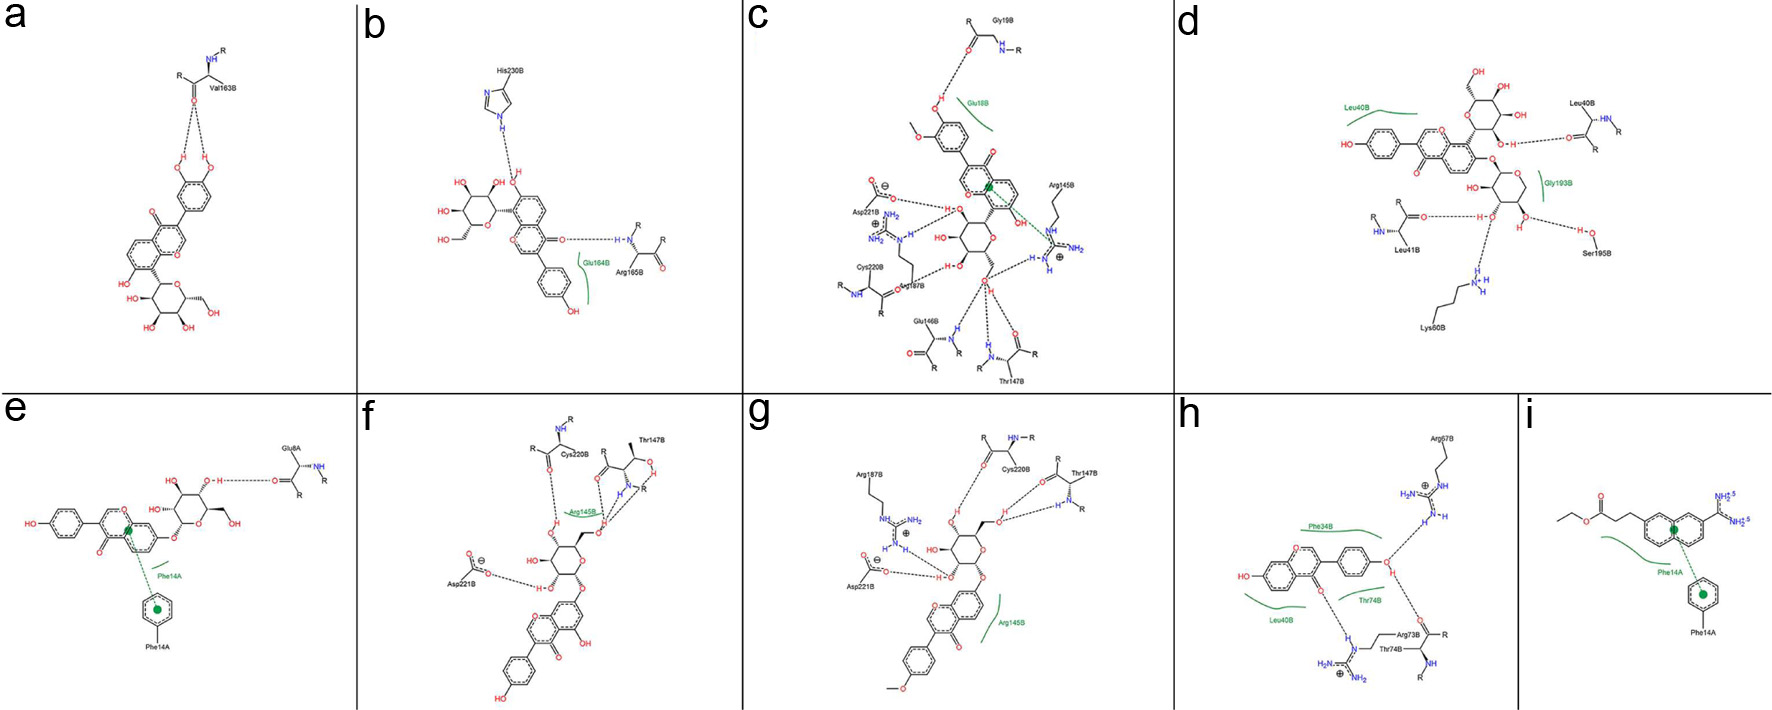 Click for large image | Figure 1. 2D interaction between inhibitors and thrombin: (a) OA and (b) UA. Interaction analysis generated through Poseview. The interaction pattern is composed of hydrogen bonds, visualized as black dashed lines; and hydrophobic contacts, which are represented by the residue labels and spline segments along the contacting hydrophobic ligand parts. |
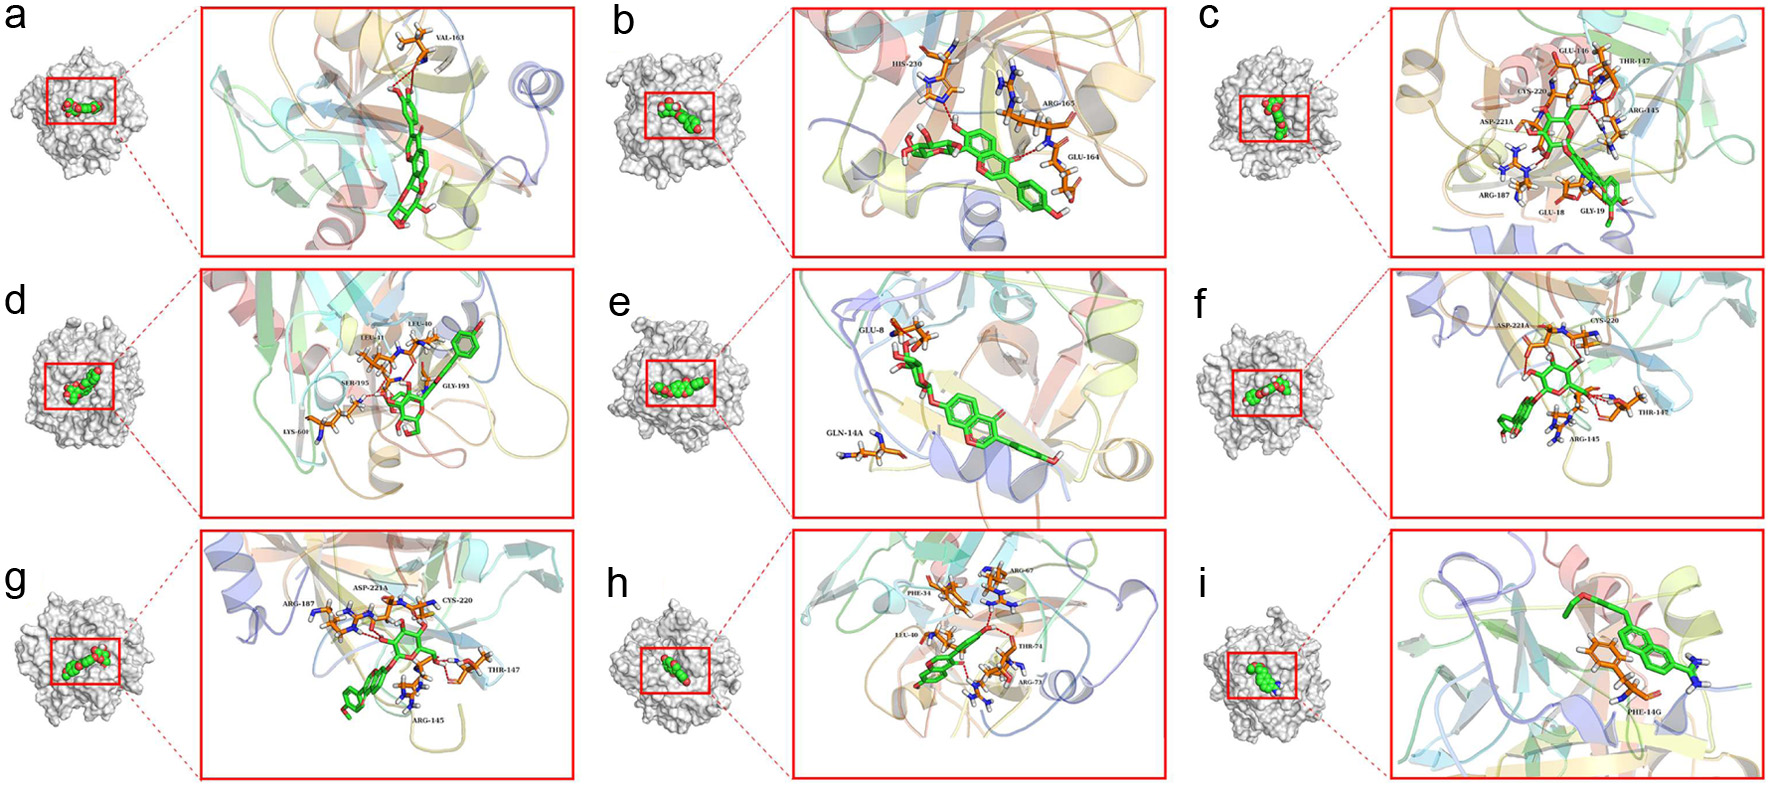 Click for large image | Figure 2. 3D interaction between inhibitors and thrombin: (a) OA and(b) UA. The crucial residues of thrombin and the inhibitor structures were represented using stick structures. The dashed lines represent hydrogen bonding interactions. The plots were generated by Pymol. |
Previous studies have suggested that excessive alcohol intake is associated with increased alkaline phosphatase activity (Balasubramaniam et al., 1988). Inhibition of alkaline phosphatase was critical to the detoxification of alcohol. The four components in Puerariae Flos were potent alkaline phosphatase inhibitors with respective binding energy values of −6.6 kcal/mol, −6.8 kcal/mol, −7.1 kcal/mol and −7.6 kcal/mol. PAE (name: phosphonoacetic acid) was used as a positive control, and its binding energy value with alkaline phosphatase was −3.8 kcal/mol (Table S2). Among these components, genistin showed the strongest inhibitory activity against alkaline phosphatase. The interactions between alkaline phosphatase and inhibitors was shown in Figs. 3 and 4.
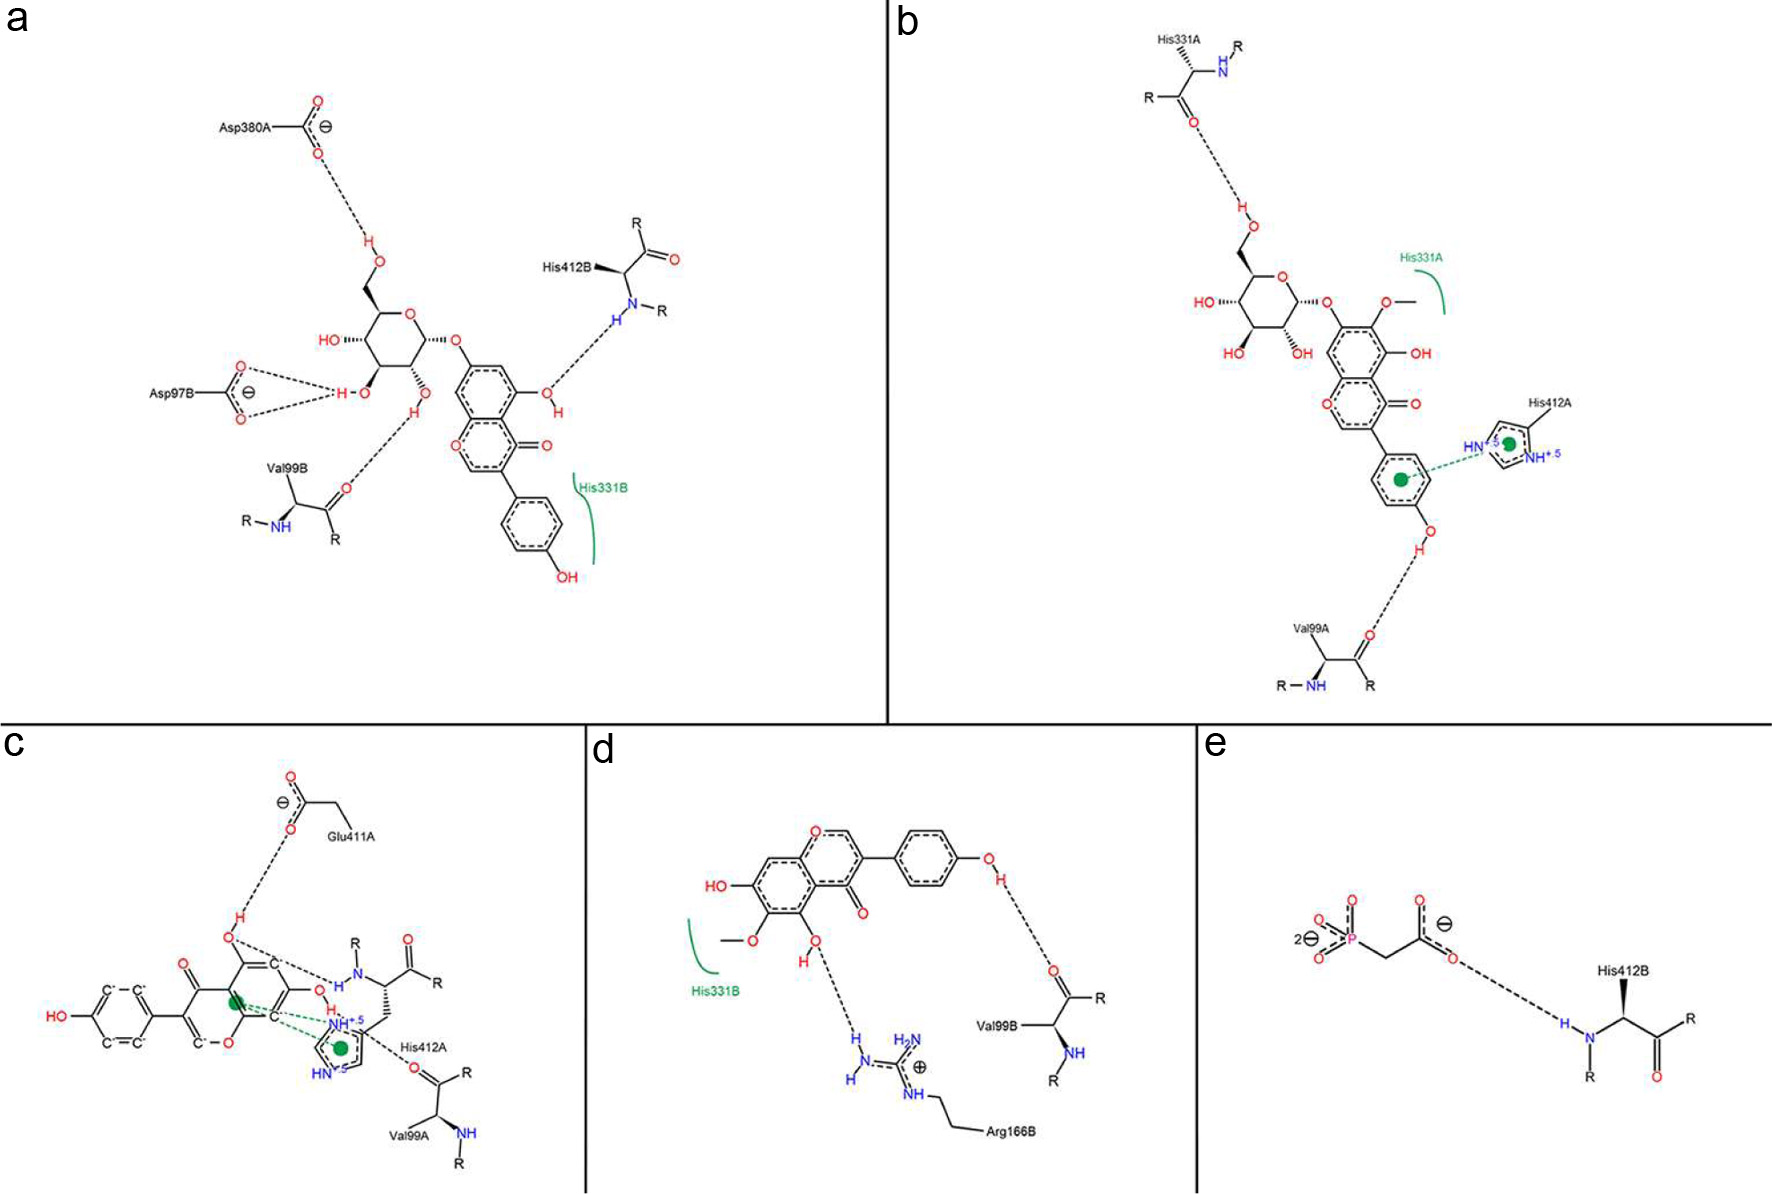 Click for large image | Figure 3. 2D interaction between inhibitors and alkaline phosphatase: (a) OA and (b) UA. Interaction analysis generated through Poseview. The interaction pattern is composed of hydrogen bonds, visualized as black dashed lines; and hydrophobic contacts, which are represented by the residue labels and spline segments along the contacting hydrophobic ligand parts. |
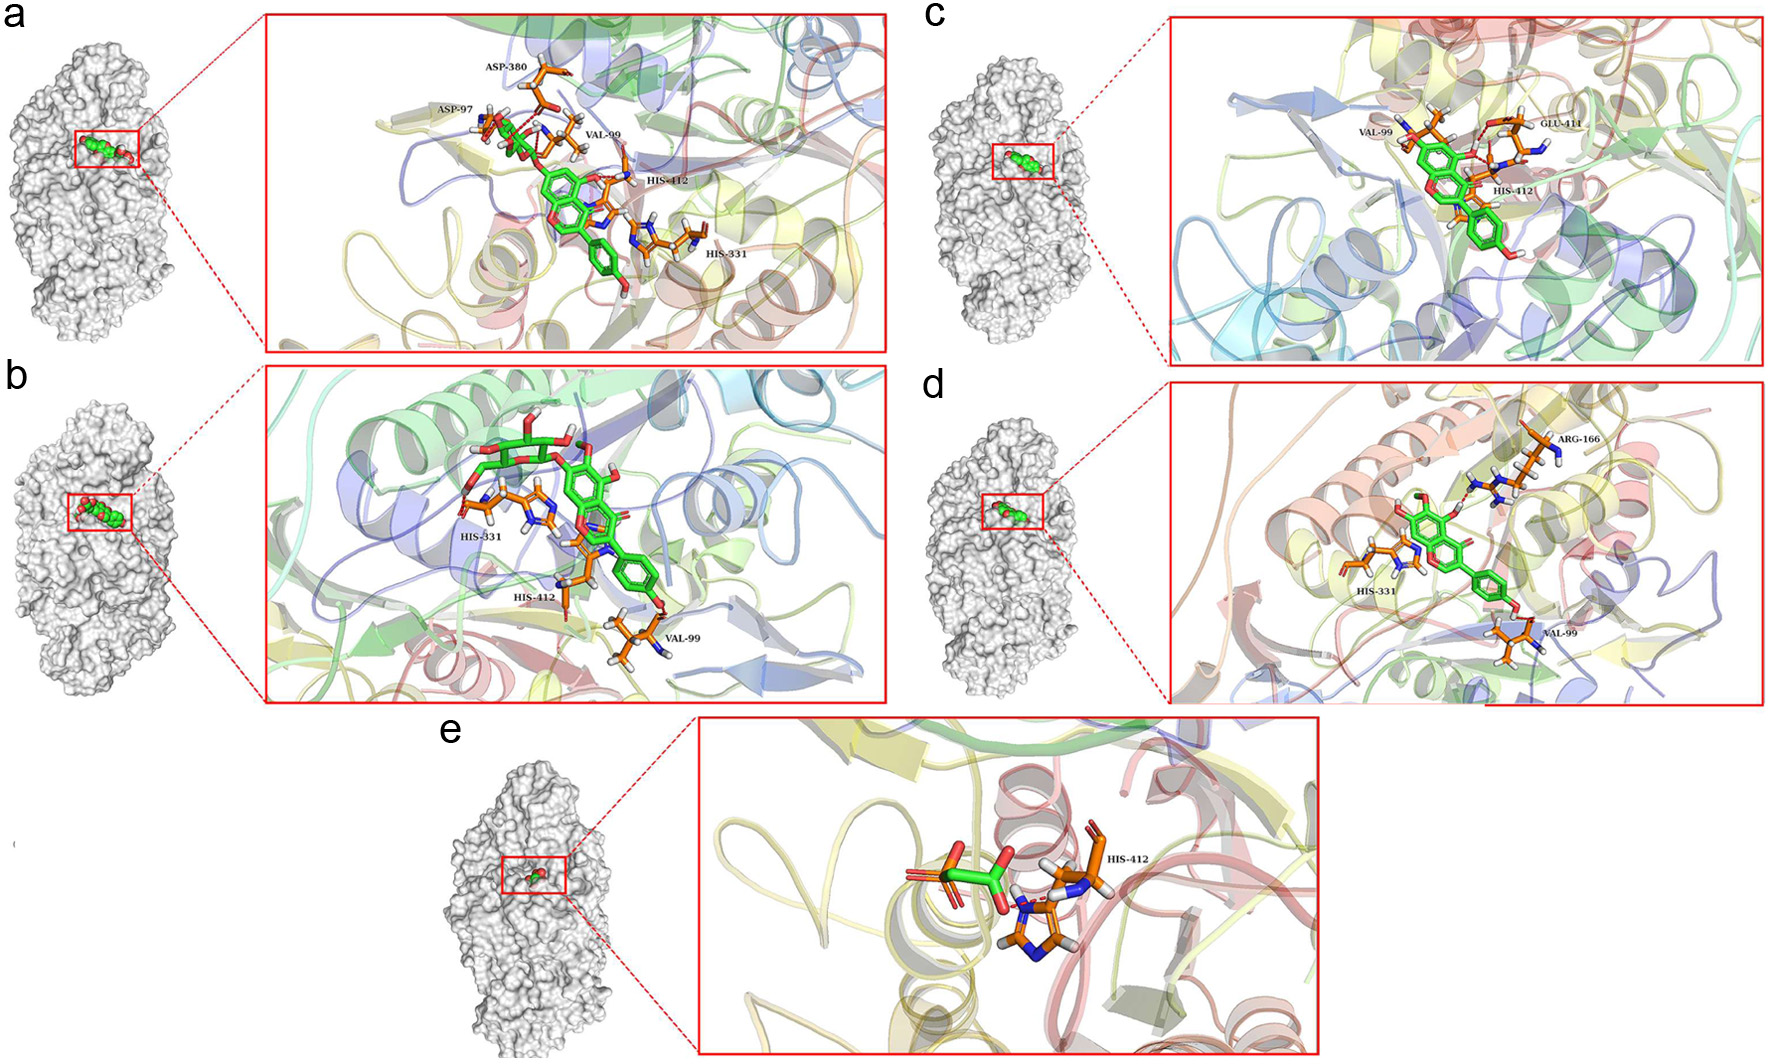 Click for large image | Figure 4. 3D interaction between inhibitors and alkaline phosphatase:(a) OA and(b) UA. The crucial residues of alkaline phosphatase and the inhibitor structures were represented using stick structures. The dashed lines represent hydrogen bonding interactions. The plots were generated by Pymol. |
Taken together, these potential markers with the potent bioactivity and significant content differences posed mostly influential features for the differentiation between the Pueraria lobata (Willd.) Ohwi and Pueraria thomsonii Benth, therefore could be used as chemical markers for further research.
3.2. Development of QAMS method
In this section, in order to observe the actual concentration differences of these discriminating phytochemicals between species, an effective UPLC-based QAMS method was developed for simultaneous determination of the chemical marker compounds in the two species.
3.2.1. Selection of detection wavelength
Generally, the maximum UV absorption wavelength of the target analyte was often chosen as the detection wavelength. However, the dominant constituents of most herbs are different structural features and properties. To solve this problem, methods with an external reference standard or variable wavelength program were developed. For the analysis of multi-components, a preferable UV detection wavelength is an important parameter because of its structural diversity. Based on obtained data, the chemical marker compounds exhibited a remarkable absorbance in the region between 248.4 and 262.6 nm. Chemical structures and UV spectrums of eleven compounds were shown in Table S3. As illustrated in Fig. 5, the detection wavelength was set at 254 nm, where all the targeted compounds had adequate absorption.
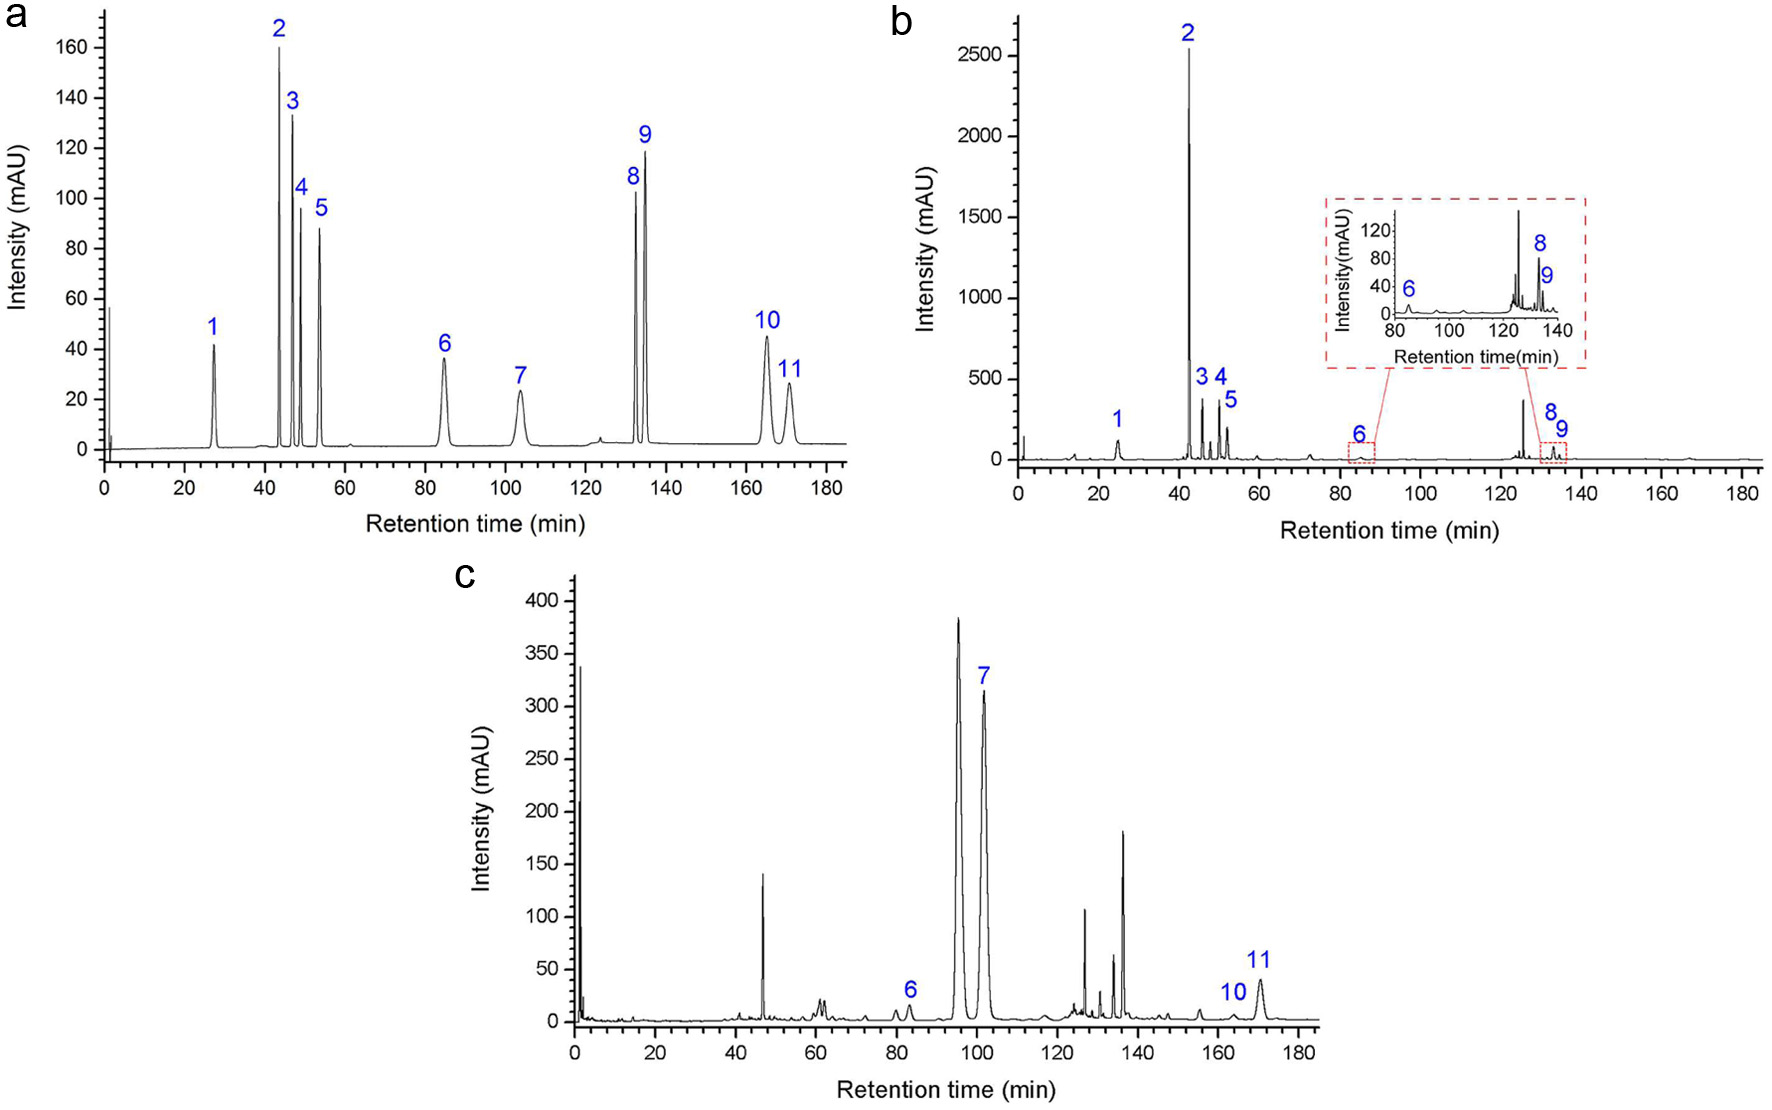 Click for large image | Figure 5. UPLC-PDA chromatograms of (a) standard substances, (b) RPL sample solution and (c) PTF sample solution. |
3.2.2. Analytical method validation
The calibration curve of each standard was constructed by plotting the chromatographic peak area (y) versus the corresponding concentration (x) (Fig. S3). As shown in Table S4, all the eleven compounds exhibit good linearity in the determination ranges (R2 ≥ 0.9999). LOD and LOQ of these compounds ranged from 0.09 to 0.67 µg/mL and 0.31 to 2.22 µg/mL, respectively. These results indicated that the chromatographic condition is sensitive and reliable. Intra-day and inter-day variations were used to assess precision. The RSD values of intra- and inter-day variations were in the range of 0.158–0.341% and 0.432–0.742%, respectively (Tables S5–S7). The stability was determined by measuring the peak area of the sample solution stored at room temperature at different time points (0, 2, 4, 8, 12, and 24 h after preparation). It was found that the eleven compounds were stable within 24 h (RSD ≤ 1.460%) (Tables S5 and S8). To confirm the repeatability, six different sample solutions prepared from the same sample were analyzed. As seen in Tables S5, S9, and S10, RSD values were less than 6.800%, which showed high repeatability under the chromatographic condition we established. In the accuracy test, an accurately-measured amount of individual standards were added to the samples, with six replicates. The mixture was extracted and analyzed by using the method mentioned above. As shown in Tables S11–S14, the recoveries of the eleven compounds ranged from 99.894% to 100.174%, indicating the suitability of the method. The results showed that the established UPLC-based QAMS method was sufficiently precise, sensitive, and reliable to be applied for a simultaneous determination of multi-components in Puerariae Radix and Puerariae Flos.
3.2.3. Robustness test of RCFs
The RCF is a constant of proportionality in a computational formula and was calculated using Eq. (1). Genistin was used as the internal reference and the RCFs of different components to genistin were calculated, respectively (Table S15). The various errors from the instrument or analysts inevitably affect the accuracy of the QAMS method which should be fully considered. Thus, we evaluated the effects of different formic acid concentrations (±0.2%), the ratio of acetonitrile in the gradient program (±0.5%, v/v), flow rate (±0.02 mL/min), injection volumes (±0.2 µL) and chromatographic column temperatures (±2 °C). As shown in Table S16, The RSDs for all the variations were <5%, which indicated that the QAMS analytical method was feasible and could be well applied to routine analysis.
3.2.4. Method comparison between QAMS and ESM
To evaluate the feasibility of QAMS for quantitative analysis, the content of eight analytes in Puerariae Radix samples and four analytes in Puerariae Flos samples were calculated by ESM and QAMS methods, respectively. The results showed that the RSD values of each compound were no more than 6% (Tables S17 and S18), which indicates QAMS method was reliable for the quantification of each component in Puerariae Radix and Puerariae Flos samples.
3.3. Application to real Pueraria samples
In this section, these chemical markers were further quantitatively analyzed by the developed QAMS method, and SA followed by HCA and PCA were also performed to evaluate and distinguish the flower and root of Pueraria species from different species.
3.3.1. Determination of sample preparation method
An appropriate extraction method was important to obtain optimal quantitative analysis performance. In this work, ultrasound-assisted solvent extraction method was used to obtain effective extraction. The extraction solvent, solvent-to-solid ratio, extraction time and extraction temperature, which have an influence on the sample extraction procedure were optimized and the extraction yield of chemical marker compounds in samples was evaluated.
Our results revealed that Puerariae Radix samples were extracted with 70% ethanol at 70 °C for 50 min and solvent-to-solid ratio was set at 20 mL/g, which gave the highest extraction yield (Fig. S4 and Tables S19–S22). Similarly, the ethanol-water proportion, solvent-to-solid ratio, extraction time, and extraction temperature were fixed at 60%, 20 mg/mL, 40 min and 30 °C, respectively, for the subsequent analysis of Puerariae Flos (Fig. S5 and Tables S2–S26).
3.3.2. Quality evaluation of the root and flower of Pueraria species from different geographical origins
In the present study, a total of forty samples belonging to two Pueraria species were collected (Table 2). The proposed QAMS method was applied to determination of the accurate contents of the eleven chemical markers in forty batches of the Pueraria samples covering two species. The contents of quantitative determination are shown in Tables S27 and S28.
On the other hand, one-way ANOVA followed by Tukey’s multiple comparison tests were carried out to test the significance of differences in individual compound levels among the groups. The results (Tables S27 and S28) indicated that the mean contents of the eleven chemical markers significantly differed (P < 0.05) among the two species. The Radix Puerariae Lobatae contained more 3′-Hydroxy puerarin, Puerarin, 3′-Methoxy puerarin, Puerarin xyloside, Daidzin, Genistin, Ononin, and Daidzein, the total level of eight compounds was significantly higher than those in the Radix Puerariae Thomsonii. In addition, the Puerariae Thomsonii Flos showed the lower level of Genistin, Tectoridin, Genistein and Tectorigenin, the total content of four compounds was obviously lower than that in the Puerariae Lobatae Flos.
Overall, our data from different samples elucidated that the chemical marker compounds were significantly different between Pueraria lobata (Willd.) Ohwi and Pueraria thomsonii Benth.
3.3.3. Similarity analysis (SA) of UPLC-based fingerprints
In order to study the similarities and/or differences among the two Pueraria species, forty samples collected from almost all cultivation areas of the two species were subjected to UPLC-based fingerprint analysis and quantification of multi-ingredients with similarity analysis.
The UPLC–PDA fingerprints of the two different Pueraria species are shown in Figs. S6, S7a and b shows representative UPLC fingerprints of the root and flower of Pueraria lobata (Willd.) Ohwi and Pueraria thomsonii Benth. The differences among the species are quite obvious visually, and the peak-to-peak ratios were found to be significantly different from each other, especially for the peaks 1–11 which were clearly assigned to eleven chemical markers.
Based on these findings, SA was further performed using the contents of the eleven important peaks as input data. Results of SA are shown in Fig. 6, a low correlation coefficient (blue module) indicates a poor similarity between the samples, and a value of the correlation coefficient approaching 1.0 (red module) represents a perfect similarity of the samples. It is easy to see that the similarity value between different species in samples was obviously different. The correlation coefficients between PTR and PLR are ranged from 0.462 to 0.635, and it is ranged from 0.430 to 0.698 between PLF and PTF. In Puerariae Radix, the similarity value between A10 and B6 was the lowest (0.462), compared to other different samples. Similarly, the correlations between C4 and D4 were lower than those of other Puerariae Flos samples.
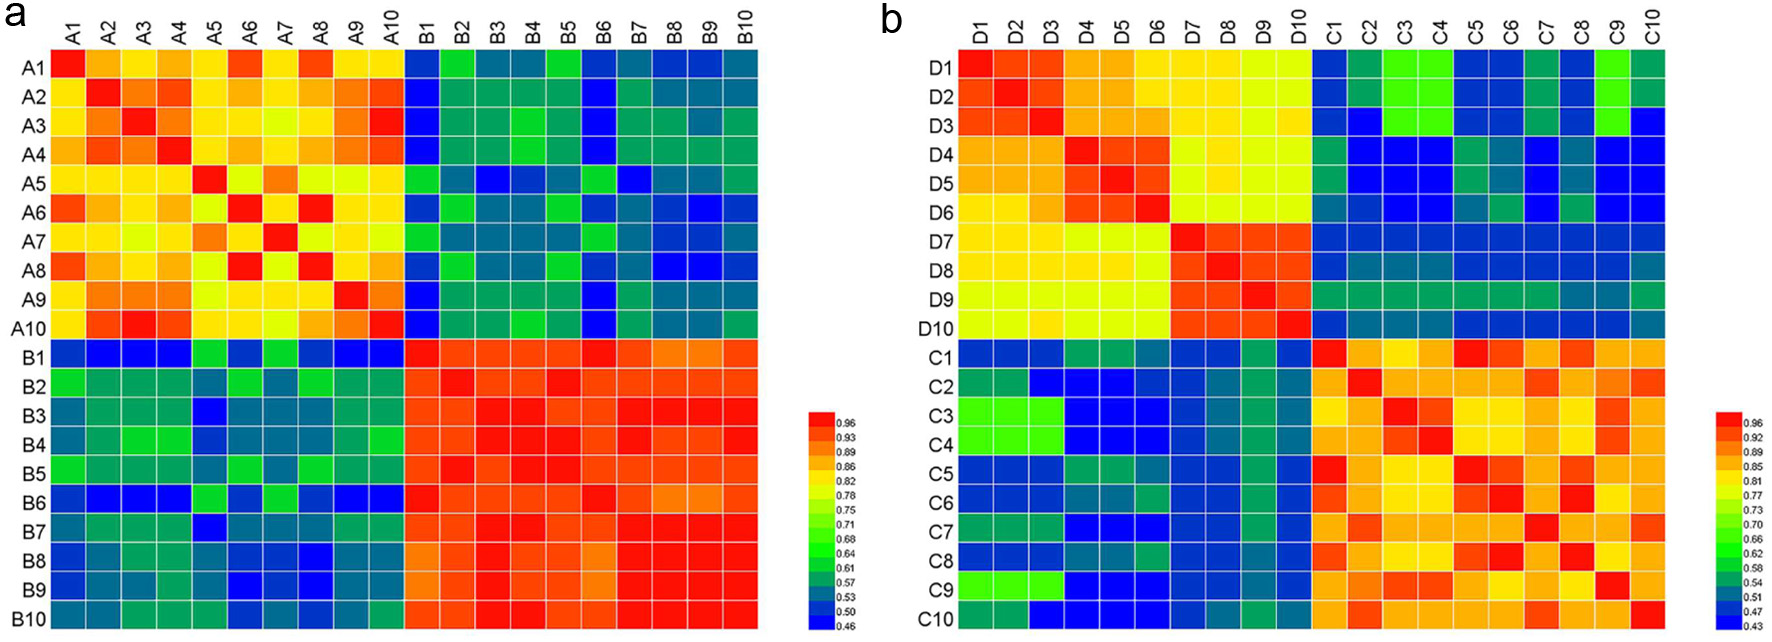 Click for large image | Figure 6. A heatmap based on the SA results. (a) Puerariae Radix (A1-A10: RPL, B1-B10: RPT) and (b) Puerariae Flos (C1-C10: PTF, D1-D10: PLF). The color key indicates the relative abundant of the marker compounds, blue: lowest, red: highest. |
Hence, the differentiation of similarity indicates that the eleven chemical markers were mainly responsible for the discrimination of the species of Puerariae Radix and Puerariae Flos samples from different geographical origins, and the HCA results showed that the interspecific differences of the three species were much larger than their intraspecific differences.
3.3.4. Hierarchical cluster analysis (HCA) of samples
In order to visualize similarities among samples through linkage distances, hierarchical cluster analysis (HCA), an unsupervised learning method, was employed to generate dendrograms according to chemical marker contents of forty batches of Puerariae Radix and Puerariae Flos, respectively. As shown in Fig. 7, either Puerariae Radix or Puerariae Flos samples could be clearly classified into four regions in terms of species. Clusters I and II were formed by PLR and PTR samples, respectively. Cluster III and IV consisted of PTF and PLF samples, respectively. These results suggested that based on their chemical markers, the Pueraria species of both roots and flowers could be discriminated according to their species using QAMS analysis and hierarchical cluster analysis. The result was in accordance with those provided in the SA study, the same species collected from the different regions could not be separated by HCA. It was shown that the environmental stimuli or growth place of influence in the chemical profiling is extremely limited.
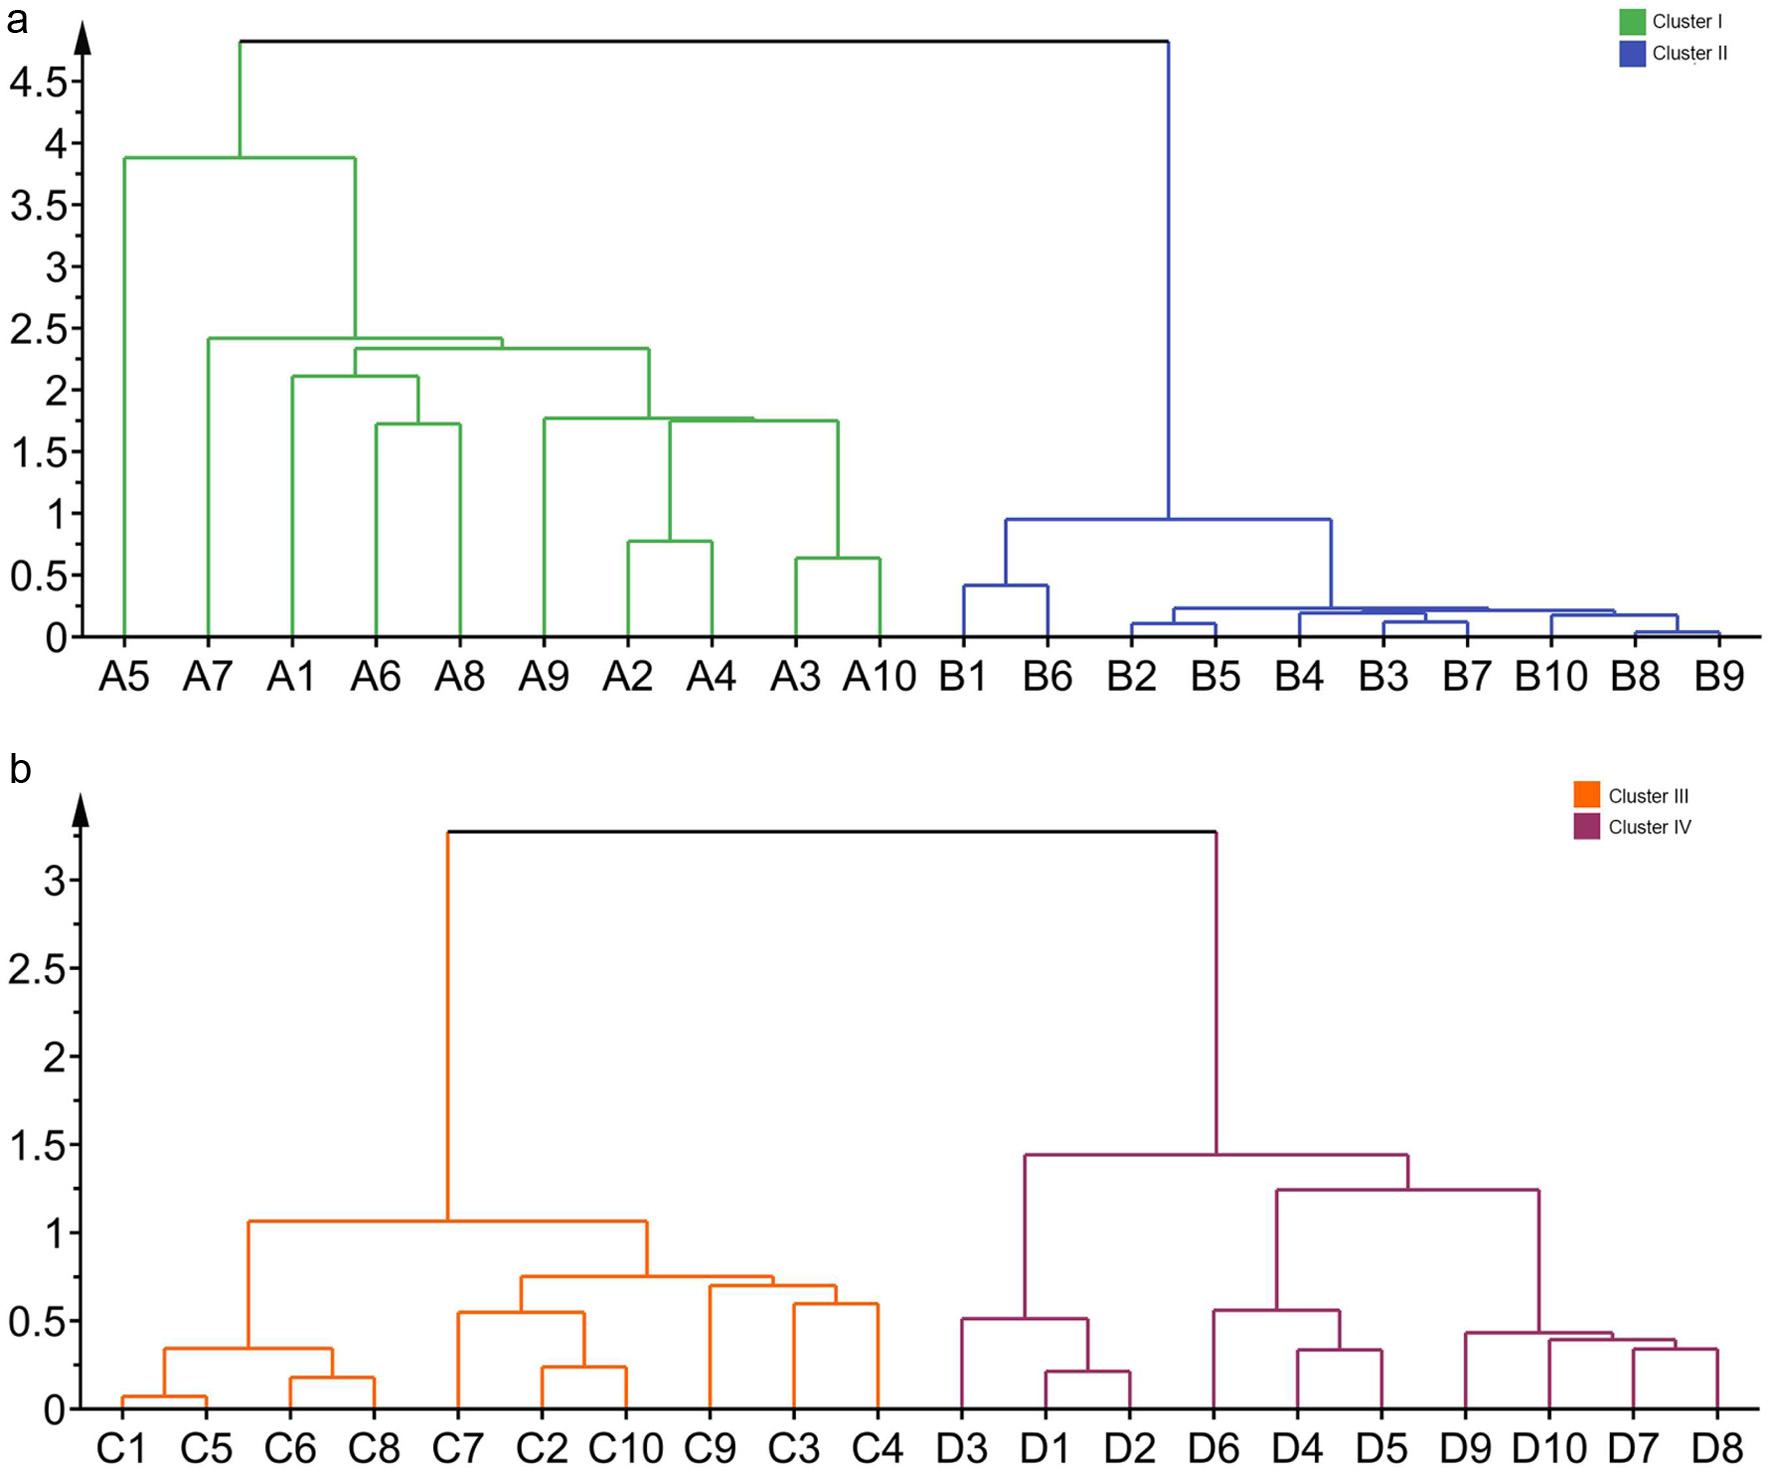 Click for large image | Figure 7. The results of HCA of forty Puerariae Radix and Puerariae Flos samples. A1-A10 were RPL samples; B1-B10 were RPT samples; C1-C10 were PTF samples; D1-D10 were PLF samples. |
3.3.5. Principal component analysis (PCA) of samples
In this study, the contents of eleven chemical marker compounds were chosen as the input variables, and the differences between the root and flower of two Pueraria species samples were further displayed by the Principal Component Analysis (PCA). The PCA score plot for all samples is shown in Fig. 8, where each point represented an individual sample. All Puerariae Radix and Puerariae Flos samples could be clearly classified into two groups by combining PC1 with PC2 corresponding to the two species, respectively, which indicated that their phytochemical profiles were obviously different.
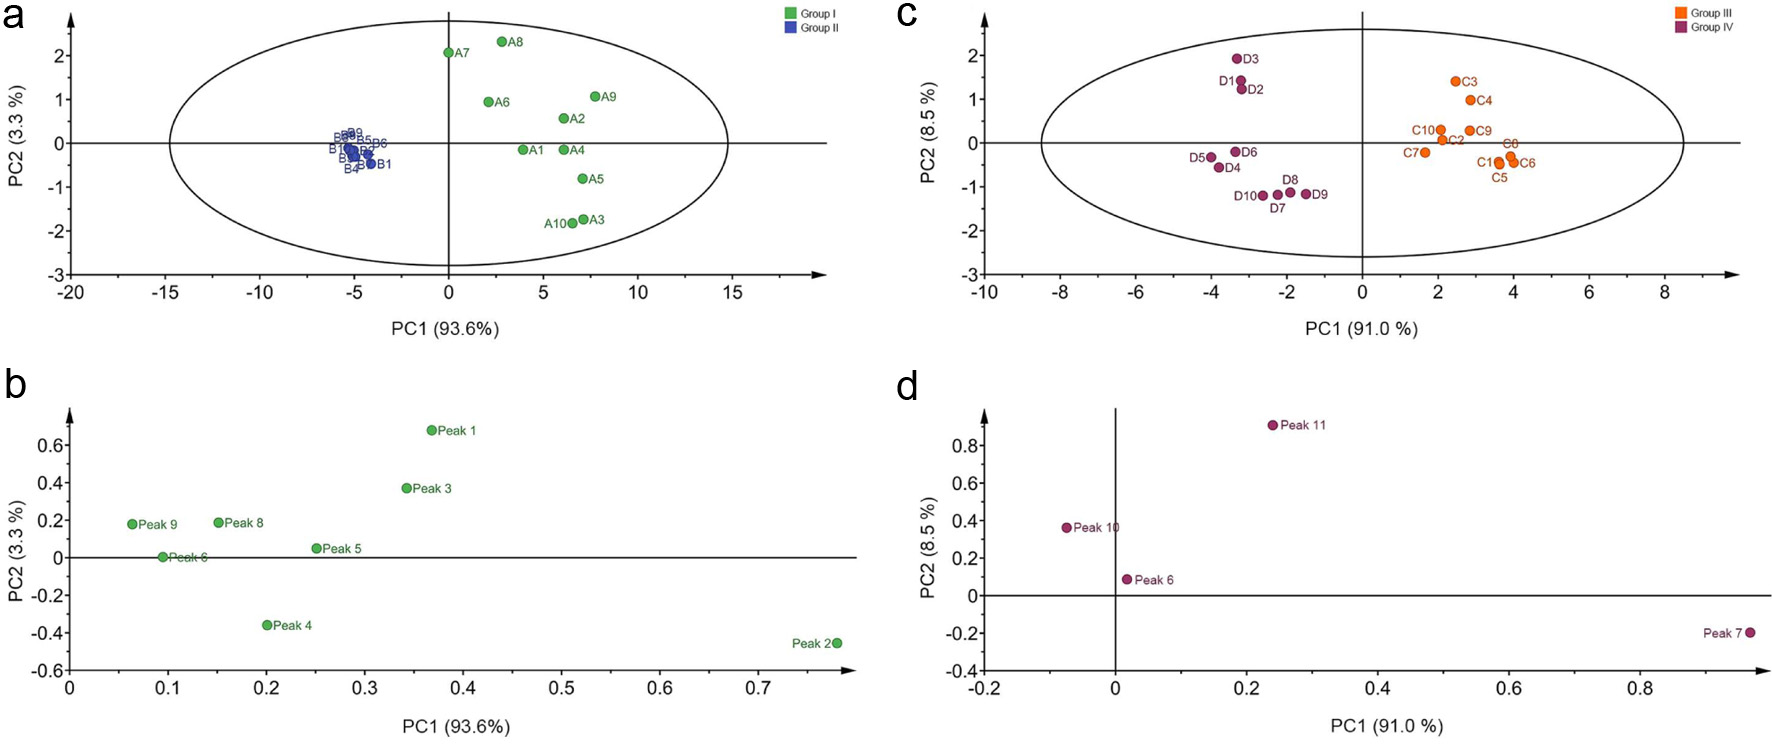 Click for large image | Figure 8. The score plots and loading plots obtained from PCA analysis of forty Puerariae Radix and Puerariae Flos samples. (a) score plots of RPT and RPL; (b) loading plots of RPT and RPL; (c) score plots of PLF and PTF; (d) loading plots of PLF and PTF. Peak 1-11 were 3′-hydroxy puerarin, puerarin, 3′-methoxy puerarin, puerarin xyloside, daidzin, genistin, tectoridin, ononin, daidzein, genistein and tectorigenin, respectively. |
Group I consisted of PLR samples, group II consisted of PTR samples, group III and group IV consisted of PTF and PLF samples, respectively. These findings were in good agreement with the HCA results. It is well-known that the phytochemical levels of herbal medicines can be affected by geographical factors (e.g., soil, temperature and rainfall) besides the species (Lv et al., 2016). However, the PCA score plot showed that the species is still the most important factor with respect to the effect on phytochemicals variation of Puerariae Radix and Puerariae Flos samples compared with geographical factors.
Furthermore, the loading plot reflects both how much each variable contributed to the PC score plot and how well the PC score plot takes into account the variation of that variable over the data points. The corresponding loadings plot of PCA is shown in Fig. 8. Eleven chemical marker components (eight in Puerariae Radix, four in Puerariae Flos) were found to play an important role in separating the two species, and so they are capable of and practical for the quality control of Pueraria species, which could benefit the identification of PLR and PTR, as well as the differentiation of PTF and PLF samples.
| 4. Conclusions | ▴Top |
The root and flower of two Pueraria species are commonly used as substitutes for each other and may cause efficacy instability or not have the intended effect. Thus, botanical species identification and species-specific compound determination is an important part of ensuring consistent biological effects and quality control improvement of Pueraria species products. In this paper, we described a species identification and quality assessment paradigm that involved a set of integrated strategies to evaluate and distinguish the flower and root of Pueraria species from different species. First of all, an integrated approach was established to identify chemical marker compounds by applying UPLC-ESI-MS, relative quantitative heatmap analysis and molecular docking experiment. A total number of eleven constituents were simultaneously assayed in Puerariae Radix and Puerariae Flos. The content determination data of QAMS demonstrated the quality of PLR was better than that of PTR, and that of the PLF was superior to the PTF. Therefore, the PLR or PLF could not be used as an alternative to PTR or PTF from a chemodiversity perspective. The combination results of UPLC-based fingerprint and SA showed that the two species had significant differences in their phytochemical profiles, particularly with regard to the eleven chemical marker components. Using either PCA or HCA, it was clear to differentiate Pueraria lobata (Willd.) Ohwi and Pueraria thomsonii Benth, and the sample classification is closely related to eleven chemical marker constituents. Moreover, our studies demonstrated that species imposed a significant effect on phytochemical levels of Puerariae Radix and Puerariae Flos samples compared with geographical origins. Overall, our study not only established a method of simultaneous determination of multiple types of chemical marker constituents of Puerariae Radix and Puerariae Flos, but provided an effective and efficient approach to their quality control of them. Our findings are conducive to distinguish orthologues or paralogues of them, which will be helpful for ensuring their safety and efficacy.
| Supporting material | ▴Top |
Fig. S1. Full-scan mass spectra of the eleven analytes. The selected ions corresponding to compounds 1-11 were monitored at m/z 431.0, 415.1, 445.1, 547.1, 415.1, 430.7, 461.0, 267.1, 253.0, 269.1, and 298.8, respectively (i.e., 3′-hydroxy puerarin, puerarin, 3′-methoxy puerarin, puerarin xyloside, daidzin, genistin, tectoridin, ononin, daidzein, genistein, and tectorigenin).
Fig. S2. Relative quantitative heatmap analysis of the chemical markers in the PLF (green), PTF (orange), RPL (red) and RPT (blue) samples (chemical marker 1-11: 3′-hydroxy puerarin, puerarin, 3′-methoxy puerarin, puerarin xyloside, daidzin, genistin, tectoridin, ononin, daidzein, genistein, and tectorigenin).
Fig. S3. Standard curves of eleven analytes. (a) 3′-Hydroxy puerarin, (b) puerarin, (c) 3′-Methoxy puerarin, (d) puerarin xyloside, (e) daidzin, (f) genistin, (g) tectoridin, (h) ononin, (i) daidzein, (j) genistein, (k) tectorigenin. Data within dashed line are within 95% confidence interval.
Fig. S4. Effect of ethanol-water proportion (a), solvent-to-solid ratio (b), extraction time (c) and extraction temperature (d) on the yield of eight compounds in Puerariae Radix (n = 3).
Fig. S5. Effect of ethanol-water proportion (a), solvent-to-solid ratio (b), extraction time (c) and extraction temperature (d) on the yield of four compounds in Puerariae Flos (n = 3).
Fig. S6. UPLC chromatograms for (a) Puerariae Radix samples (A1-A10: RPL samples, B1-B10: RPT samples) and (b) Pueraria Flos samples (C1-C10: PTF samples, D1-D10: PLF samples).
Fig. S7. Representative mirror plot comparison of (a) RPT (red) and RPL (black) samples, (b) PTF (black) and PLF (red) samples.
Table S1. Molecular docking results between compounds and thrombin.
Table S2. Molecular docking results between compounds and alkaline phosphatase.
Table S3. Chemical structures and UV spectra of eleven compounds.
Table S4. Linearity and sensitivity of the UPLC-PDA analysis.
Table S5. Summary of precision, repeatability, and stability for eleven components in Puerariae Radix and Puerariae Flos.
Table S6. Intra-day precision results of UPLC-based QAMS analytical method (Mean ± SD, n = 6).
Table S7. Inter-day precision results of UPLC-based QAMS analytical method (Mean ± SD, n = 6).
Table S8. Stability results of UPLC-based QAMS analytical method.
Table S9. Repeatability results of UPLC-based QAMS analytical method in Puerariae Radix (Mean ± SD, n = 6).
Table S10. Repeatability results of UPLC-based QAMS analytical method in Puerariae Flos (Mean ± SD, n = 6).
Table S11. Accuracy results of UPLC-based QAMS analytical method in Puerariae Radix.
Table S12. Accuracy results of UPLC-based QAMS analytical method in Puerariae Flos.
Table S13. Accuracy results of UPLC-based QAMS analytical method in Puerariae Radix.
Table S14. Accuracy results of HPLC-based QAMS analytical method in Puerariae Flos.
Table S15. RCFs of each analyte in Puerariae Radix and Puerariae Flos (Mean ± SD, n = 6).
Table S16. Influence of gradient elution programs, formic acid concentration, flow rates, injection volumes, and chromatographic column temperatures on RCFs.
Table S17. Results comparing ESM and QAMS method in Puerariae Radix (Mean ± SD, n = 6).
Table S18. Results comparing ESM and QAMS method in Puerariae Flos (Mean ± SD, n = 6).
Table S19. Comparative study of different ethanol-water proportion for the extraction yields of eight compounds from Puerariae Radix (Mean ± SD, n = 3).
Table S20. Comparative study of different solvent-to-solid ratio for the extraction yields of eight compounds from Puerariae Radix (Mean ± SD, n = 3).
Table S21. Comparative study of different extraction time for the extraction yields of eight compounds from Puerariae Radix (Mean ± SD, n = 3).
Table S22. Comparative study of different extraction temperature for the extraction yields of eight compounds from Puerariae Radix (Mean ± SD, n = 3).
Table S23. Comparative study of different ethanol-water proportion for the extraction yields of four compounds from Puerariae Flos (Mean ± SD, n = 3).
Table S24. Comparative study of different solvent-to-solid ratio for the extraction yields of four compounds from Puerariae Flos (Mean ± SD, n = 3).
Table S25. Comparative study of different extraction time for the extraction yields of four compounds from Puerariae Flos (Mean ± SD, n = 3).
Table S26. Comparative study of different extraction temperature for the extraction yields of four compounds from Puerariae Flos (Mean ± SD, n = 3).
Table S27. The contents of the eight compounds in different Puerariae Radix samples.
Table S28. The contents of the four compounds in different Puerariae Flos samples.
Acknowledgments
This study was supported by Qin Chuangyuan’s “Scientists+Engineers” Team Construction: Key Technologies for Quality Control of Licorice and Industrialization of the “Scientists+Engineers” Team (2025QCY-KXJ-108), The second batch of Yulin’s “Light of Science and Technology” and “Scientists+Engineers” innovative talent team project: “Research on the Conversion Technology of Licorice Health Products+Construction of the ‘Chief Scientist+Chief Engineer’ Team” (2024-KJZG-K+G-011), College Student Innovation and Entrepreneurship Training (202310069142).
Conflict of interest
The authors declare that there are no conflicts of interest.
| References | ▴Top |