| Journal of Food Bioactives, ISSN 2637-8752 print, 2637-8779 online |
| Journal website www.isnff-jfb.com |
Original Research
Volume 19, September 2022, pages 154-163
Optimization of ultrasonic-assisted extraction of bioactive compounds from Bupleuri Radix by response surface methodology and HPLC analysis
Jiachen Suna, *, #, Xuejiao Lib, #, Zhuo Quc, #, Shengjie Dongd, e, Hui Zhaoa, *
aTianjin Key Laboratory of Food and Biotechnology, Tianjin International Joint Center of Food Science and Engineering, State Experimental and Training Centre of Food and Drug, School of Biotechnology and Food Science, Tianjin University of Commerce, Tianjin 300134, China
bCentral Laboratory, Endocrine and Metabolic Disease Center, The First Affiliated Hospital and College of Clinical Medicine of Henan University of Science and Technology; Medical Key Laboratory of Hereditary Rare Diseases of Henan; Luoyang sub-center of National Clinical Research Center for Metabolic Diseases, Luoyang 471003, China
cSchool of Pharmacy, Ningxia Medical University, Yinchuan, 750004, China
dSchool of Pharmaceutical Science and Technology, Tianjin University, Tianjin 300072, China
eFaculty of Education and Sports, Guangdong Baiyun University, Guangzhou 510450, China
*Corresponding author: Jiachen Sun and Hui Zhao, Tianjin Key Laboratory of Food and Biotechnology, Tianjin International Joint Center of Food Science and Engineering, State Experimental and Training Centre of Food and Drug, School of Biotechnology and Food Science, Tianjin University of Commerce, Tianjin 300134, China. E-mail: sjcsunjiachen@foxmail.comand zhaohui@tjcu.edu.cn
DOI: 10.31665/JFB.2022.18321
Received: August 26, 2022
Revised received & accepted: September 28, 2022
| Abstract | ▴Top |
A simple and efficient ultrasonic-assisted extraction of bioactive compounds from raw Bupleuri Radix and vinegar-baked Bupleuri Radix was developed and optimized by using quantitative analysis of multi-components by a single-marker combined with response surface methodology approaches. The quantitative analysis of multi-components by a single-marker analytical method based on high-performance liquid chromatography coupled with a photodiode array detector was established and applied to determine the contents of six bioactive compounds in raw Bupleuri Radix and vinegar-baked Bupleuri Radix. In order to maximize extraction of six bioactive compounds in raw Bupleuri Radix and vinegar-baked Bupleuri Radix, the ultrasonic-assisted extraction conditions were obtained by the response surface methodology coupled with Box–Behnken design. The conditions of ultrasonic-assisted extraction were found to be effective for the extraction of bioactive compounds from raw Bupleuri Radix and vinegar-baked Bupleuri Radix. The test results showed that the difference in saikosaponins contents in these samples was obvious; a quantitative analysis of saikosaponins will contribute significantly to improving the quality control of raw Bupleuri Radix and vinegar-baked Bupleuri Radix. In conclusion, the designed protocol is suitable for the quality control of raw Bupleuri Radix and vinegar-baked Bupleuri Radix.
Keywords: Raw Bupleuri Radix; Vinegar-baked Bupleuri Radix; Saikosaponins; Quantitative analysis of multi-components by a single-marker; Response surface methodology
| 1. Introduction | ▴Top |
Bupleuri Radix (BR), a well-known edible herb and Traditional Chinese Medicine (TCM), has been utilized to treat the common cold with fever, influenza, hepatitis, malaria, and menoxenia for more than 2000 years (Yang et al., 2017). ‘Genuine’ BR is the dry radix of Bupleurum chinense DC. or Bupleurum scorzonerifolium Willd., but some substitutes are also habitually utilized as BR in some local areas. Among these, the morphological characteristics of the dried roots of B. marginatum and Pe. praeruptorumare similar to those of the authentic species of BR; thus, they are easily confused with common adulterants of BR (Xin et al., 2018). When raw Bupleuri Radix (RBR) was mixed thoroughly with vinegar, and then baked to dry, it was changed to vinegar-baked Bupleuri Radix (VBBR). It was demonstrated that VBBR has a much stronger effect on acesodyne and bile secretion than that of the RBR (Zhao et al., 2016). The discrimination between RBR and VBBR is a basic and important task, not only for the investigation of the mechanism of RBR processing, but also for the quality control and effective use of RBR and VBBR. At present, the quality evaluation of RBR and VBBR was analyzed only using two components (saikosaponin A and saikosaponin D) and ignored the other active ingredients (Chinese Pharmacopoeia Commission, 2020). These problems resulted in the flooding of RBR adulterants and inconsistent therapeutic efficiency of VBBR. Therefore, there is a need for active multi-components to evaluate the quality of RBR and VBBR.
The major active constituents of BR and their processed products are saikosaponins (Tian et al., 2009; Xu et al., 2012), which have been proven to possess significant biological activities, including anti-hepatitis (Chiang et al., 2003), anti-inflammatory (Recio et al., 1995), anti-tumor (Tsai et al., 2002) and immunoregulatory effects (Kato et al., 1994). Among these, saikosaponin A, saikosaponin B1, saikosaponin C, saikosaponin D, saikosaponin E and saikosaponin F, are the main compounds existing in RBR and VRBR (Bao et al., 2004; Hu et al., 2008; Li et al., 2005; Matsuda et al., 1997; Pan, 2006). The standard saikosaponins are the key to comprehensive quality control of RBR and VBBR, however, the availability of standards is far from the need and the high expense of reference compounds is becoming the current bottleneck for quality control of RBR and VBBR. With the development of high-performance liquid chromatography coupled with a photodiode array detector (HPLC-PDA), the external standard method (ESM) has been successfully applied in the quantitative analysis of TCMs. However, the high cost of standard reference substances, and the limited availability of multiple reference substances have hindered the development of quantitative analysis of TCMs. In order to overcome the difficulties, the quantitative analysis of multi-components by a single-marker (QAMS) analytical method should be a practical option. Based on the calculation of relative calibration factors (RCF), QAMS uses only a single reference standard to simultaneously quantify itself and the other identified analytes. There is also a lack of study on whether QAMS could be proposed to easily and effectively control the quality of RBR and VBBR. In addition, extraction of bioactive compounds is important processing for quantitative analysis and therapeutic efficacy, e.g. heat reflux extraction (Li et al., 2004; Yu et al., 2009), maceration and soxhlet extraction had been applied in the extraction of RBR and VBBR (Wagner et al., 2011), whose disadvantages lie in laborious, time-consuming and high production cost. Recently, many novel techniques for the extraction of bioactive compounds have been developed, such as supercritical fluid extraction, microwave-assisted extraction and ultrasonic-assisted extraction (Wang and Weller et al., 2006). Among these, ultrasonic-assisted extraction (UAE) was one of the most convenient and efficient methods (Chen et al., 2010; Huang et al., 2009). It was very efficient for the extraction of unstable and thermolabile compounds (Vilkhu et al., 2008). Thus, the UAE was applied in the research to further increase the extraction efficiency of bioactive compounds from RBR and VBBR. The UAE conditions were obtained by the response surface methodology (RSM) coupled with the Box-Behnken design (BBD).
The aim of the present work was to establish a reliable and comprehensive QAMS analytical protocol for the simultaneous quantification of six saikosaponins in RBR and VBBR with a single marker. The method was characterized by more chemical information and could better reflect the quality of RBR and VBBR. In the meantime, the QAMS method was adopted to quantify the main active components by comparing them with the ESM in all the RBR and VBBR samples.
| 2. Materials and methods | ▴Top |
2.1. Reagents and materials
BR and VBBR samples were collected from different pharmaceutical enterprises in various regions. All samples were identified by one of the authors, professor Hui Zhao (Tianjin University of Commerce). A total of six standards, including saikosaponin A (1), saikosaponin B1 (2), saikosaponin C (3), saikosaponin D (4), saikosaponin E (5) and saikosaponin F (6), were supplied by Aladdin (Shanghai, China). The purity was higher than 99% for all standards. Water was deionized by a Milli-Q water purification system. Acetonitrile and formic acid (HPLC grade) were purchased from Aladdin (Shanghai, China).
2.2. HPLC-photodiode array system
Quantitative analysis was performed using Shimadzu i-Series HPLC system equipped with a photodiode array detector. Lab-solution software was used for the acquisition and processing of the data. The chromatographic separation was eluted at a flow rate of 1 mL/min with a linear solvent gradient of A-B (A = H2O, B = Acetonitrile) varying as follows: 0–5 min with 10–29% B, 5–75 min with 29% B, 75–80 min with 29–36% B, 80–140 min with 36%, 140–145 min with 36–41% B and 145–165 min with 41% B. The HPLC was set at 210 nm with a Kromasil C18 column (4.6 × 250 mm, 100 Å, 5 μm) under a 30 °C controlled column chamber. The injection volume was 10 μL.
2.3. Preparation of sample
One g sample powder was added to 30 mL of a solution of 5% ammonia in 70% methanol-water. The resulting mixture was immersed in an ultrasonic bath for 30 min at 30 °C to prevent the degradation of saikosaponins A and D (Shimaoka et al., 1975), and centrifuged at 1,000 × g for 10 min. A 10 μL volume of the above supernatant solution was injected into the HPLC system for quantitative analysis.
2.4. Preparation of standard solution
Stock solutions were prepared by dissolving the above mentioned six standard substances (1, 0.60 mg; 2, 0.60 mg; 3, 0.60 mg; 4, 0.60 mg; 5, 0.60 mg and 6, 0.60 mg) in 1 mL of methanol, and in the refrigerator at 4 °C.
2.5. Validation of the HPLC-photodiode array method
2.5.1. Sensitivity of the analysis
Limits of detection (LODs) and limits of quantitation (LOQs) were determined by serial dilution of standard solutions. LODs and LOQs were evaluated on the basis of a signal-to-noise ratio (S/N) of 3 and 10, respectively.
2.5.2. Linear regression equation and calibration curve of the analysis
The standard solution with a series of known concentrations was analyzed in three separate runs and the linear regression analysis was carried out on known concentrations of each analyte against the corresponding peak areas. The regression coefficient (r), slope, and y-intercept of the resulting calibration curves were determined, respectively.
2.5.3. Precision, repeatability and stability of the analysis
The intra-day (n = 6) and inter-day (n = 6) precisions were measured by analyzing the standard solution. The repeatability was calculated using six replicates of the sample solutions containing the six standard compounds. The stability test was determined by six injections of the standard solution for 0, 2, 6, 8, 12 and 24 h at room temperature. The relative standard deviation (RSD) value was taken as a measure of precision, repeatability and stability.
2.5.4. Accuracy of the analysis
Accuracy is the closeness of the determined value to the true value. A measure of accuracy is expressed as a percentage recovered of the true value. The recovery was calculated as follows: recovery (%) = [(detected concentration – initial concentration)/spiked concentration] × 100.
2.5.5. Relative calibration factors in quantitative analysis of multi-components by a single-marker and its robustness
For the sake of exact quantitative analysis, saikosaponin A was used as the internal standard after a series of screenings, considering its easy availability, high abundance, and complete separation from the other components. The RCFs (fsi) of the other analytes are calculated by Equation (1):
The concentration of each analyte in the sample solution was calculated by Equation (2). In practical application, the variation of chromatographic conditions may lead to the fluctuant of RCF. Therefore, we systematically investigate the operational and environmental effects on the RCF and design a series of experiments. The experiments involve changing one variable at a time (OVAT), keeping the others at fixed levels.
2.6. Determination of extraction method
2.6.1. Ultrasonic-assisted extraction of six compounds
Ultrasound-assisted extraction was carried out in an ultrasonic bath with a working frequency of 40 kHz. The solvent for extraction was a solution of 5% concentrated ammonia water in different proportions of methanol-water (from 50 to 100%), at different solvent-to-solid ratio (from 10:1 to 35:1 (v/w)) and in different extraction time (from 20 to 70 min). The extraction temperature was maintained at 25 °C to prevent the degradation of saikosaponin A and D[41]. Then the solution was centrifuged at 1,000 ×g for 10 min and the supernatant was passed through a 0.45 μm syringe-type nylon membrane filter.
2.6.2. Experimental design
In the experiment, methanol-water proportion (%, X1), solvent-to-solid ratio (v/w, X2) and extraction time (min, X3) were taken as the independent variables. +1, 0, −1 represented the three levels of each independent variable. After the single factor tests, RSM with CCD was applied to estimate the effect of independent variables and their interactions on UAE of saikosaponins yield (Y). The predictor variables were coded by the following Equation (3):
2.7. Statistical analysis
All the data were shown as the means ± standard deviations of three parallel measurements and statistical analysis was performed using the software Design Expert 8.0 (Stat-Ease Inc., USA).
| 3. Results and discussion | ▴Top |
3.1. Optimization of the chromatographic conditions
In the present study, the HPLC method for the simultaneous determination of saikosaponins in RBR and VBBR was developed. The detection wavelength was set at 210 nm for six analytes based on the baseline stability, non-peak interference, and maximum absorption (Table S1). Compared with different mobile phases and solvent ratios, the acetonitrile-water system has the following advantage: best separation performance, minimum baseline noise, and lowest column pressure. It was therefore selected as the optimum mobile phase system for determination. To further optimize chromatographic conditions, different temperatures and flow rates were compared as well. Results showed that higher temperature might influence the peak separation, and that lower temperature and flow rate would prolong the retention times. Accordingly, the column temperature was maintained at 30 °C and the flow rate was set at 1.0 mL/min. Under the above mentioned conditions, the representative chromatograms of the sample solutions and standard mixture are shown in Figure 1.
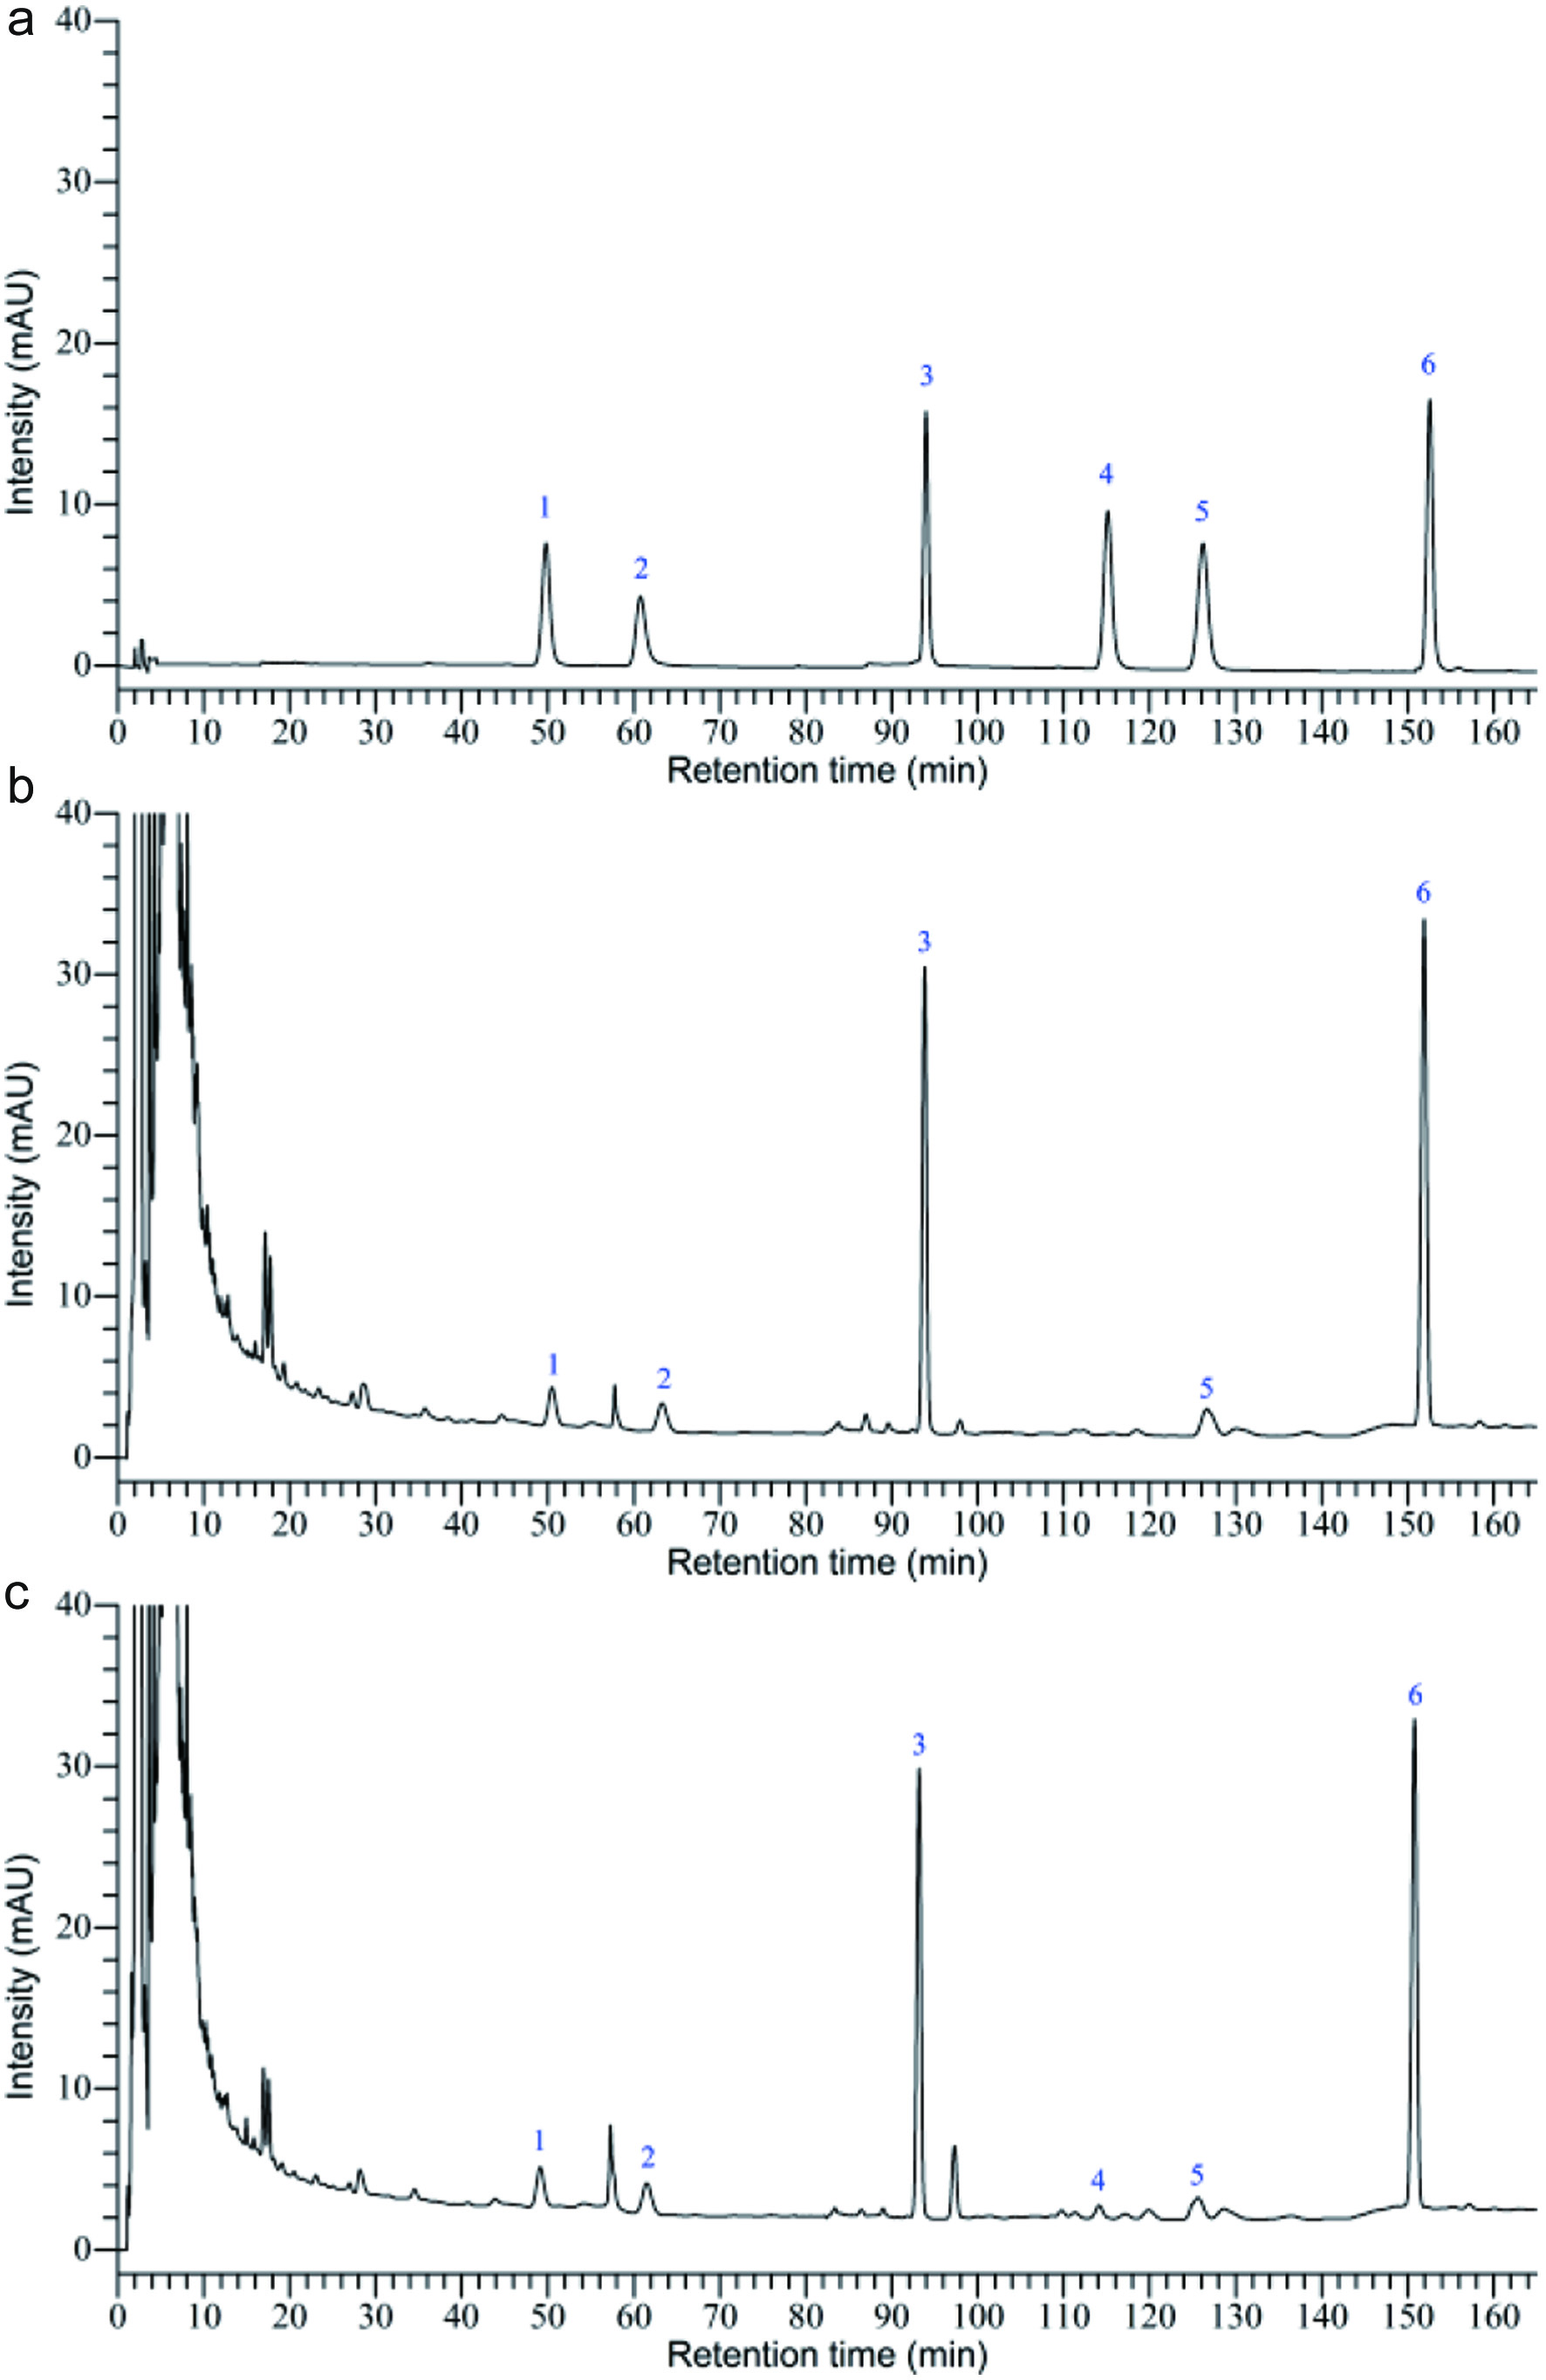 Click for large image | Figure 1. HPLC-PDA chromatograms of (a) standard substances, (b) raw Bupleuri Radix (RBR) sample solution, and (c) vinegar-baked Bupleuri Radix (VBBR) sample solution. |
3.2. Evaluation of the robustness of relative calibration factors
Saikosaponin A was used as the internal standard due to relatively low prices and easy acquisition. The RCF was calculated by multipoint correction method using the calculation Equation (1). The results of six constituents are displayed in Table 1. The concentrations of the other five constituents in sample solutions were calculated by Equation (2). The robustness of RCFs was examined by evaluating the influence of small variations in different conditions, such as the ratio of acetonitrile in the gradient program (±1%, v/v), injection volumes (±2 μL), chromatographic column temperatures (±3 °C), flow rate (±0.05 mL/min) and chromatographic column types (Agilent, Kromasil and Phenomenex). These variations did not have any significant effect on the measured responses or the chromatographic resolution (Table S2). These results ensured that the QAMS analytical method could be well applied to routine analysis.
 Click to view | Table 1. RCFs of each analyte in Bupleuri Radix |
3.3. Validation of the quantitative analysis of multi-components by a single-marker
Method validation results were shown in Table S3–6 (more detailed information can be seen in Table S7–10). The calibration curves were plotted with a series of concentrations of standard solutions. High coefficient of determination values (R2 ≥ 0.9998) showed good linearity. LOD and LOQ of six substances were within the range of 0.287–0.847 µg/mL and 0.957–2.825 µg/mL, which showed a high sensitivity under the established chromatographic condition. Intra- and inter-day variations were chosen to determine the precision of standard solutions in the developed method. The RSD values of intra- and inter-day precision were in the range of 0.402–0.989% and 0.339–0.781%, respectively. To confirm the repeatability of the method, six independently prepared solutions from the same sample were analyzed. The RSD values of the contents of six analytes ranged from 0.443% to 1.503%, indicating high repeatability. The sample solution was injected into HPLC at 0, 2, 4, 6, 8, 10, 12, and 24 h after being prepared and the peak area of each component was recorded and RSD % was calculated. The RSD results of area peaks of six analytes were 0.375–0.782%, respectively, suggesting that the test solution was stable within 24 h. The accuracy of the QAMS method was determined by conventional recovery tests. The results showed that the average recovery rate and RSD values of the recovery rate of six analytes were 99.951–100.076%, respectively. The results illustrated that the proposed method was of good accuracy. All of the above results indicated that the developed HPLC-based QAMS analytical method was accurate, sensitive, and reproducible enough for the quantitative analysis of the six compounds in VBBR.
3.4. The method comparison between external standard method and quantitative analysis of multi-components by a single-marker
The HPLC method was applied to the simultaneous determination of six saikosaponins in BR. The ESM was also performed to compare the result with the QAMS method. The content of each component was calculated by the method of ESM and QAMS, respectively. The results are exhibited in Table 2. No significant differences were found in the quantitative results of the three contents, and the RSDs were within 3%. Therefore, the method established above was a technique both accurate and reliable in the simultaneous determination of chemical compounds in RBR and VBRB.
Click to view | Table 2. Results comparing ESM and QAMS method (Mean ± SD, n = 3) |
3.5. Determination of sample preparation method
3.5.1. Effects of operating parameters on the extraction yield
In the present work, the extraction method was optimized to effectively extract these bioactive compounds. The influence of different extraction solvents, solvent-to-solid ratio, and extraction time on the extraction yield of six saikosaponins have been investigated. The optimum extraction conditions found were: proportion of methanol-water 70%, solvent-to-solid ratio 30:1 (v/w) and extraction time 30 min (see Figure 2 and Table S11-13). Therefore, the optimal sample extraction conditions were used for the subsequent analysis.
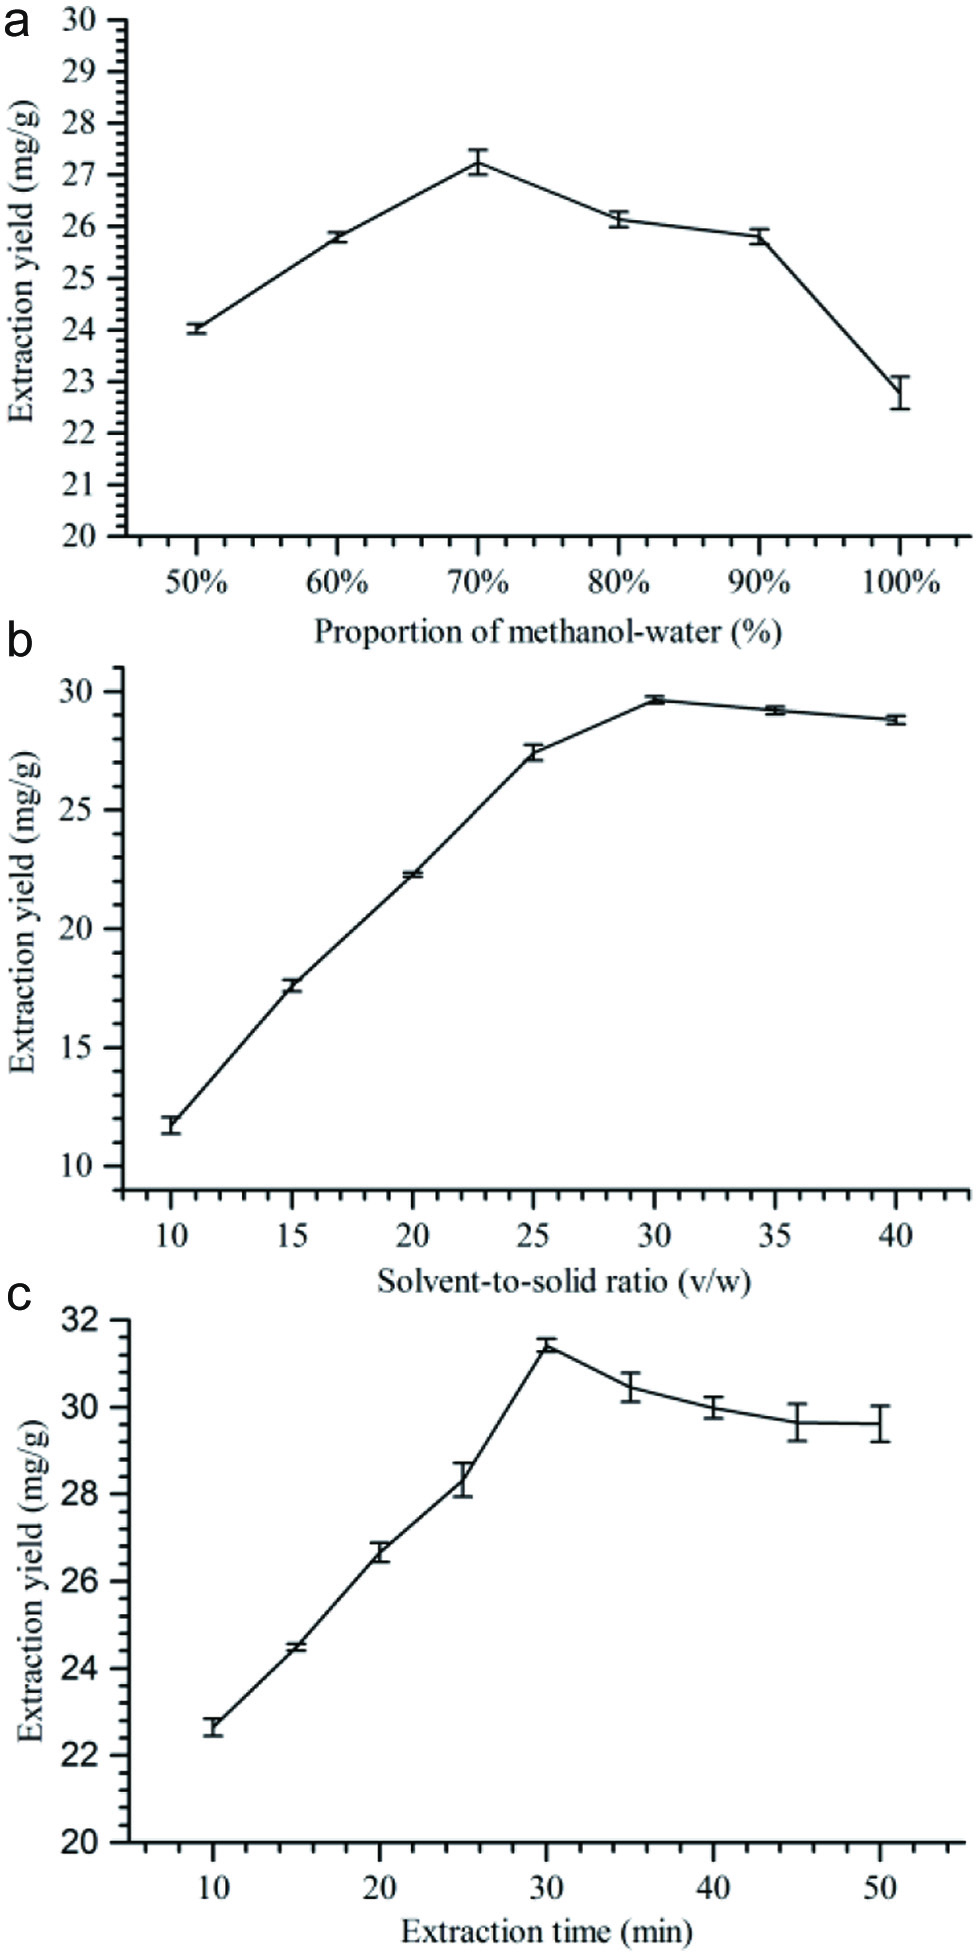 Click for large image | Figure 2. The effect of methanol-water proportion (a), solvent-to-solid ratio (b), and extraction time (c) on the yield of six compounds (n = 3). |
3.5.2. Statistical analysis and the model fitting
Seventeen experiments were designed and carried out by BBD of RSM, which was applied to optimize ultrasonic extraction conditions. The results were listed in Table 3 and S14. By applying multiple regression analysis to the experimental data, the extraction yield of six saikosaponins (mg/g) could be explained by the following polynomial Equation (5):
Click to view | Table 3. Box–Behnken experimental design and results |
Click to view | Table 4. ANOVA of response surface quadratic model analysis for the extraction yield |
3.5.3. Analysis of response surface
The three-dimensional response surface and two-dimensional contour plots, as an essential part of the regression equation, could vividly expound the interactions between two variables and determine their optimal levels (Figure 3). Figure 3a and b show the effect of the proportion of methanol-water (X1) and solvent-to-solid ratio (X2) on the yield of six saikosaponins. The highest extraction yield of six saikosaponins was attained when using 74% as the proportion of methanol-water and 32:1 (v/w) as the solvent-to-solid ratio. As shown in Figure 3c and d, the extraction yield of six saikosaponins constantly improved with the increase of both proportion of methanol-water (X1) and extraction time (X3), and reached the maximum when the proportion of methanol-water (X1) and extraction time (X3) became 74% and 30 min, respectively. From Figure 3e and f, the extraction yield of six saikosaponins is increased linearly with increasing extraction time (X3) from 25 to 30 min. However, extraction time (X3) beyond 30 min resulted in lower extraction yield. The extraction yield of six compounds with increasing solvent-to-solid ratio (X2) up to 32 (v/w), and thereafter descended.
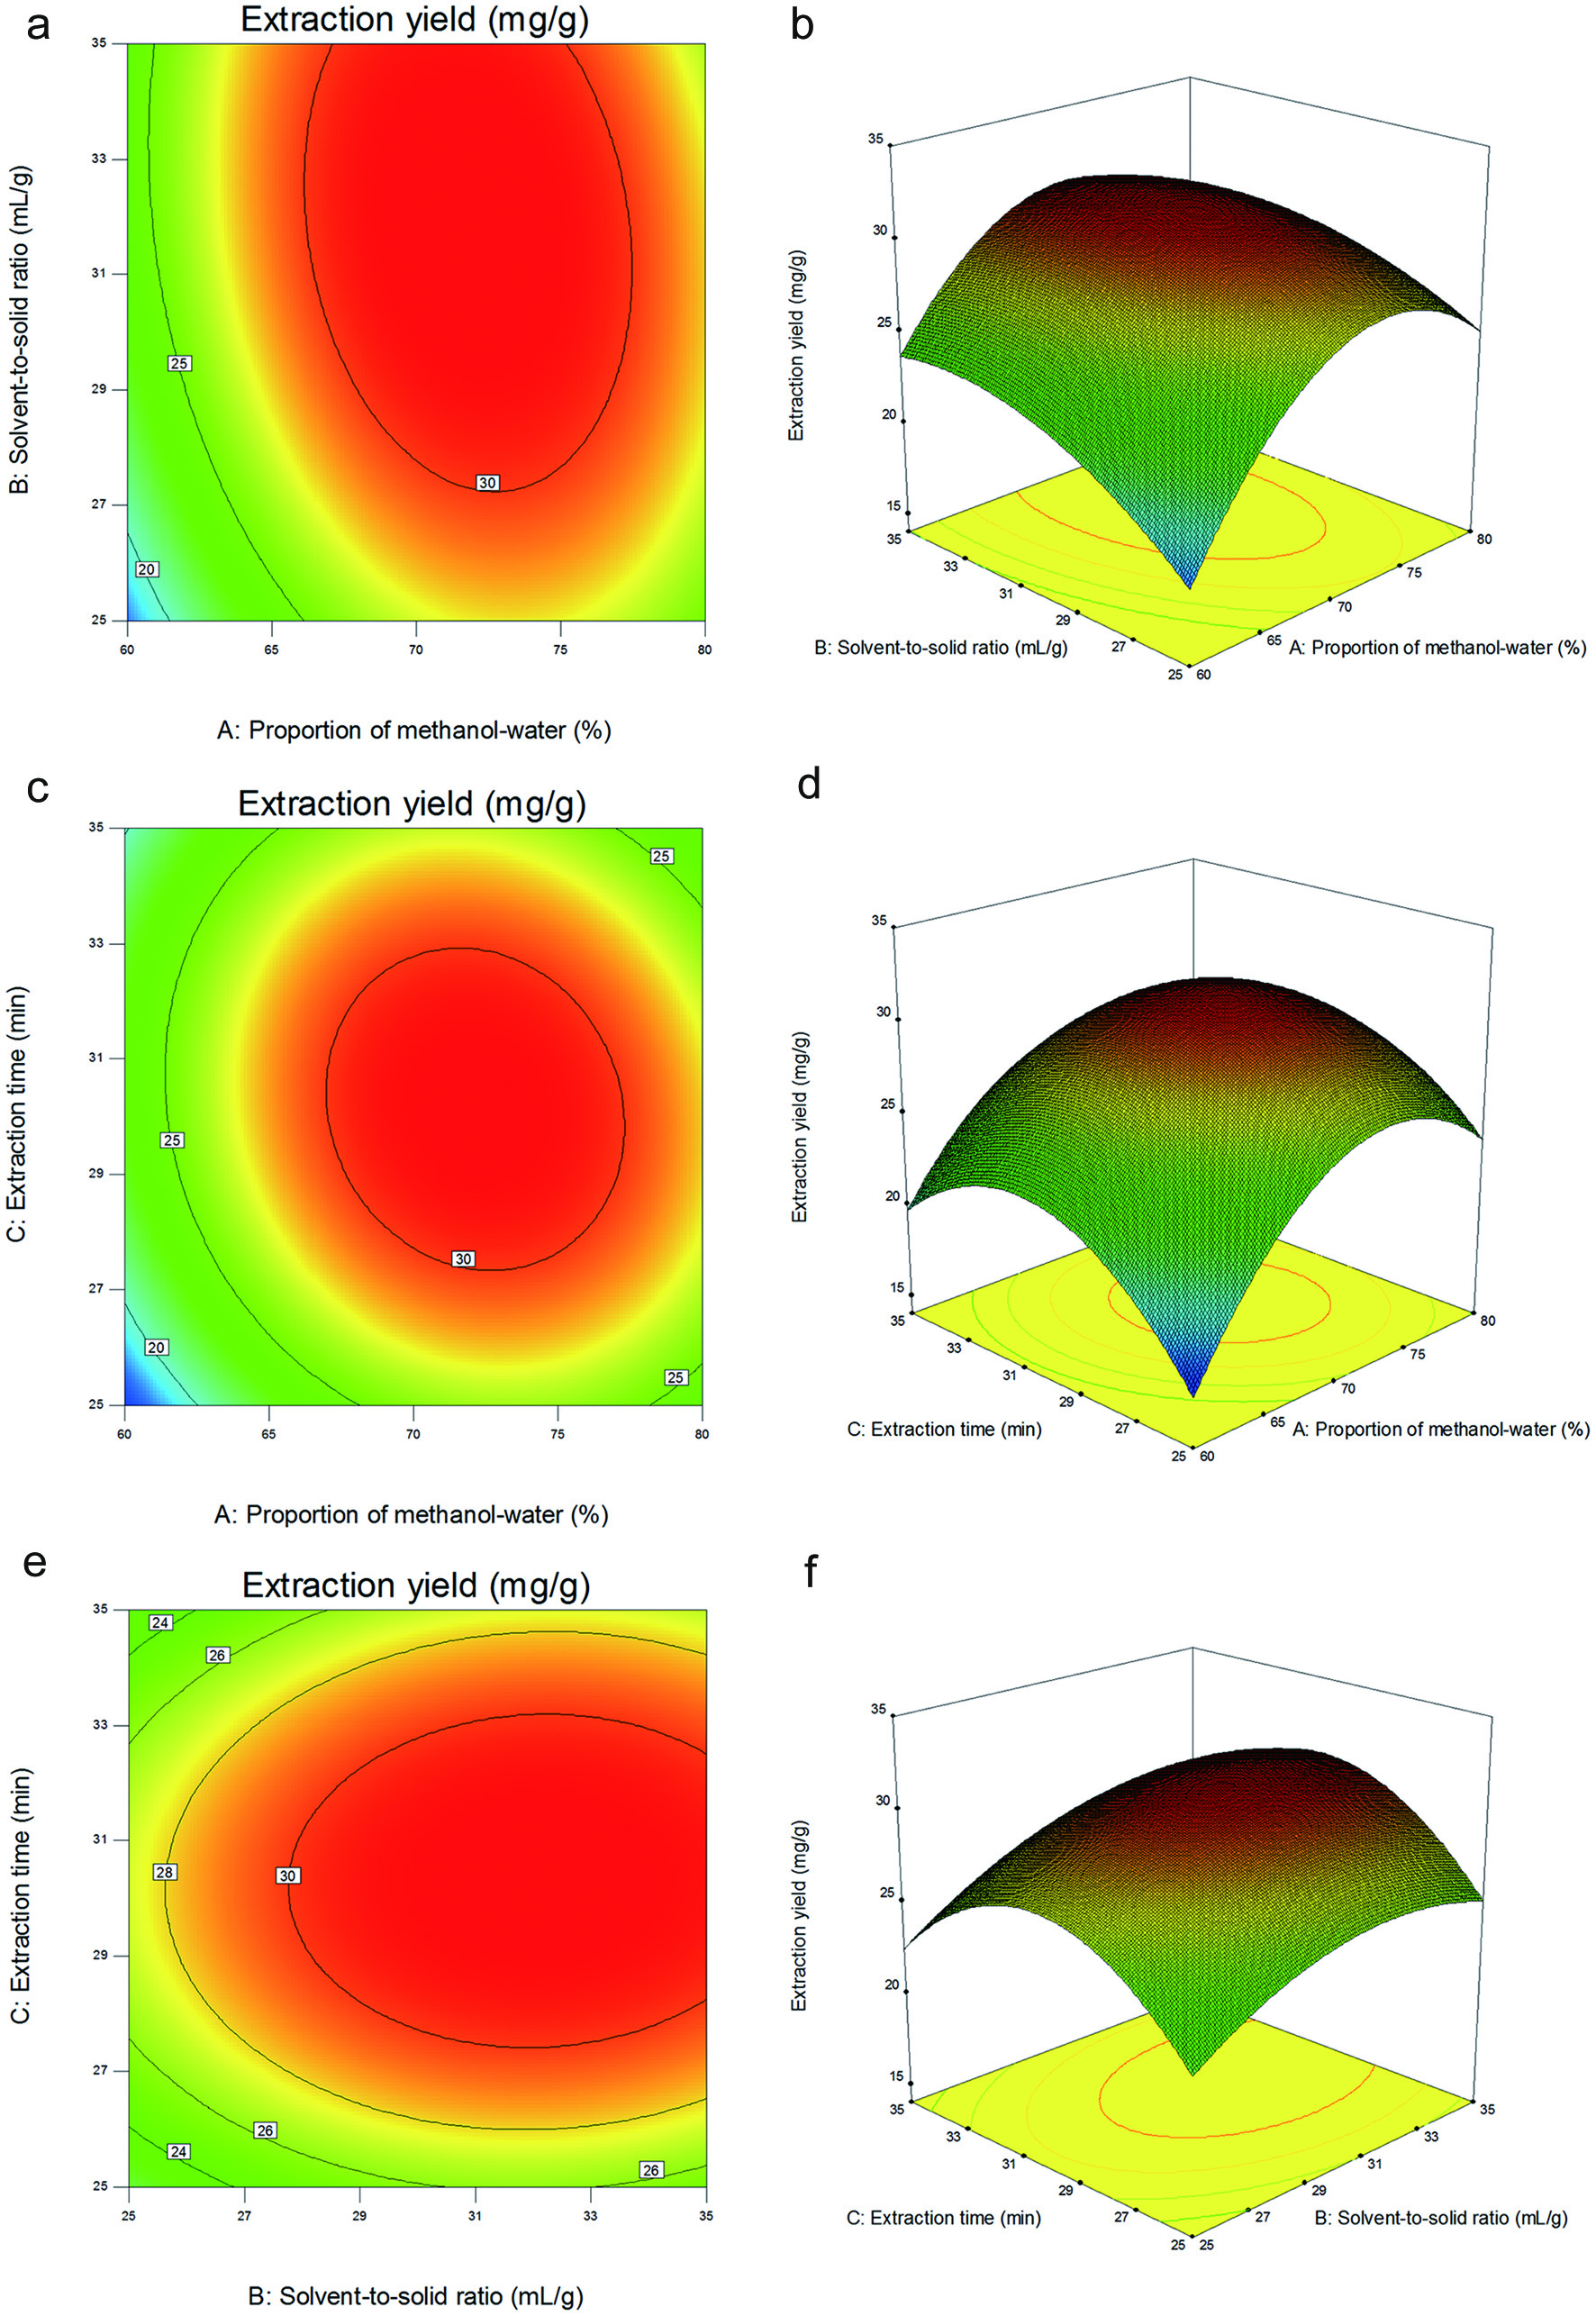 Click for large image | Figure 3. Response surface (3D) and contour plots (2D) show the effect of different extraction parameters (X1: proportion of methanol-water, %; X2: solvent-to-solid ratio, v/w; X3: extraction time, min) on the response yield. |
3.5.4. Validation of the models
In the present investigation, the software predicted that the optimum conditions given by the model were as follows: methanol-water proportion of 71.757%, solvent-to-solid ratio of 31.844:1 (v/w) and extraction time of 30.198 min. Under these optimal extraction conditions, the extraction yield of six compounds was found to be 31.790 mg/g (Table S15). However, considering the operability in actual production, the optimum conditions can be modified as follows: proportion of ethanol-water 70.8%, solvent-to-solid ratio 31.8:1(v/w) and extraction time 30.0 min. Table S16 shows three parallel experiments which were carried out under optimal conditions, in which the average extraction yield of six compounds was 32.166 ± 0.303 mg/g. The results indicate that the experimental values were in good agreement with the predicted values and that the regression model was accurate and adequate for the extraction process.
| 4. Conclusion | ▴Top |
In this study, an efficient process of UAE was developed for the extraction of bioactive compounds from BR with enhanced yield. A novel and simple HPLC-based QAMS analytical method for quantitative analysis was established and validated. Compared to conventional ESM, the QAMS analytical method has more advantages in saving reference standards. The analytical method was successfully used for the quantitative analysis of six bioactive compounds in RBR and VBBR. In summary, the established analytical method was efficient and accurate in the quantitative analysis and achievement of bioactive compounds in other medicinal materials and natural products. The USE conditions obtained by the RSM coupled with the BBD procedure were used to extract the six bioactive compounds. The optimal extraction condition was methanol-water proportion of 70.8%, ratio of solvent-sample of 31.8 mL/g and extraction time of 30.0 min. We found that there were no significant differences in extraction yield between the experimental results and the predicted results by the models. This study can be useful for the development of industrial ultrasonic-assisted extraction of bioactive compounds from RBR and VBBR, including further studies concerning the optimal number of extraction steps to enhance the efficacy of a large-scale extraction system.
| Supplementary material | ▴Top |
Table S1. Chemical structures and UV spectra of six compounds.
Table S2. Influence of gradient elution programs, flow rates, injection volumes, chromatographic column temperatures, and chromatographic column types on RCFs.
Table S3. Linearity and sensitivity of the HPLC-PDA analysis.
Table S4. Summary of precision, repeatability, and stability for six components in Bupleuri Radix.
Table S5. Accuracy results of HPLC-based QAMS analytical method.
Table S6. Intra-day precision results of HPLC-based QAMS analytical method (n = 6).
Table S7. Inter-day precision results of HPLC-based QAMS analytical method (n = 6).
Table S8. Repeatability results of HPLC-based QAMS analytical method (n = 6).
Table S9. Stability results of HPLC-based QAMS analytical method.
Table S10. Accuracy results of HPLC-based QAMS analytical method.
Table S11. Comparative study of different methanol-water proportions for the extraction yields of six compounds from Bupleuri Radix (Mean ± SD, n = 3).
Table S12. Comparative study of different solvent-to-solid ratios for the extraction yields of six compounds from Bupleuri Radix (Mean ± SD, n = 3).
Table S13. Comparative study of different extraction times for the extraction yields of six compounds from Bupleuri Radix (Mean ± SD, n=3).
Table S14. Independent variables and their levels used in the response surface design.
Table S15. Study of optimum conditions for the extraction yields of six compounds from Bupleuri Radix (Mean ± SD, n=3).
Table S16. Optimum conditions, and the predicted and experimental value of response at the optimum conditions (Mean ± SD, n=3).
Acknowledgments
This study was supported by College Student Innovation and Entrepreneurship Training (202110069122 and 202210069243), Tianjin Key R&D Plan-Key Projects Supported by Science and Technology (19YFZCSN00010), and Tianjin Agricultural Science and Technology Achievements Transformation and Promotion Project (202101120).
These authors contributed equally to this article
Conflict of interest
The authors declare that they have no known competing financial interests or personal relationships that could have appeared to influence the work reported in this paper.
| References | ▴Top |