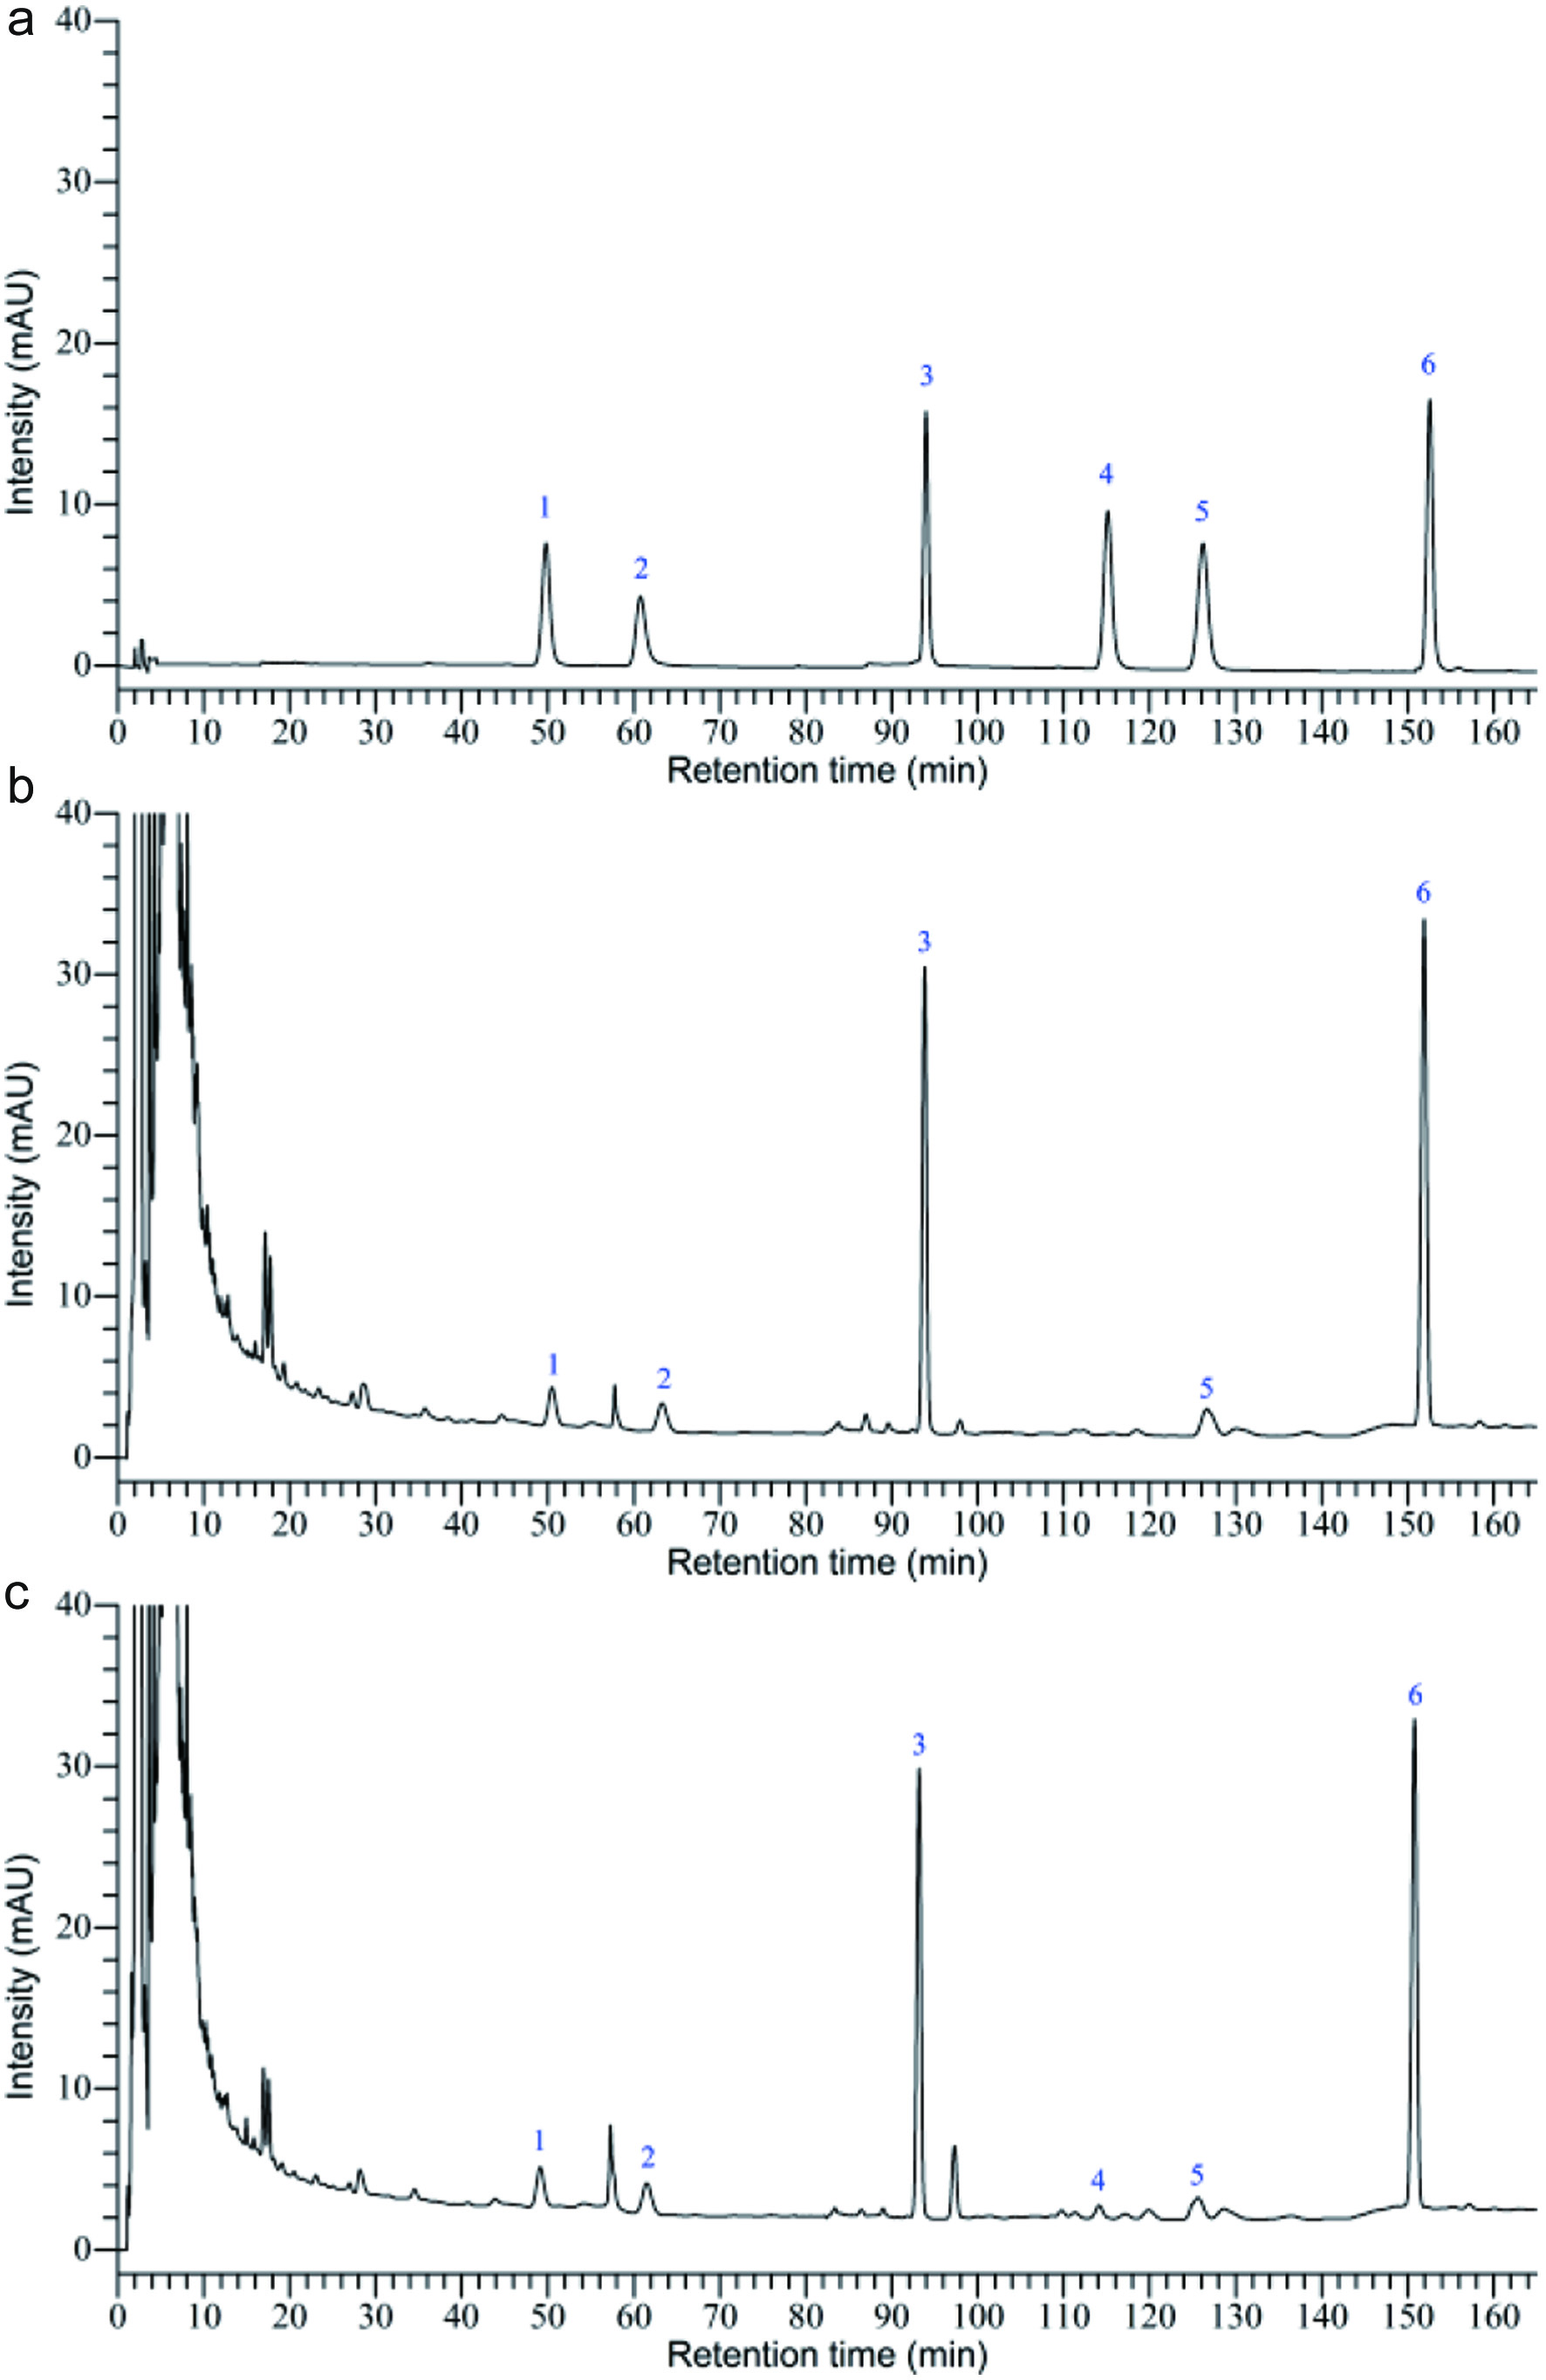
Figure 1. HPLC-PDA chromatograms of (a) standard substances, (b) raw Bupleuri Radix (RBR) sample solution, and (c) vinegar-baked Bupleuri Radix (VBBR) sample solution.
| Journal of Food Bioactives, ISSN 2637-8752 print, 2637-8779 online |
| Journal website www.isnff-jfb.com |
Original Research
Volume 19, September 2022, pages 154-163
Optimization of ultrasonic-assisted extraction of bioactive compounds from Bupleuri Radix by response surface methodology and HPLC analysis
Figures


Tables
| RCFs | Concentration numbers | Mean ± SD, n = 6 | RSDa (%) | |||||
|---|---|---|---|---|---|---|---|---|
| 1 | 2 | 3 | 4 | 5 | 6 | |||
| aRSD (%) = 100 × SD/mean. | ||||||||
| 1 | 1.104 | 1.103 | 1.102 | 1.103 | 1.101 | 1.103 | 1.103 ± 0.001 | 0.081 |
| 2 | 1.300 | 1.300 | 1.300 | 1.300 | 1.300 | 1.300 | 1.300 ± 0.001 | 0.013 |
| 3 | 1.000 | 1.000 | 1.000 | 1.000 | 1.000 | 1.000 | 1.000 ± 0.000 | 0.000 |
| 4 | 1.085 | 1.085 | 1.085 | 1.085 | 1.085 | 1.085 | 1.085 ± 0.001 | 0.016 |
| 5 | 0.975 | 0.975 | 0.975 | 0.975 | 0.974 | 0.967 | 0.973 ± 0.003 | 0.338 |
| 6 | 0.863 | 0.863 | 0.862 | 0.862 | 0.862 | 0.855 | 0.861 ± 0.003 | 0.343 |
| Analyte | ESM | QAMS | RSDa (%) |
|---|---|---|---|
| Content (mg/g) | Content (mg/g) | ||
| aRSD (%) = 100 × SD/mean. | |||
| 1 | 2.036 ± 0.027 | 2.037 ± 0.027 | 1.171 |
| 2 | 2.224 ± 0.017 | 2.222 ± 0.017 | 0.674 |
| 3 | 11.936 ± 0.078 | 11.936 ± 0.078 | 0.583 |
| 4 | 0.660 ± 0.002 | 0.659 ± 0.002 | 0.343 |
| 5 | 1.339 ± 0.010 | 1.338 ± 0.010 | 0.695 |
| 6 | 13.423 ± 0.003 | 13.400 ± 0.003 | 0.096 |
| Run number | Coded levels | Extraction yield (mg/g) | |||
|---|---|---|---|---|---|
| X1 | X2 | X3 | |||
| Proportion of ethanol-water (%) | Solvent-to-solid ratio (v/w) | Extraction time (min) | Experimental | Predicted | |
| 1 | −1 | 1 | 0 | 23.908 | 23.777 |
| 2 | −1 | −1 | 0 | 19.693 | 19.825 |
| 3 | 0 | 0 | 1 | 18.243 | 17.951 |
| 4 | 1 | 1 | 0 | 15.947 | 16.587 |
| 5 | 0 | 0 | −1 | 23.144 | 22.505 |
| 6 | 0 | 0 | 0 | 31.203 | 31.232 |
| 7 | 1 | −1 | 0 | 31.252 | 31.232 |
| 8 | 0 | 0 | 0 | 31.250 | 31.232 |
| 9 | 0 | 0 | −1 | 22.481 | 22.134 |
| 10 | 0 | 0 | 1 | 31.223 | 31.232 |
| 11 | 1 | 0 | 0 | 25.404 | 25.244 |
| 12 | 1 | 0 | 0 | 31.233 | 31.232 |
| 13 | 0 | 1 | −1 | 22.472 | 22.632 |
| 14 | −1 | 0 | 0 | 24.717 | 25.195 |
| 15 | −1 | 0 | 0 | 26.365 | 26.712 |
| 16 | 0 | −1 | −1 | 26.189 | 26.481 |
| 17 | 0 | 1 | 1 | 24.334 | 23.855 |
| Source | SSa | DFb | MSc | F-value | P-Value |
|---|---|---|---|---|---|
| RMSE = 0.243; R2 = 0.995; Radj2 = 0.989; C.V.% = 1.995. aSums of squares. bDegree freedom. cMean square. | |||||
| Model | 368.567 | 9 | 40.952 | 161.567 | <0.0001 |
| X1 | 48.708 | 1 | 48.708 | 192.166 | <0.0001 |
| X2 | 25.847 | 1 | 25.847 | 101.972 | <0.0001 |
| X3 | 1.933 | 1 | 1.933 | 7.628 | 0.0280 |
| X1X2 | 5.333 | 1 | 5.333 | 21.039 | 0.0025 |
| X1X3 | 5.086 | 1 | 5.086 | 20.064 | 0.0029 |
| X2X3 | 0.235 | 1 | 0.235 | 0.927 | 0.3677 |
| X12 | 136.048 | 1 | 136.048 | 536.748 | <0.0001 |
| X22 | 19.958 | 1 | 19.958 | 78.741 | <0.0001 |
| X32 | 100.056 | 1 | 100.056 | 394.748 | <0.0001 |