| Journal of Food Bioactives, ISSN 2637-8752 print, 2637-8779 online |
| Journal website www.isnff-jfb.com |
Original Research
Volume 20, December 2022, pages 61-71
Formation of furanoic compounds in model systems with saccharides, amino acids, and fatty acids, analyzed with headspace-solid phase micro-extraction-gas chromatography–tandem mass spectrometry
Alena Schöpf, Claudia Oellig*, Michael Granvogl#
Department of Food Chemistry and Analytical Chemistry (170a), Institute of Food Chemistry, University of Hohenheim, Stuttgart, Germany.
*Corresponding author: Claudia Oellig, Department of Food Chemistry and Analytical Chemistry (170a), Institute of Food Chemistry, University of Hohenheim, Stuttgart, Germany. Tel: +49-711-459-24094; E-mail: claudia.oellig@uni-hohenheim.de
#Deceased.
DOI: 10.31665/JFB.2022.18329
Received: November 27, 2022
Revised received & accepted: December 26, 2022
| Abstract | ▴Top |
Furan and furan derivatives are processing contaminants found in thermally processed food, such as coffee or canned products. For the determination of furan and ten derivatives, a sensitive headspace-solid phase micro-extraction-gas chromatography–tandem mass spectrometry method with stable isotope dilution analysis was developed. Different precursors such as saccharides, saccharide/amino acid mixtures, polyunsaturated fatty acids (PUFA), and oils were heat processed to investigate the formation of furanoic compounds via Maillard reaction and lipid oxidation. Therefore, a low moister (silica gel with 10% water content) and an aqueous (phosphate buffer, pH 4.5, 7, and 9) model system were chosen to study the effect of water content and pH value on the formation process. The formation of different furan derivatives could be attributed to distinct precursors; furfuryl alcohol was highly formed from 1,4-linked disaccharides, whereas PUFA formed the highest amounts of 2-ethylfuran and 2-pentylfuran.
Keywords: Furan and furan derivatives; Processing contaminants; Polyunsaturated fatty acids; Saccharides; Model systems; HS-SPME-GC–MS/MS
| 1. Introduction | ▴Top |
Heating of food results in many benefits, e.g., improved digestibility, sensory properties, and, due to less spoilage, a higher level of food safety. Consuming heated food, the human body is exposed to a broad range of processing contaminants formed from naturally occurring food ingredients. Furan is an example of a “food-borne toxicant”, which in 1995 was classified as a possible human carcinogen (Group 2B) by the International Agency for Research on Cancer (IARC) (IARC, 1995). Besides, other furan derivatives, including alkylfurans, acetylfurans, furfural, and furfuryl alcohol, occur in heat-treated food and contribute to the sensory property of foods (Kettlitz et al., 2019). Aside from their sensory property, furan derivatives also seem to exhibit adverse effects (European Food Safety Authority, 2017, 2021; IARC, 2019). The primary sources of furanoic compounds are coffee products, at least with concerning adults and the elderly. However, they can be found in many other heat-treated foods like canned or jarred foods, cereal products, meat products, soups, and sauces (Becalski et al., 2010; European Food Safety Authority, 2009, 2017). As infants and young children form a vulnerable group, baby food and infant formulae are of high interest (Condurso et al., 2018; Pugajeva et al., 2016).
The formation pathways of furanoic compounds are diverse and not fully known. Several model studies have been conducted under different conditions to identify precursors and proposed chemical pathways for forming furan and furan derivatives. During thermal treatment of carbohydrates, either alone or in the presence of amino acids, degradation and rearrangement reactions can occur (within non-enzymatic browning/Maillard reaction) (Adams et al., 2011b; Limacher et al., 2008; Perez Locas and Yaylayan, 2004). Polyunsaturated fatty acids (through lipid oxidation), ascorbic acid and its derivatives, and carotenoids were also reported as suitable precursors, whereas no data have been published on carotenoids so far (Adams et al., 2011b; Becalski et al., 2005; Perez Locas and Yaylayan, 2004). The formation rate of furanoic compounds and the preferred derivatives produced in model systems and food matrices primarily depend on the present precursors. For example, the formation of 2-ethylfuran (2-EF) and 2-pentylfuran (2-PF) can be attributed to the lipid oxidation of polyunsaturated fatty acids (PUFA) (Adams et al., 2011a), whereas the thermal treatment of saccharides prominently contributes to the formation of furfuryl alcohol (2-FOL) (Wnorowski and Yaylayan, 2000; Yaylayan and Keyhani, 2000). Further, reaction conditions, such as pH value, temperature, heating time, and water content, highly influence the furan formation (Ames et al., 2001; Delatour et al., 2020; Huang et al., 2022a; Limacher et al., 2008; Shen et al., 2015).
Due to their chemical properties (boiling point of furan 31.5 °C), the analysis of furanoic compounds is usually performed by headspace gas chromatography (HS-GC) coupled to mass spectrometry (MS), and quantification is based on stable isotope dilution analysis (SIDA) (Altaki et al., 2007; Batool et al., 2020; Becalski et al., 2010; Condurso et al., 2018; Frank et al., 2020; Goldmann et al., 2005; Limacher et al., 2008). To gain higher sensitivity, a tandem quadrupole mass spectrometry (MS/MS) method was recently published, which shows the timeliness and necessity of an accurate and sensitive analysis of furanoic compounds (Huang et al., 2022a; Huang et al., 2022b). Huang et al. (2022a) applied the GC–MS/MS method to determine the formation of furan and its derivatives in model systems obtained by a mixture of glucose and alanine with ascorbic acid and linoleic acid under different conditions. The findings of this study may provide preliminary information on the formation of furanoic compounds in foods containing the tested precursors, requiring further systematic investigations on the furan formation obtained by different precursors (Huang et al., 2022a). Headspace solid phase micro-extraction (HS-SPME) is an enhanced extraction method for determining furanoic compounds and provides high sensitivity by enriching the volatiles onto the fiber and reducing interferences from matrix compounds to a minimum (Alsafra et al., 2021; Altaki et al., 2007; Batool et al., 2020; Huang et al., 2022a; Huang et al., 2022b).
Thus, this study aimed to investigate the formation of furan and furan derivatives and, therefore, to develop and validate an HS-SPME-GC–MS/MS method to determine furan, alkylated furans (2-methylfuran (2-MF), 3-methylfuran (3-MF), 2-EF, 2,5-dimethylfuran (2,5-DMF), and 2-PF), oxygenated furans (furfural (2-FA), 3-furaldehyde (3-FA), 2-FOL, and 3-furanmethanol (3-FOL)), and the acetylated furan 2-acetylfuran (2-AF) using their respective stable isotopically substituted analogs for SIDA. To achieve a systematic study on the formation of furanoic compounds, several precursors involved in furan formation, such as saccharides, amino acids, and PUFA, were heat-processed under different conditions using two model systems, a low moister and an aqueous model system.
| 2. Materials and methods | ▴Top |
2.1. Chemicals
2,5-dimethylfuran (2,5-DMF, ≥99%), 3-furanmethanol (3-FOL, ≥99%), 2-methylfuran (2-MF, ≥99%), furan (≥99%), and furfural (2-FA, ≥99%) were purchased from Sigma-Aldrich (Steinheim, Germany); 3-furaldehyde (3-FA, ≥98%), 3-methylfuran (3-MF, ≥99%), and furfuryl alcohol (2-FOL, ≥98%) from Acros Organics (Geel, Belgium); 2-pentylfuran (2-PF, ≥98%) from J&K Scientific (Beijing, China); and 2-acetylfuran (2-AF, ≥99%) and 2-ethylfuran (2-EF, ≥98%) from Alfa Aesar (Kandel, Germany).
Furan-d4 (chemical purity ≥99%, isotopic purity ≥99%) was from abcr (Karlsruhe, Germany); 2,5-dimethylfuran-d3 (2,5-DMF-d3, chemical purity ≥95%, isotopic purity ≥98.6%), 2-ethylfuran-d5 (2-EF-d5, chemical purity ≥90%, isotopic purity ≥95.9%), 3-methylfuran-d3 (3-MF-d3, chemical purity ≥95%, isotopic purity ≥95%), and furfuryl alcohol-d5 (2-FOL-d5, chemical purity ≥97%, isotopic purity ≥99%) from Toronto Research Chemicals (North York, Canada); furfural-d3 (2-FA-d3, chemical purity ≥98.5%, isotopic purity ≥99.4%) and 2-methylfuran-d6 (2-MF-d6, chemical purity ≥98.7%, isotopic purity ≥98.4%) from CDN isotopes (Point-Clair, Canada); and [13C2]-2-pentylfuran ([13C2]-2-PF, chemical purity ≥98.4%, isotopic purity ≥99.7%) from WITEGA Laboratorien (Berlin, Germany).
L-alanine (≥99%), eicosapentaenoic acid (EPA, ≥98.5%), L-leucine (≥99%), D-lactose monohydrate (≥99%), γ-linolenic acid (GLA, ≥99%), D-maltose monohydrate (≥99%), D-melibiose monohydrate (≥99%), L-proline (≥99%), D-ribose (≥99%), and L-serine (≥99%) were from Sigma-Aldrich; L-cysteine (≥99%), disodium hydrogen phosphate (≥99%), D-fructose (≥99%), D-galactose (≥99%), D-glucose (≥96%), α-linolenic acid methyl ester (ALA-ME, ≥99%), methanol (LC-MS grade), potassium dihydrogen phosphate (≥99%), and silica gel 60 from VWR (Darmstadt, Germany); D-gentiobiose (≥98%) and D-maltulose monohydrate (≥98%) from Biosynth Carbosynth (Bratislava, Slovakia); D-cellobiose (≥98%) and D-mannose (≥99%) from Alfa Aesar; D-isomaltulose (≥99%) from Carl Roth (Karlsruhe, Germany); D-arabinose (≥99%) and D-lactulose (≥99%) from Acros Organics; sodium chloride (NaCl, ≥99.5%) from Häberle Labortechnik (Lonsee-Ettlenschieß, Germany); D-isomaltose (≥97%) and linoleic acid (LA, ≥97%) from TCI (Zwijndrecht, Belgium); and α-linolenic acid (ALA, ≥98%) were purchased from Cayman Chemical Company (Tallinn, Estonia). Docosahexaenoic acid ethyl ester (DHA-EE) was isolated by countercurrent chromatography from DHA-EE oil (KD Pharma, Bexbach, Germany) according to Müller et al. (2018) (≥99%).
Oils were purchased from local supermarkets (coconut oil, corn oil, linseed oil, rapeseed oil, safflower oil, soybean oil, sunflower oil, and olive oil) and online suppliers (fish oil and algae oil).
2.2. Standard solutions
Standard stock solutions of about 200 µg/mL for each analyte, except for 2-FOL and 3-FOL, were separately prepared in methanol and stored at -14 °C. For 2-FOL and 3-FOL, standard stock solutions of about 1 mg/mL were prepared. A mixed working standard solution containing about 1–20 µg/mL for each analyte (for 2-FOL and 3-FOL, about 200 µg/mL) was prepared daily in ultrapure water (Merck Millipore, Darmstadt, Germany) and kept at -14 °C. The same procedure was applied to their corresponding stable isotopically substituted internal standard (IS). Calibration standards for model studies were prepared at different levels for the furanoic compounds depending on their generated amounts in the model systems. Therefore, volumes of 5, 20, 100, 500, and 1,000 µL of the mixed working standard solution were spiked into a 20 mL headspace vial containing NaCl solution (25%, w/v) to end up with a total volume of 10 mL. The resulting amounts were about 0.01–3 µg for furan, 2-MF, 3-MF, 2-EF, 2,5-DMF, 2-FA, 3-FA, 2-AF, and 2-PF, and about 1.3–80 µg for 2-FOL and 3-FOL. Calibration standards for method validation were prepared equally. Due to furan's low boiling point, cooling the reference compound and the isotopically substituted IS on ice and rapid handling must be ensured.
2.3. Model studies
Heat-processing experiments were performed in two different model systems.
Model A was an aqueous model system to simulate food with high water content. Therefore, each precursor was weighed into a 20 mL headspace vial and dissolved in 10 mL phosphate buffer of different pH values (pH 4.5, 7, and 9). The buffer solutions were prepared from potassium dihydrogen phosphate (KH2PO4; 9.078 g/L, pH 4.5) and disodium hydrogen phosphate (Na2HPO4; 9.464 g/L, pH 9). For pH 7, KH2PO4 and Na2HPO4 buffer solutions were mixed at a ratio of 41:59 (v/v). Fifty µmol of each substance was singly weighed into headspace vials for model systems with saccharides. Mixtures of saccharides and amino acids were considered at a molar ratio of 1:1 (50 µmol each). For model systems with lipid components, 5–10 mg of PUFA (free fatty acids and fatty acid esters) and oils were taken.
Model B was a low moisture model system to simulate food with low water content. An aliquot of each precursor was weighed into a 20 mL headspace vial and homogenized with 3 g of silica gel containing 10% water. According to model A, amounts of single saccharides and PUFA (fatty acid esters) were weighed.
The headspace vials were sealed and used as reaction vessels. The samples were heated for 20 min at 160 °C in a heating block (in-house manufactured) with a magnetic stirrer (Hei-Tec with external temperature sensor Pt1000, Heidolph Instruments, Germany). Details are illustrated in Figure S1. After the heat treatment, the samples were cooled in ice water for 2 min to stop the reaction, then stored at 4 °C before analysis.
2.4. Sample preparation
Fifty µL of the IS mix working solution containing deuterated furan derivatives and [13C2]-2-PF were added to each sample with an automated analytical syringe (SGE Analytical Science, Trajan Scientific Europe Ltd, Crownhill, UK). For better sensitivity, 2.5 g of NaCl was added to the vial containing phosphate buffer (model A) and 7 mL of saturated saline solution into the vial containing silica gel (model B).
The vials were immediately sealed with magnetic screw caps and shaken for 60 s for equilibration. To preserve the fiber, septa with a thinned center (MicroCenter PTFE/Silicone Septa) were used (RESTEK, Bad Homburg, Germany). Before analysis, the samples were kept at room temperature for at least 30 min.
2.5. Headspace-solid-phase micro-extraction-gas chromatography–tandem mass spectrometry
2.5.1. Optimization
Mixed standard solutions containing furan and all tested furan derivatives (2-MF, 3-MF, 2-EF, 2,5-DMF, 3-FA, 2-FA, 2-FOL, 3-FOL, 2-AF, and 2-PF) were injected with 0.1–10 µg and analyzed with parameters for split, gas flow and temperature program mentioned in the final method. Three SPME fibers were considered for optimizing the extraction and desorption parameters, a fiber coated with 50/30 µm divinylbenzene (DVB)/carboxen (CAR)/polydimethylsiloxane (PDMS), a fiber with 75 µm CAR/PDMS, and a fiber with 65 µm DVB/PDMS (all Agilent Technologies, Waldbronn, Germany). The most efficient analyte separation was evaluated with the capillary columns HP-5MS column (30 m × 0.25 mm i.d., 0.25 µm film thickness, Agilent Technologies), DB-FFAP column (30 m × 0.25 mm i.d., 0.25 µm film thickness, Agilent Technologies), HP-PLOT-Q column (30 m × 0.32 mm i.d., 20 µm film thickness, Agilent Technologies), and TG-624 column (30 m × 0.25 mm i.d., 1.4 µm film thickness; Thermo Fisher Scientific, Waltham, MA).
2.5.2. Final method
Analyses were performed on an Agilent 8890 GC connected with an Agilent 7000D mass spectrometer (Agilent Technologies). HS-SPME was carried out automatically by a CTC PAL autosampler (PAL RSI 120; CTC Analytics, Zwingen, Switzerland) using a DVB/PDMS fiber (65 µm; Agilent Technologies) exposed to the headspace of the vial at a depth of 30 mm. During extraction, the vials were agitated (30 °C, 250 rpm) to encourage the transfer of the analytes into the headspace. After the extraction time of 25 min, the fiber was thermally desorbed in the multimode inlet (MMI) of the gas chromatograph for 2 min, which was maintained at 250 °C. A fiber bakeout was conducted between sample injections for 10 min at 250 °C to prevent carry-over among subsequent samples. To ensure no carry-over, sample blanks were analyzed regularly. The injection was performed in pulsed split mode, with a split ratio of 1:2 and a pulsed pressure of 25 psi (0.5 min) to provide a focused peak shape. The chromatographic separation was achieved using a TG-624 capillary column (30 m × 0.25 mm i.d., 1.4 µm film thickness; Thermo Fisher Scientific). Helium (5.0 quality; Westfalen, Münster, Germany) was used as carrier gas at a flow rate of 1.2 mL/min. The oven temperature was initially kept at 32 °C for 2.5 min, increased to 76 °C at a rate of 3 °C/min, followed by a further increase to 170 °C at a rate of 10 °C/min, and a final temperature ramp to 240 °C at a rate of 40 °C/min, kept for 2 min. The transfer line temperature was maintained at 250 °C. The detection of furan and its derivatives was performed in dynamic multiple reaction monitoring (dMRM) by MS, operating in electron impact (EI) mode at 70 eV. All characteristic precursor and product ions, the respective collision energies, and the retention times are shown in Table 1. The system was operated by MassHunter Workstation for GC–MS Data Acquisition 10.0. As quality control (QC), two amounts of the analytes (similar to calibration points 2 and 4 according to Section Standard Solutions) were measured at the end of each analytical batch. Peak analysis was carried out using MassHunter Quantitative Analysis 10.1 software. MassHunter Optimizer for GC Triple Quad 10.0 software (all Agilent Technologies) was used to optimize the data acquisition parameters, including collision energies and the precursor and product ions.
 Click to view | Table 1. Precursor and product ions of the GC–MS/MS method for furan, 2-methylfuran (2-MF), 3-methylfuran (3-MF), 2-ethylfuran (2-EF), 2,5-dimethylfuran (2,5-DMF), 3-furaldehyde (3-FA), furfural (2-FA), furfuryl alcohol (2-FOL), 3-furanmethanol (3-FOL), 2-acetylfuran (2-AF), and 2-pentylfuran (2-PF) and the corresponding stable isotopically substituted internal standards |
2.5.3. Validation
Limit of detection (LOD) and limit of quantification (LOQ) were estimated based on a signal-to-noise ratio (S/N) of ≥3 for LOD and ≥10 for LOQ. On three different days, the mixed standard solution used for calibration (according to Section Standard Solutions) was diluted 1:200 and spiked to samples containing 10 mL phosphate buffer at volumes of 5, 20, 100, 500, and 1,000 µL, resulting in concentrations that show S/N of 3 and 10. LOD and LOQ were expressed in ng per 10 mL phosphate buffer. For linearity and the determination of the coefficients (R2), mixed standard solutions at five different concentration levels (similar to the calibration standards according to Section Standard Solutions) were analyzed (n = 3). For precision and accuracy of the method, each furanoic compound was weighed and combined into a mixed standard solution that showed concentrations similar to the calibration standards (1–20 µg for each analyte, except for 2-FOL and 3-FOL of about 200 µg according to Section Standard Solutions), repeating this procedure two times. Two volumes (10 µL and 500 µL) of each mixed standard solution were transferred to a separate headspace vial (n = 3 for each volume) containing NaCl solution and 50 µL of the IS, following the procedure done during calibration preparation. Precision was expressed by the relative standard deviation (RSD), accuracy by the relative ratio of the calculated amount of the furanoic compounds determined by HS-SPME-GC–MS/MS and the spiked amount of the standard solution (which also accounts for the recovery of the procedure). Specificity was determined by analyzing blank samples prepared by adding 50 µL of methanol into 10 mL of a phosphate buffer solution with pH 7 (n = 6).
| 4. Results and discussion | ▴Top |
4.1. Headspace-solid phase micro-extraction-gas chromatography–tandem mass spectrometry (HS-SPME-GC–MS/MS)
To achieve optimal separation and quantification of furan and furan derivatives, the HS-SPME-GC–MS/MS conditions were optimized concerning extraction and desorption parameters, injection mode, type of the capillary column, oven temperature, and detector parameters. For evaluation of the extraction and desorption parameters, a divinylbenzene (DVB)/carboxen (CAR)/polydimethylsiloxane (PDMS) SPME fiber, a fiber coated with CAR/PDMS, and a fiber coated with DVB/PDMS were evaluated by measuring the mixed standard solution. Recent studies showed better extraction of oxygenated and alkylated furan derivatives with CAR/DVB/PDMS and CAR/PDMS fibers (Altaki et al., 2007; Batool et al., 2020). On the other hand, carry-over of 2-PF has been shown in the literature using carboxen-containing fibers (Frank et al., 2020). Furthermore, there is evidence that an artifact formation occurs during the desorption of CAR/PDMS fibers, especially at temperatures above 250 °C, explained by the long residence time of analytes on this fiber (Adams et al., 2012). In this study, the fibers were tested concerning peak shape, peak area and sensitivity, and carry-over. The DVB/PDMS fiber provided the best results for 9 of the 11 determined analytes compared to other fibers tested. Applying this fiber, all analytes were sufficiently extracted and transferred to the GC column. Carry-over or a critical degradation of single analytes to further derivatives was not obtained at the desorption temperature of 250 °C. Based on better results using a DVB/PDMS fiber (data not shown) and on the results reported in the literature (Adams et al., 2012; Altaki et al., 2007; Batool et al., 2020; Frank et al., 2020), this fiber was selected for the present study. The extraction temperature was set at 30 °C to avoid reduced adsorption for single analytes to the SPME fiber at higher temperatures, as has been demonstrated for furan (Altaki et al., 2007). The capillary columns HP-5MS, DB-FFAP, HP-PLOT-Q, and TG-624 were evaluated for peak separation and shape. Due to their high volatility, furan and methylfurans were not sufficiently retained and eluted very early on both HP-5MS and DB-FFAP, which hindered proper quantification (Figure S2). Huang et al. (2022a) successfully used an HP-5MS with a very short separation time bearing the risk of co-eluting analytes. HP-PLOT-Q is typically used for furan analytics (Delatour et al., 2020; Frank et al., 2020). Suitable retention times and peak shapes of furan and alkylfurans were provided on the HP-PLOT-Q column; however, other furan derivatives, e.g., 2-FA and 2-FOL, aren’t detectable using this column. The literature shows that the separation of the isomers 2-EF and 2,5-DMF is critical, as it occurred on the HP-PLOT-Q column, leading to co-elution (Frank et al., 2020; Shen et al., 2016). Due to the similar fragmentation products of 2-EF and 2,5-DMF a separate detection of these alkylfurans is not achievable, resulting in false quantification. Our study also observed these findings (Figure S2). Summarizing, the best results in our study were provided by the TG-624 column, which is a medium polarity phase (6% cyanopropylphenyl/94% methylpolysiloxane), ideally suited for volatile compounds. Baseline separation of all analytes, including 2-EF and 2,5-DMF, was finally successfully achieved by the TG-624 column, starting with a low initial temperature of 32 °C and a first temperature ramp of 3 °C/min.
4.2. Method validation
For method validation, sensitivity, linearity, precision, and accuracy were determined, and the results are summarized in Table 2. The sensitivity of the method was assessed by LOD and LOQ, which were calculated based on S/N ≥3 (LOD) and ≥10 (LOQ) on three different days. Except for 2-FOL (LOD 88.0 ng, LOQ 264 ng) and 3-FOL (LOD 108 ng, LOQ 325 ng), all analytes showed LOD and LOQ in the range of 0.019–5.30 ng. Linearity was determined in triplicate in the range representing the amounts typically found in model systems (mentioned in Section Standard Solutions). Good linearity with high correlation coefficients R2 ≥0.999 was achieved for all furanoic compounds. Precision was investigated for two concentration levels. For both levels and all furanoic compounds, the RSD were <8.06% (n = 6). The validation parameters in this study, e.g., the RSD of 4 to 13%, are in the same order of magnitude compared to those of the HS-SPME-GC–MS/MS method of Huang et al. (2022a). However, using solely furan-d4 as an internal standard has to be considered a remarkable difference between these two studies.
Click to view | Table 2. Limits of detection (LOD), limits of quantification (LOQ), linearity, repeatability, and reproducibility for furan, 2-methylfuran (2-MF), 3-methylfuran (3-MF), 2-ethylfuran (2-EF), 2,5-dimethylfuran (2,5-DMF), 3-furaldehyde (3-FA), furfural (2-FA), furfuryl alcohol (2-FOL), 3-furanmethanol (3-FOL), 2-acetylfuran (2-AF), and 2-pentylfuran (2-PF) |
Summarizing, well repeatable results expressed by low RSD for LOD and LOQ and the precision data showed the satisfying precision and accuracy of the entire method.
4.3. Quantification of furan and furan derivatives in model systems
4.3.1. Heating experiments with saccharides
In the first series of experiments, the formation of furan and furan derivatives from reducing mono- and disaccharides (non-enzymatic browning) were analyzed and compared. The model studies were conducted in aqueous systems with pH values of 4.5, 7, and 9 (model A) and in low moisture systems with silica gel (model B). Levels of furan and its derivatives were quantified by the optimized HS-SPME-GC–MS/MS method, and the results were expressed in micromoles of furan or furan derivative per mol of the precursor as the mean of three replicates. The most significant differences in model A of furan formation at pH 7 were between hexoses and pentoses and mono- and disaccharides (Figure 1a). Compared to other saccharides, the pentoses arabinose (895 µmol/mol) and ribose (998 µmol/mol) showed the highest formation of the parent furan under the selected conditions, followed by 1,4-linked disaccharides (657–859 µmol/mol). Except for pentoses, 2-FOL is by far the main reaction product of mono- and disaccharides (up to 49,684 µmol/mol), followed by furan, 2-FA, and 2-MF. Other alkylfurans such as 3-MF, 2-EF, and 2,5-DMF and the acetylated furan 2-AF were determined in traces. 2-PF generally was below the LOD.
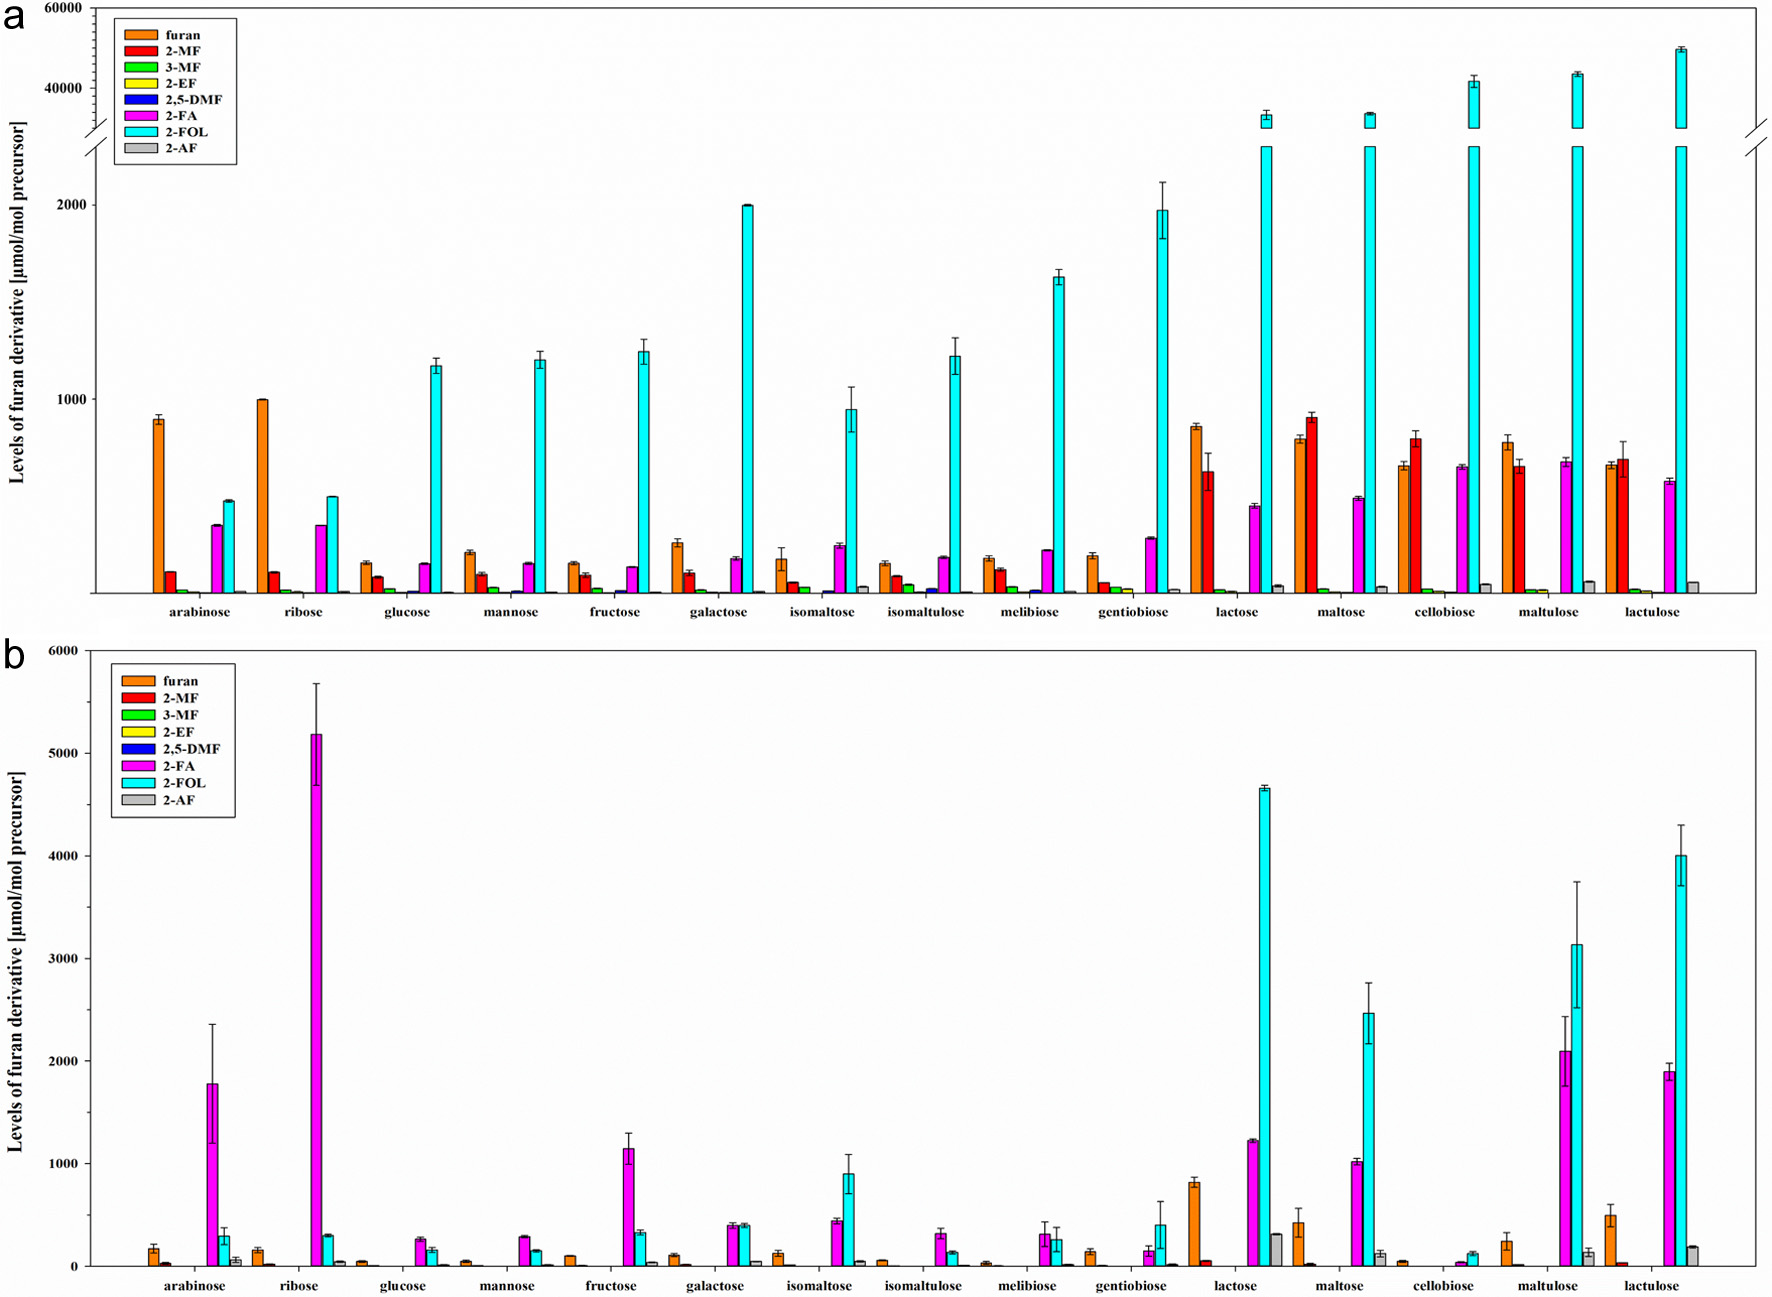 Click for large image | Figure 1. Levels [µmol/mol precursor] of furan, 2-methylfuran (2-MF), 3-methylfuran (3-MF), 2-ethylfuran (2-EF), 2,5-dimethylfuran (2,5-DMF), furfural (2-FA), furfuryl alcohol (2-FOL), and 2-acetylfuran (2-AF) (mean ± SD, n = 3) obtained by heat treatment of mono- and disaccharides in model A at pH 7 (a) and model B (b). |
Especially 1,4-linked disaccharides like lactose are known to form high levels of 2-FOL under thermal treatment and alkaline conditions (Patton, 1950). Applying the selected conditions (model A and pH 7), disaccharides yielded 2-FOL up to 100-fold compared to monosaccharides, with maltulose and lactulose as the most potent precursors. A proposed reason in literature is the presence of the sugar residue as a poor leaving group, leading to the elimination of formic acid, followed by cyclization and elimination of the sugar residue (Patton, 1950). 1,6-linked disaccharides appeared to form significantly lower amounts of 2-FOL than 1,4-linked disaccharides, comparable to monosaccharides. The primary food sources of 2-FOL are coffee products with around 250 mg/kg why the identification of precursors in the coffee matrix is of high interest and should be investigated in the future (Okaru and Lachenmeier, 2017). The high content of polymeric compounds, especially 1,4-linked polysaccharides, in green coffee beans, which undergo Maillard reaction, Strecker degradation, and caramelization, could lead to high levels of 2-FOL in roasted coffee beans (Albouchi and Murkovic, 2018; Wei and Tanokura, 2015). Besides coffee products, lactose-rich food, such as dairy products, contain specific amounts of 2-FOL, although the levels are very low compared to coffee products (ultrapasteurized milk: 122.3 µg/kg) (Okaru and Lachenmeier, 2017; Patton, 1950; Wherry et al., 2019). Concerning other furan derivatives, 1,4-linked disaccharides also formed the highest levels of 2-MF within the saccharides studied, with maltose being the most potent precursor. This could be explained by the research of Delatour et al. (2020). They demonstrated a formation of 2-MF while heating 2-FOL in model systems and proposed a mechanistic pathway where 2-MF is obtained by dehydration of the lateral chain of 2-FOL. In their study, no correlation between 2-FOL and 2-MF could be established in the ground coffee matrix, leading to the assumption that several other pathways are involved in forming 2-MF (Delatour et al., 2020).
The formation of furanoic compounds highly depended on the pH value of the studied model system (pH 4.5, 7, and 9) and varied between the derivatives (Figure S3). Concerning the parent furan, the formation at pH 7 was higher than at pH 4.5 and 9. Also, 2-FOL was highly formed at pH 7. Alkylfurans and 2-AF showed equal or even higher formation rates at pH 9 than at lower pH values, except for fructose, which showed higher formation of 2-AF at pH 4.5. Except for 2-FA, no other furan derivative was preferentially formed under acidic conditions. 2-FA was highly formed at pH 4.5, originating from pentoses. Industrially, 2-FA is produced by mineral acid hydrolysis of pentoses from biomass materials (Zhang et al., 2017). Therefore, the presence of 2-FA in thermally treated, plant-derived foods, especially with a low pH value, can be expected.
Besides pH conditions, the water content influenced the formation of furanoic compounds (Figure 1b). With less available water (model B), the degradation of saccharides shifted to the formation of 2-FA, whereas the formation of furan, alkylfurans, and 2-FOL was reduced. Pentoses, especially ribose, formed high levels of furfural at a water content of 10%. Similarly, the formation of 2-FOL from 1,4-linked disaccharides decreased with less available water, while the 2-FA formation increased. As the only 1,4-linked disaccharide, cellobiose showed little formation of furanoic compounds under dry conditions, whereas in model A, formation of furanoic compounds was comparable to other 1,4-linked disaccharides.
4.3.2. Heating experiments with fatty acids
PUFA were of interest because of their high susceptibility to oxidation, leading to furan formation. Regarding the formation of furan and furan derivatives, the main reaction products of PUFA during lipid oxidation are 2-alkylfurans with α-,β-unsaturated aldehydes as intermediates (Adams et al., 2011a; Vichi et al., 2003). In both model systems (model A, pH 7 and model B, 10% water content, Figure 2 and Table S1), the determined predominant 2-alkyfurans were 2-EF and 2-PF, as already mentioned in the literature (Adams et al., 2011a; Vichi et al., 2003). 2-EF was obtained as the reaction product derived from n-3 fatty acids (ALA, DHA, and EPA) and 2-PF from n-6 fatty acids (LA and GLA) (Figure 2). No formation of furanoic compounds was induced while heating saturated or monounsaturated fatty acids. With an increasing number of double bonds, the formation rate of furanoic compounds increased (EPA (20:5n-3) > ALA (18:3n-3) and DHA-EE (22:6n-3) > ALA-ME (18:3n-3)). No significant difference (p < 0.05) was observed between the n-6 fatty acids GLA (18:3n-6) and LA (18:2n-6). Comparing n-3 and n-6 fatty acids as free fatty acids, no correlation was obtained between the formation of furanoic compounds and the number of double bonds. The formation of furanoic compounds drastically increased generally while heating fatty acid esters compared to free fatty acids, e.g., 1,700 µmol furan and 2,784 µmol 2-EF per mol ALA compared to 8,604 µmol furan and 14,172 µmol 2-EF per mol ALA-ME. As fatty acids mainly occur as triglycerides in food, model systems conducted with fatty acid esters are more relevant considering food matrices.
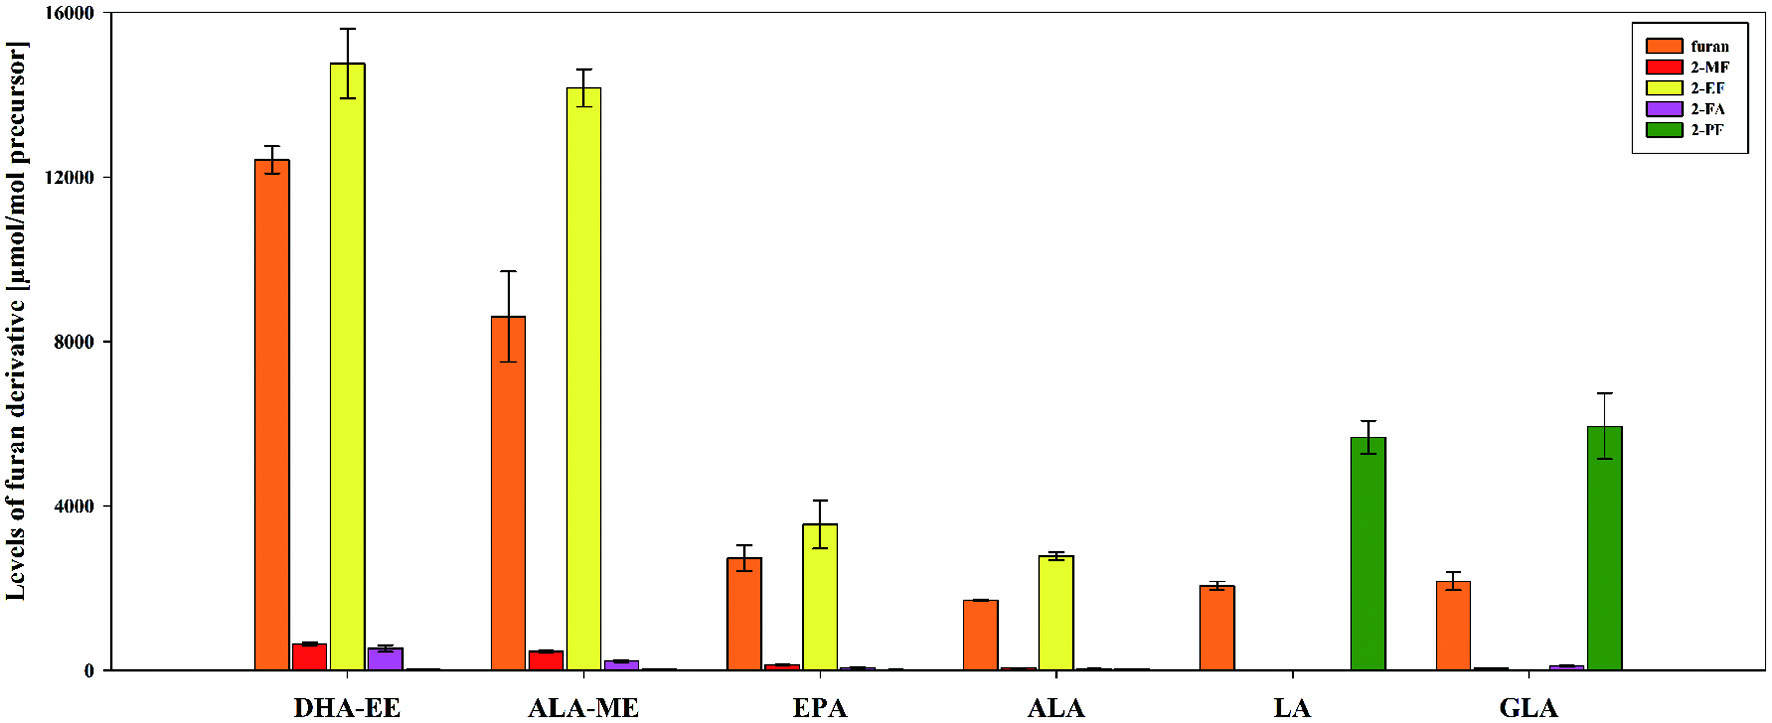 Click for large image | Figure 2. Levels [µmol/mol precursor] of furan, 2-methylfuran (2-MF), 3-methylfuran (3-MF), 2-ethylfuran (2-EF), furfural (2-FA), and 2-pentylfuran (2-PF) (mean ± SD, n = 3) obtained by heat treatment of the polyunsaturated fatty acids α-linolenic acid (ALA), α-linolenic acid methyl ester (ALA-ME), γ-linolenic acid (GLA), DHA ethyl ester (DHA-EE), eicosapentaenoic acid (EPA), and linoleic acid (LA) in model A at pH 7. |
The fatty acid esters DHA-EE and ALA-ME were heat processed and analyzed in model B. Formation of furanoic compounds was significantly lower than in the respective sample in model A (Table S1). Compared to the formation under aqueous conditions, the ratio of furan and alkylfurans (2-EF and 2-PF) shifted to the parent furan under dry conditions, e.g., ALA-ME with a ratio of 0.6 (model A) and 1.5 (model B) for furan/2-EF and DHA-EE with a ratio of 0.8 (model A) and 2.0 (model B) for furan/2-EF.
Additionally, different commercially available oils were heat-processed under aqueous conditions and analyzed according to their formation of furanoic compounds (Table 3). As expected, the oils with high contents of PUFA showed an increased formation of furan, 2-EF, and 2-PF. In the aqueous model system, n-6 rich oils such as soybean oil, linseed oil, safflower oil, and sunflower oil produced 2-PF (12.5–97.1 mg/100 g oil), and n-3 rich oils such as fish oil, algae oil, and linseed oil 2-EF (50.8–216 mg/100 g oil) during the heating process, depending on the percentage of the respective PUFA. For comparison, the predominant PUFA in linseed oil, ALA (Firestone, 2013), with a percentage of 25–66%, produced 14,172 µmol/mol 2-EF, corresponding to 469 mg 2-EF per 100 g raw fatty acid ester in the conducted aqueous model system. Therefore, the results of the model systems with fatty acid esters provide a valuable indication of the formation of furanoic compounds in heat-processed oils in closed reaction systems. Compared to published furan contents in food (<1 mg/kg) (European Food Safety Authority, 2009, 2017), the determined amounts of furanoic compounds in the conducted model systems were far higher. Contrary to complex food products, raw oils contain a high percentage of PUFA, which are highly potent precursors of furan, 2-EF, and 2-PF. Furthermore, most studies solely determine furan contents in food, and it has to be noted that this compound can evaporate easily and doesn’t represent the total formation of furanoic compounds.
Click to view | Table 3. Contents [mg/100 g sample] of furan, 2-methylfuran (2-MF), 3-methylfuran (3-MF), 2-ethylfuran (2-EF), furfural (2-FA), and 2-pentylfuran (2-PF) (mean ± SD, n = 3) obtained by heat treatment of different oils in model A at pH 7 and the corresponding fatty acid composition concerning the polyunsaturated fatty acids α-linolenic acid (ALA), docosahexaenoic acid (DHA), docosapentaenoic acid (DPA), eicosapentaenoic acid (EPA), and linoleic acid (LA) |
4.3.3. Heating experiments with mixtures of saccharides and amino acids
Experiments with mixtures of different precursors are necessary for better transfer of results from model systems to food. The composition of amino acids, saccharides, and fatty acids in food is diverse and assumed to influence the formation of furanoic compounds, e.g., the addition of different amino acids can affect the amount of furan formed from saccharides in Maillard model systems (Bi et al., 2017) and increase the formation of 2-alkylfurans from PUFA (Adams et al., 2011a). Therefore, amino acids alone and in the presence of different reducing sugars were heat-processed and analyzed.
The monosaccharides glucose, galactose, fructose, and ribose and the disaccharides lactose and maltose are heat treated as mixtures by adding one of the amino acids alanine, cysteine, leucine, proline, and serine. The amino acids were chosen based on preliminary experiments with mixtures involving 20 different amino acids related to their ability to inhibit or increase the formation of furanoic compounds and their relevance in food. Cysteine showed the most significant effect on the inhibition of furanoic compound formation, whereas proline showed an increasing impact. Alanine and serine were usually considered in comparable studies on the formation of furanoic compounds. Besides other amino acids, leucine is one of the quantitatively most relevant amino acids in food and therefore, of interest. In general, adding amino acids highly influenced the formation of furan and furan derivatives. Figure 3 shows the levels of furanoic compounds obtained by heat treatment of maltose as a representative of disaccharides and galactose as a representative of monosaccharides in mixtures with amino acids. Results for the other saccharide/amino acid mixtures are presented in the Supporting Information (Figure S4). In mixtures with amino acids, 2-MF increased the most compared to other furanoic compounds and was, therefore, most predominant after 2-FOL (Figure 3 and Figure S4), except for model systems with ribose, where furan is predominant. Generally, mixtures with proline showed the highest formation of furanoic compounds. At the same time, mixtures with cysteine showed an inhibited formation for most furanoic compounds. It is already described in the literature that cysteine inhibits the formation of furan and other processing contaminants, such as acrylamide (Bi et al., 2017; Zeng et al., 2009). However, regarding 2-FOL, cysteine showed the highest formation rates compared to other amino acids, especially for the disaccharides maltose (Figure 3) and lactose (Figure S4).
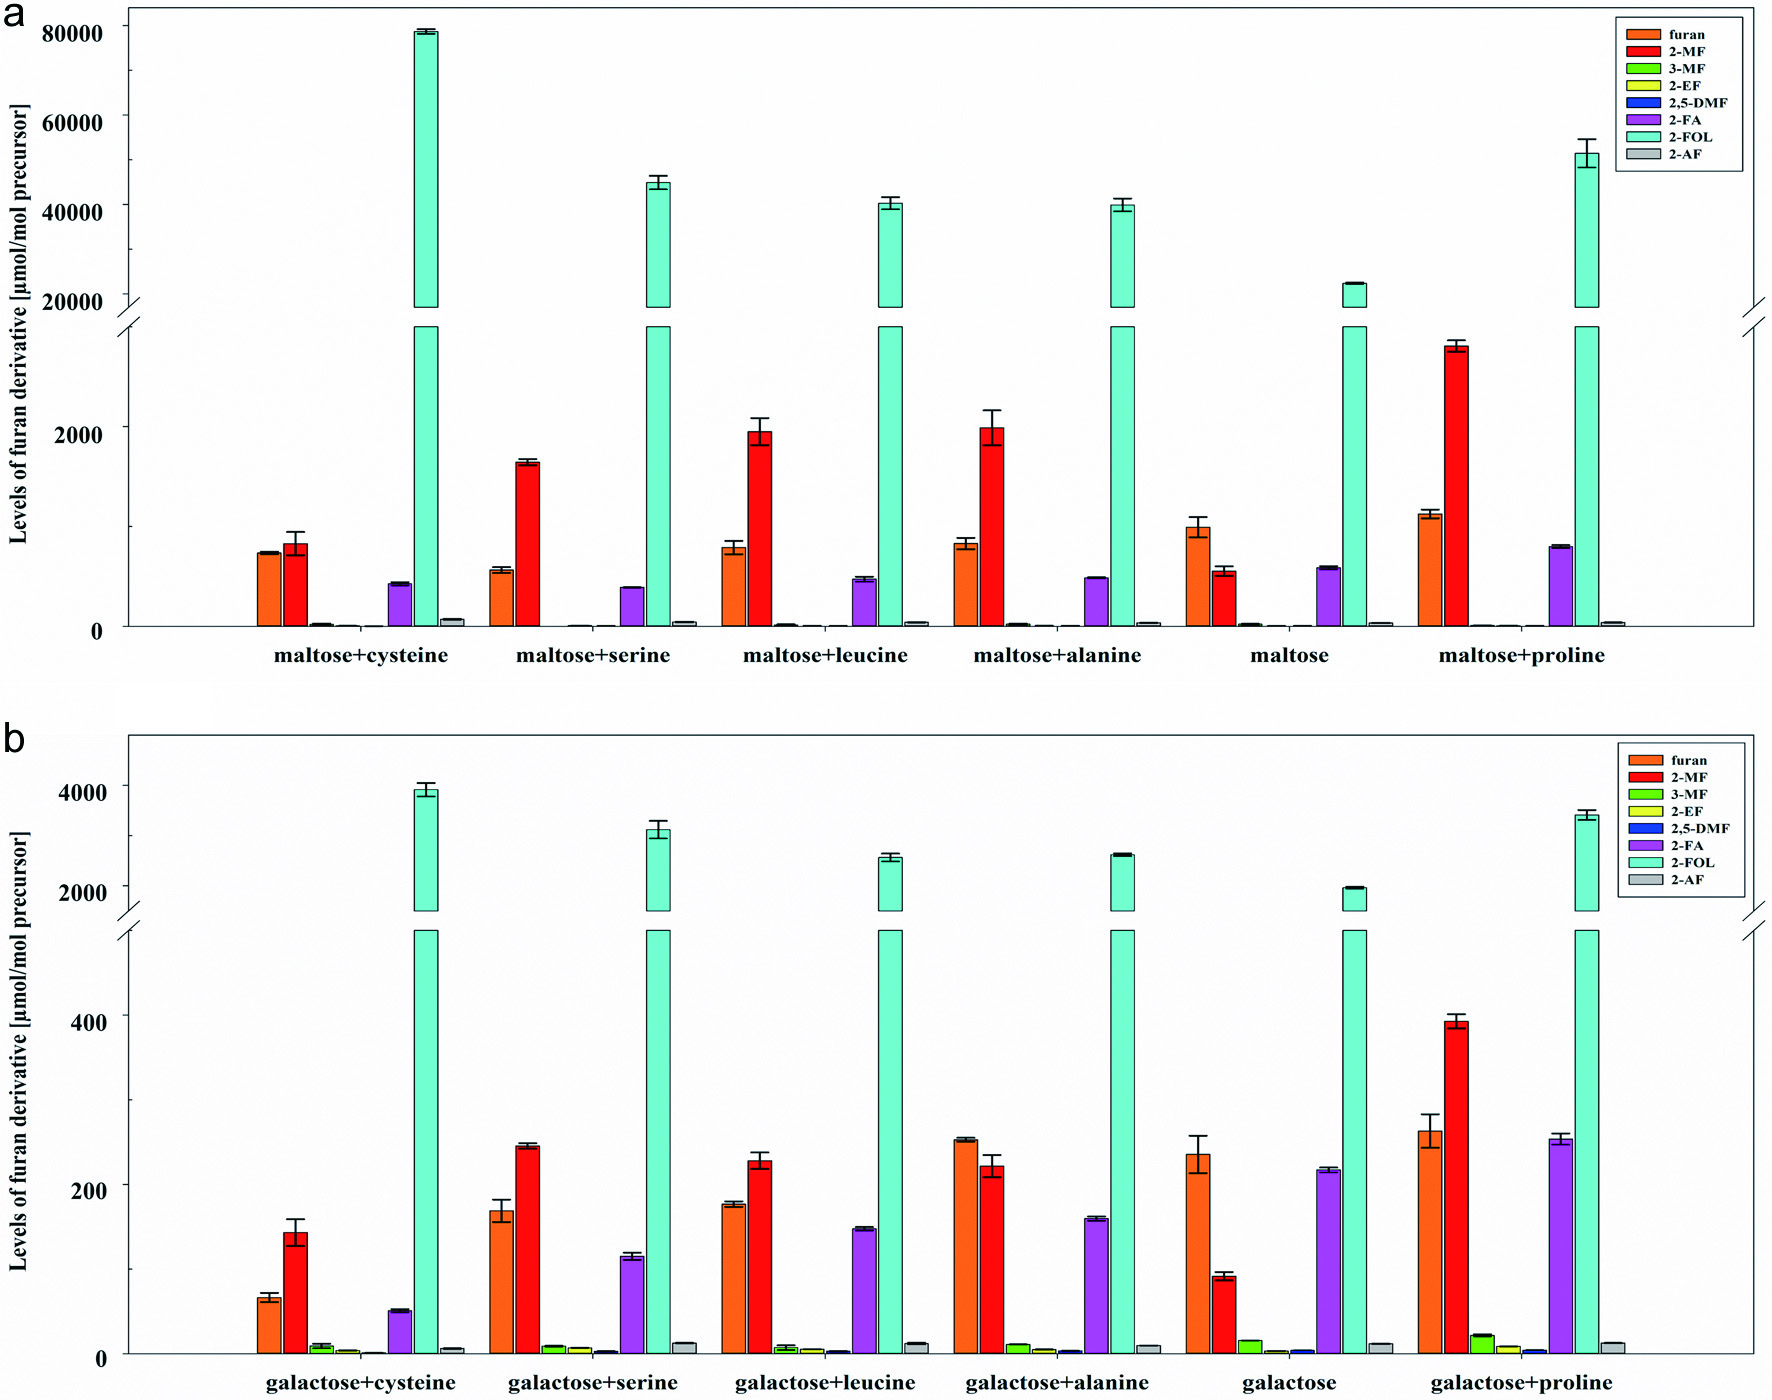 Click for large image | Figure 3. Levels [µmol/mol precursor] of furan, 2-methylfuran (2-MF), 3-methylfuran (3-MF), 2-ethylfuran (2-EF), 2,5-dimethylfuran (2,5-DMF), furfural (2-FA), furfuryl alcohol (2-FOL), and 2-acetylfuran (2-AF) (mean ± SD, n = 3) obtained by heat treatment of mixtures of (a) maltose and (b) galactose with alanine, cysteine, leucine, proline, and serine in model A at pH 7. |
| 5. Conclusion | ▴Top |
The developed HS-SPME-GC–MS/MS method was used to determine furan and ten furan derivatives with good precision and sensitivity. Regarding saccharides, the highest furan levels were obtained from pentoses, e.g., ribose of 998 µmol/mol, whereas 1,4-linked disaccharides formed the highest levels of furfuryl alcohol, e.g., lactose of 33.3 mmol/mol in the aqueous model system. The formation of 2-MF significantly increased in mixtures of saccharides and amino acids compared to saccharides as a single substance. In the low moister model system with saccharides, the formation of furfural increased while other derivatives decreased. Model systems were also conducted with fatty acids and oils. Besides furan, PUFA formed high amounts of 2-EF, originating from n-3 fatty acids, and 2-PF, originating from n-6 fatty acids. Therefore, oils with high contents of n-3 or n-6 fatty acids, e.g., linseed oil and safflower oil, showed the most elevated formation of 2-EF (linseed oil: 216.32 ± 26.93 mg/100 g) and 2-PF (safflower oil: 75.34 ± 0.7 mg/100 g). These findings can be considered a basis for predicting the formation of furan and furan derivatives in food.
| Supplementary material | ▴Top |
Figure S1. Heating block (in-house manufactured) with a magnetic stirrer (Hei-Tec with external temperature sensor Pt100, Heidolph Instruments, Germany).
Figure S2. HS-SPME-GC–MS/MS chromatogram of furan (1), 2-methylfuran (2), 3-methylfuran (3), 2-ethylfuran (4), 2,5-dimethylfuran (5), 3-furaldehyde (6), furfural (7), furfuryl alcohol (8), 3-furanmethanol (9), 2-acetylfuran (10), 2-pentylfuran (11) separated on HP-PLOT-Q (A), HP5-MS (B) and TG-624 (C). The chromatogram showing the separation on TG-624 (C) includes the internal standards’ peaks with slightly deviating retention times compared to the standards’ peaks.
Figure S3. Levels [µmol/mol precursor] of (A) furan, (B) 2-methylfuran (2-MF), (C) 3-methylfuran (3-MF), (D) 2-acetylfuran (2-AF), (E) furfural (2-FA), and (F) furfuryl alcohol (2-FOL) (mean ± SD, n = 3) obtained by heat treatment of mono- and disaccharides in model A at pH 4.5, 7, and 9.
Figure S4. Levels [µmol/mol precursor] of furan, 2-methylfuran (2-MF), 3-methylfuran (3-MF), 2-ethylfuran (2-EF), 2,5-dimethylfuran (2,5-DMF), furfural (2-FA), furfuryl alcohol (2-FOL), and 2-acetylfuran (2-AF) (mean ± SD, n = 3) obtained by heat treatment of mixtures of (C) fructose, (D) glucose, (E) ribose, and (F) lactose with alanine, cysteine, leucine, proline, and serine in model A at pH 7.
Table S1. Levels [µmol/mol precursor] of furan, 2-methylfuran (2-MF), 3-methylfuran (3-MF), 2-ethylfuran (2-EF), furfural (2-FA), and 2-pentylfuran (2-PF) (mean ± SD, n = 3) obtained by heat treatment of the polyunsaturated fatty acids α-linolenic acid (ALA), α-linolenic acid methyl ester (ALA-ME), γ-linolenic acid (GLA), DHA ethyl ester (DHA-EE), eicosapentaenoic acid (EPA), and linoleic acid (LA) in model A at pH 7 (a) and ALA-ME and DHA-EE in model B (b).
Acknowledgments
The authors would like to express many thanks to bachelor’s student Miss Sabrin El-Zahab for support in the laboratory. In memory of Prof. Dr. Michael Granvogl.
Deceased.
Conflict of interest
The authors declare no conflict of interest.
Alena Schöpf: designed study, conduct experiments, collect data, writing – original draft; Claudia Oellig: resources, writing – review & editing, supervision, project administration; Michael Granvogl: resources, writing – review & editing, supervision, project administration.
| References | ▴Top |