| Journal of Food Bioactives, ISSN 2637-8752 print, 2637-8779 online |
| Journal website www.isnff-jfb.com |
Original Research
Volume 29, March 2025, pages 47-59
Impact of constant light-induced circadian disruption on hepatic lipid metabolism: Evaluating the effects of GABA oolong tea extract
Yen-Chun Koha, Sang Hea, Chun-Han Changa, Meei-Ju Yangb, Chang Liuc, Min-Hsiung Pana, d, *
aInstitute of Food Sciences and Technology, National Taiwan University, 10617 Taipei, Taiwan, China
bTaiwan Tea Research and Extension Station, 326011 Taoyuan, Taiwan, China
cCollege of Biology and Agricultural Resources, Huanggang Normal University, Huanggang, 438000, Hubei Province, China
dDepartment of Medical Research, China Medical University Hospital, China Medical University, 40402 Taichung City, Taiwan, China
*Corresponding author: Min-Hsiung Pan, Institute of Food Science and Technology, National Taiwan University, No. 1, Section 4, Roosevelt Road, Taipei 10617, Taiwan, China. Tel: +886-2-33664133; Fax: +886-2-33661771; E-mail: mhpan@ntu.edu.tw
DOI: 10.26599/JFB.2025.95029403
Received: March 7, 2025
Revised received & accepted: March 22, 2025
| Abstract | ▴Top |
Disruptions in circadian rhythms have been associated with metabolic disorders such as obesity and fatty liver disease. This study aimed to evaluate the effects of GABA oolong tea extract (OTE) on metabolic disturbances induced by constant light (LL) exposure and a high-fat diet (HFD) in mice. The results showed that LL alone did not induce obesity but significantly reduced food intake and water consumption while increasing food conversion efficiency and blood glucose levels. In contrast, LL + HFD led to significant weight gain, increased white, beige, and brown adipose tissue weights, larger adipocyte size, and severe hepatic lipid infiltration. At the molecular level, LL and LL + HFD significantly reduced hepatic AMPK phosphorylation and PPARα expression, impairing fatty acid β-oxidation and promoting triglyceride accumulation. OTE intervention decreased hepatic triglyceride levels but did not alleviate obesity or metabolic dysfunction. These findings suggest that LL exacerbates HFD-induced metabolic disturbances, and OTE may have limited protective effects under these conditions. Further studies with higher OTE dosages are warranted.
Keywords: Oolong tea; Constant light; Obesity; GABA; Caffeine
| 1. Introduction | ▴Top |
Constant light (LL) exposure is a commonly used method to induce circadian rhythm disruption in research. This approach involves subjecting organisms to prolonged light stimulation (Golombek and Rosenstein, 2010). Studies have shown that approximately two-thirds of mice housed under constant light (LL) conditions develop circadian rhythm disturbances, such as arrhythmias. However, when these mice are returned to a normal light-dark cycle, they exhibit a strong resurgence of circadian activity rhythms. These findings suggest that in many organisms, including humans, the biological clock and its regulation of circadian organization can be disrupted by LL exposure. However, when external circadian cues are restored, the circadian rhythms of these organisms also recover. This demonstrates that the abnormal circadian states and locomotor activity induced by LL exposure are reversible (Ohta et al., 2006). Literature reports have examined various physiological parameters in mice under constant light (LL) conditions. The results indicate that while LL exposure does not affect the total 24-hour food intake, it alters the temporal distribution of food consumption. Under a normal light-dark cycle, mice consume less food during the daytime and more at night. However, in an LL environment, food intake becomes evenly distributed between day and night. Despite having similar total food intake, mice exposed to LL exhibit increased hepatic fat accumulation. These findings suggest that an abnormal distribution of food intake contributes to increases in body weight and fat mass. Even when body weight is comparable to that of control mice, increases in fat mass and adipocyte size can still be observed (Borck et al., 2018).
It is widely believed that sleep deprivation increases the risk of obesity. A study comparing serum leptin levels between mice subjected to chronic jet lag and control mice found that the chronically jet-lagged mice exhibited significantly greater body weight and elevated leptin levels, indicative of leptin resistance (Kettner et al., 2015). Given the strong association between leptin levels and obesity, the study suggested that the development of leptin resistance is linked to circadian rhythm disruption and may serve as a marker of obesity induced by constant light (LL) exposure. Similar findings have been observed in human studies. Research indicates that shift workers, who frequently experience circadian misalignment, are at a higher risk of developing metabolic disorders, including cardiometabolic diseases, metabolic syndrome, and cardiovascular disease. Additionally, individuals with shorter sleep durations (typically less than six hours per night) tend to exhibit irregular eating patterns, increased meal frequency, a preference for snacking over full meals, reduced vegetable intake, and a heightened craving for high-sodium foods. These behaviors are strongly associated with an increased risk of obesity, supporting the notion that circadian rhythm disruption enhances cravings for high-fat and high-salt foods, ultimately contributing to weight gain (Imaki et al., 2002).
The Tea Research and Extension Station of the Council of Agriculture, Executive Yuan, Taiwan, China, has developed a novel processing technique for oolong tea that maximizes the retention of γ-aminobutyric acid (GABA). This innovation allows the final product, known as GABA oolong tea, to be rich in functional GABA while maintaining the characteristic bioactive compounds and lingering sweetness of traditional oolong tea. The uniqueness of GABA oolong tea lies in its production process, where nitrogen gas is used to replace oxygen. Under these conditions, GABA transaminase loses its activity, preventing the conversion of GABA into succinic semialdehyde (Wang et al., 2020). As a result, GABA accumulates in large quantities within the tea leaves, leading to the formation of GABA oolong tea.
GABA is an important sleep-promoting factor in the human body. However, previous studies have suggested that the brain is protected by the blood-brain barrier (BBB), which consists of tightly connected endothelial cells that provide selective permeability, preventing the passage of large molecules. Although GABA has a relatively small molecular weight, its ability to reach the brain via the bloodstream may be restricted by the selective permeability of the BBB (Roberts, 1974). Even if some GABA does cross the barrier, the amount is likely to be minimal. Since GABA is difficult to supplement exogenously, theanine, which has a chemical structure similar to glutamate—an active neurotransmitter in the brain—can serve as a precursor for GABA synthesis. Therefore, it may be considered an ideal alternative for GABA supplementation (Kim et al., 2009). A recent study demonstrated that GABA exerts anti-obesity effects in mice by activating the protein kinase A (PKA) signaling pathway (Jin et al., 2024). Additionally, GABA treatment has been shown to promote adipose tissue beiging by modulating the gut microbiota (Ma et al., 2023). Moreover, GABA supplementation has been shown to alleviate age-related sarcopenic obesity in mice (Jin et al., 2023). Oral administration of GABA is not necessarily ineffective, as its beneficial effects on the human body may occur through alternative pathways. For instance, GABA may be absorbed in the intestine after passing through the digestive tract, where it can interact with GABAA receptors in the enteric nervous system and transmit signals to the brain (Boonstra et al., 2015). A study utilizing a streptozotocin (STZ)-induced rat model—a commonly used model for type 1 diabetes due to STZ’s selective toxicity to pancreatic β-cells—investigated the effects of GABA intervention. While GABA administration did not improve body weight in the diabetic rats, it significantly reduced blood glucose levels, achieving a hypoglycemic effect comparable to that of insulin treatment. These findings suggest that GABA may serve as a potential alternative for improving type 2 diabetes (Sohrabipour et al., 2018). In our previous study, we found that GABA oolong tea extracts (OTEs) can prevent high-fat diet-induced obesity in mice by reducing leptin expression, protecting against nonalcoholic fatty liver disease, promoting thermogenesis and lipid metabolism, and inhibiting lipogenesis, suggesting its potential for obesity prevention (Weerawatanakorn et al., 2023). Excessive fat accumulation can lead to leptin resistance, which is characterized by elevated leptin levels (Martínez-Sánchez, 2020). OTEs could help to reverse this obesity-induced condition.
In recent years, the prevalence of obesity has been rising due to changes in life style and eating habits. One contributing factor is the increasing consumption of high sugar and high-fat foods. Additionally, modern lifestyles are characterized by irregular sleep patterns and prolonged nighttime activities, leading to increased exposure to artificial light at night, which may serve as a potential risk factor for obesity. Therefore, we aim to investigate whether the intervention of GABA-rich oolong tea can improve obesity induced by constant light exposure and a high-fat diet.
| 2. Materials and methods | ▴Top |
2.1. Materials
The freeze-dried GABA oolong tea powder was provided by the Taiwan Tea Research and Extension Station (Taiwan, China). The major bioactive components are shown in Figure 1a. Antibodies targeting anti-p-AMPK, AMPK, p-ACC, ACC, and FASN were purchased from Cell Signaling Technology (Cell Signaling, MA, USA), while the antibody against PPARα was sourced from Abcam PLC (Abcam, Cambridge, UK). Antibodies against vinculin were acquired from Proteintech (Proteintech, IL, USA), and anti-SREBP-1a was purchased from Santa Cruz Biotechnology (Santa Cruz, Texas, USA).
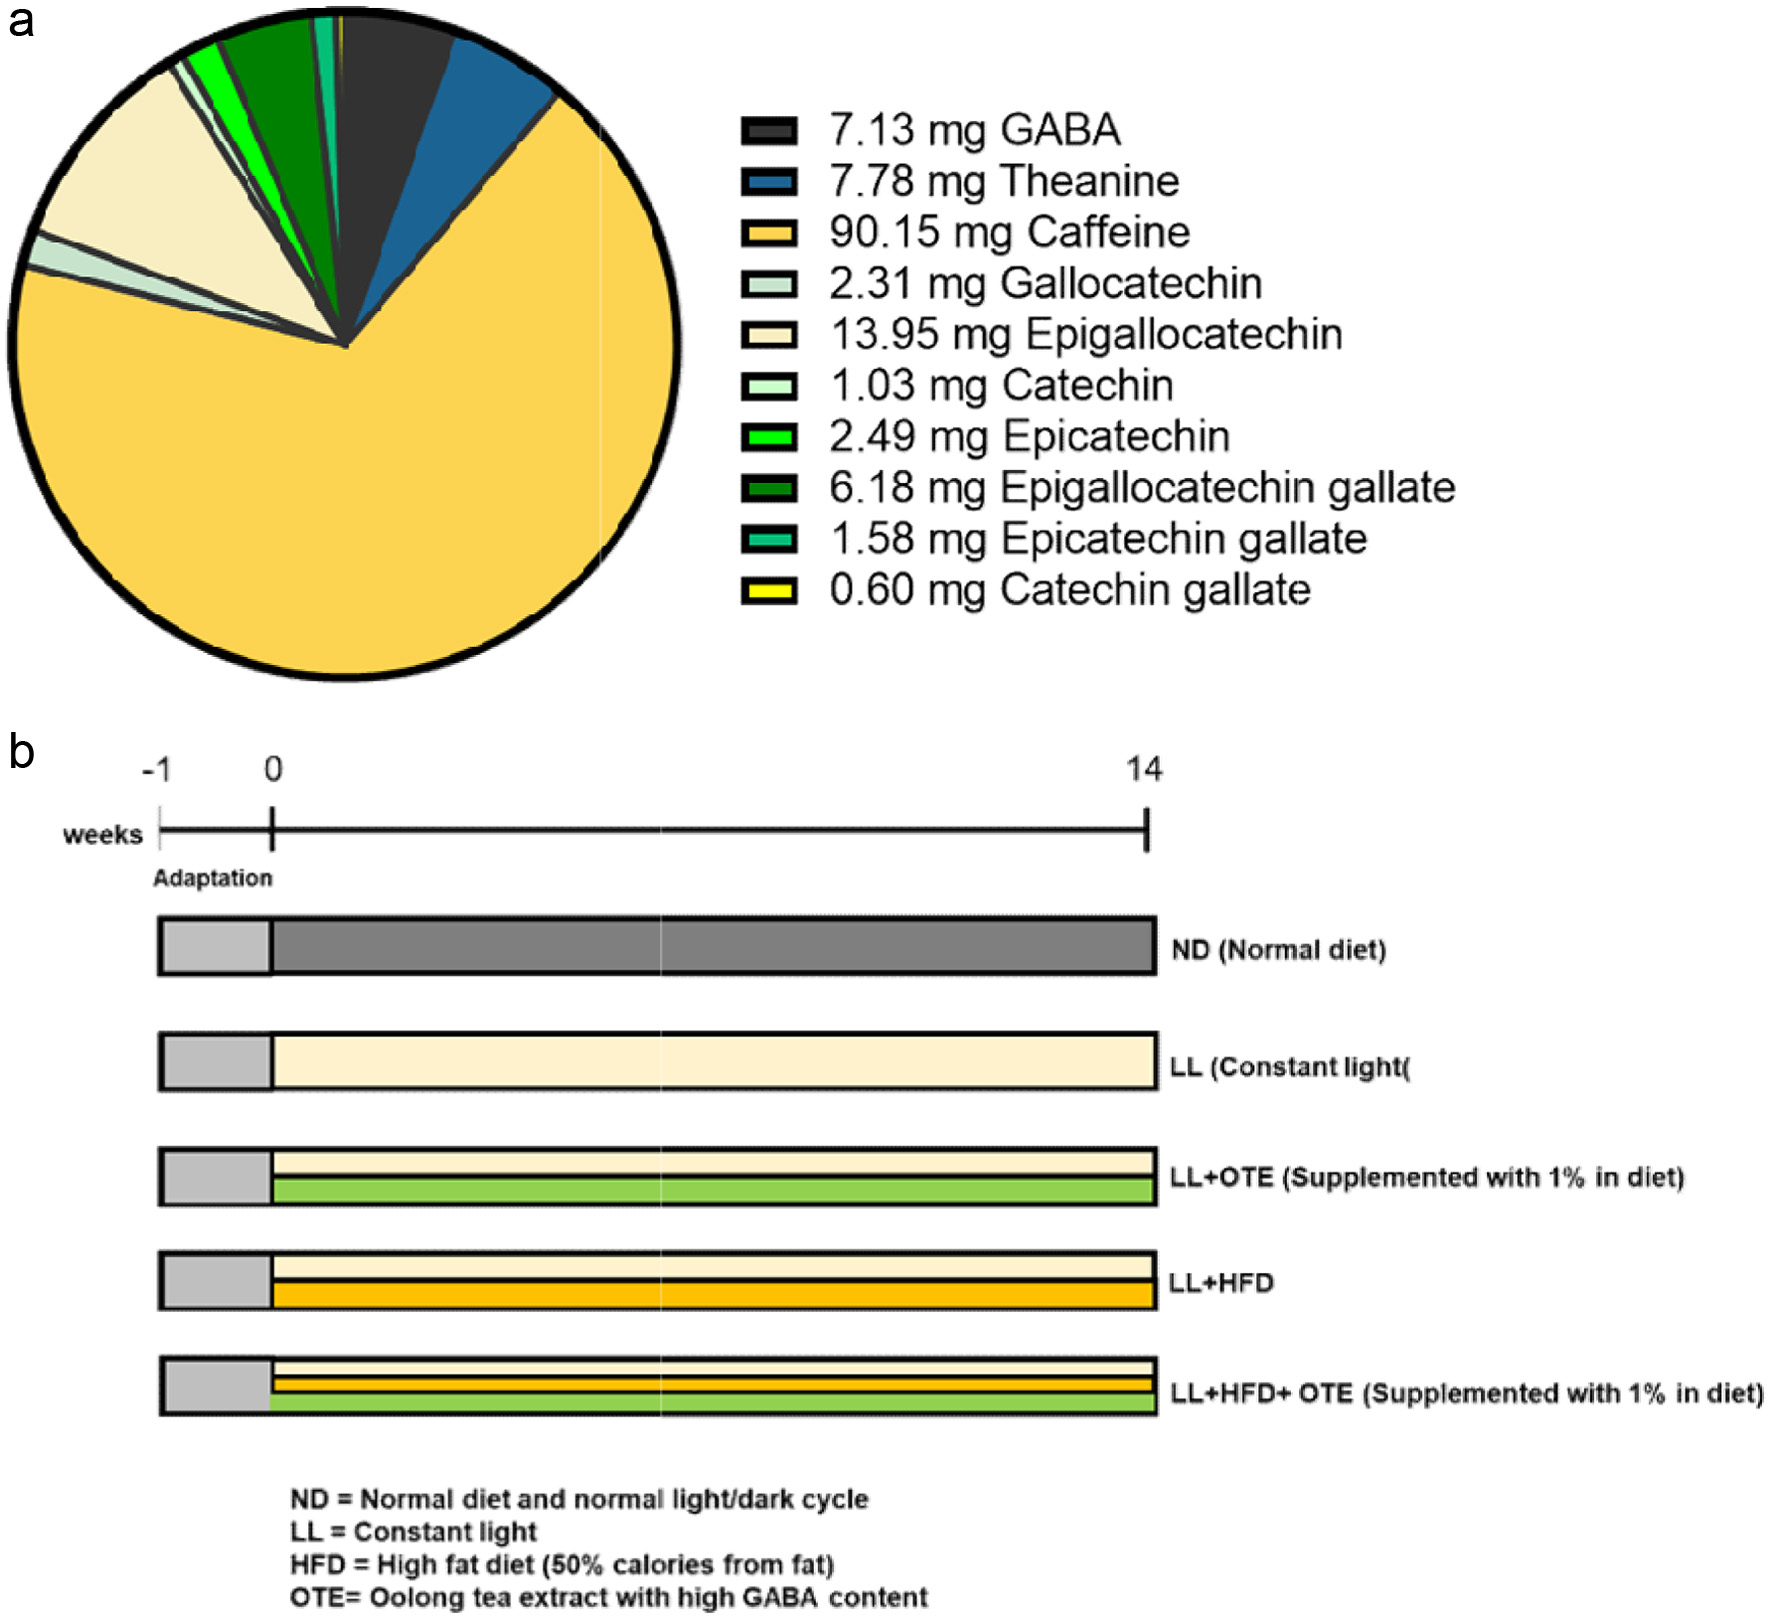 Click for large image | Figure 1. (a) Bioactive compound content per gram of freeze-dried tea extract. (b) Schematic representation of the experimental design. The OTE sample and the amount of bioactive compounds in OTE are based on our previous study (Weerawatanakorn et al., 2023). The chart is reproduced from the same analysis. |
2.2. Animal care and study design
A total of forty 4-week-old male C57BL/6 mice were obtained from the National Laboratory Animal Center (Taipei, Taiwan, China). The mice were housed under controlled environmental conditions, with a temperature of 25 ± 1°C and a relative humidity of 50%. After a one-week acclimation period, the mice were randomly assigned to five groups: ND (normal diet and normal light/dark cycle), constant Light (LL), LL + OTE (1% supplemented in diet), LL + HFD (high-fat diet), and LL + HFD + OTE, with 8 mice per group. The HFD group was fed a high-fat diet (50% calories from fat) for 14 weeks, while the LL group was subjected to continuous light exposure (24 hours per day) using daylight lamps. The experimental design is shown in Figure 1b. Weekly measurements of food intake, water consumption, and body weight were recorded. Blood glucose levels were assessed at week 12. Upon sacrifice, white, beige, and brown adipose tissues, along with the liver, kidneys, and spleen, were collected and weighed. All experimental protocols used in this study were approved by the Institutional Animal Care and Use Committee of the National Taiwan University (NTU-109-EL-00147, IACUC, NTU), China.
2.3. H&E staining
For histopathological analysis, the procedure was performed according to our previous study (Koh et al., 2025). In detail, liver and two types of adipose tissues were subjected to H&E staining to visualize structural characteristics. Initially, tissue samples were fixed in a 10% formalin solution. After fixation, the tissues were dehydrated and embedded in paraffin. The paraffin-embedded tissues were then sectioned into 3–5 µm thick slices. The tissue sections underwent deparaffinization, rehydration, and were then stained following the H&E protocol. The histological examination focused on identifying the presence of empty vacuoles and evaluating adipocyte sizes. The size distribution of adipocytes in the adipose tissue was quantified using ImageJ software.
2.4. Hepatic triglyceride content
Triglyceride levels in the liver tissues were quantified using a triglyceride colorimetric assay kit (10010303, Cayman) following the manufacturer’s guidelines. The tissue samples were weighed, homogenized, and the resulting supernatants were collected for subsequent analysis.
2.5. Western blotting procedure
For western blot, the procedure was performed according to our previous study (Koh et al., 2023). Liver tissues were homogenized and lysed using ice-cold lysis buffer, followed by minimum of 1-hour incubation on ice. After homogenization, the samples were centrifuged at 14,000 xg for 1 hour at 4 °C. The supernatants were carefully collected and stored at −80°C until further use. Protein concentrations were determined using a Bio-Rad protein assay. For electrophoresis, 25 μg of protein samples were loaded into individual wells and transferred onto PVDF membranes (Merck Millipore Ltd., Tullagreen, County Cork, Ireland). After transfer, membranes were blocked with a blocking solution and incubated overnight with primary antibodies at 4 °C. To ensure proper antibody binding and remove unbound antibodies, the membranes were washed three times for 10 minutes with a solution containing 0.2% Tween 20 in phosphate-buffered saline (TPBS), both before and after applying secondary antibodies. Protein bands were visualized using chemiluminescence (ECL, Merck Millipore Ltd.), and densitometry analysis of the bands was performed using ImageJ software. Vinculin was used as the internal control in the western blotting.
2.6. Statistical analysis
The experimental results are presented as the mean ± standard deviation (mean ± SD). Statistical analysis was performed using one-way ANOVA followed by Duncan’s Multiple Range Test to assess differences between groups. A p-value < 0.05 was considered statistically significant.
| 3. Results | ▴Top |
3.1. The effect of OTE on the appearance and body weight of C57BL/6 mice under HFD feeding and constant light conditions
After 14 weeks of ad libitum feeding, no significant differences in body shape were observed between the ND, LL, and LL + OTE groups. Similarly, there were no noticeable differences in body shape between the LL + HFD and LL + HFD + OTE groups, although these mice appeared visibly more rounded and larger compared to the aforementioned three groups (Figure 2a). In terms of body weight, the LL + HFD group (31.87 ± 1.76 g) and LL + HFD + OTE group (32.10 ± 2.05 g) had significantly higher average body weights compared to the ND group (21.47 ± 1.53 g), LL group (27.33 ± 1.78 g), and LL + OTE group (26.22 ± 1.02 g) (Figure 2b). However, no significant improvement in body weight was observed with OTE intervention under LL conditions.
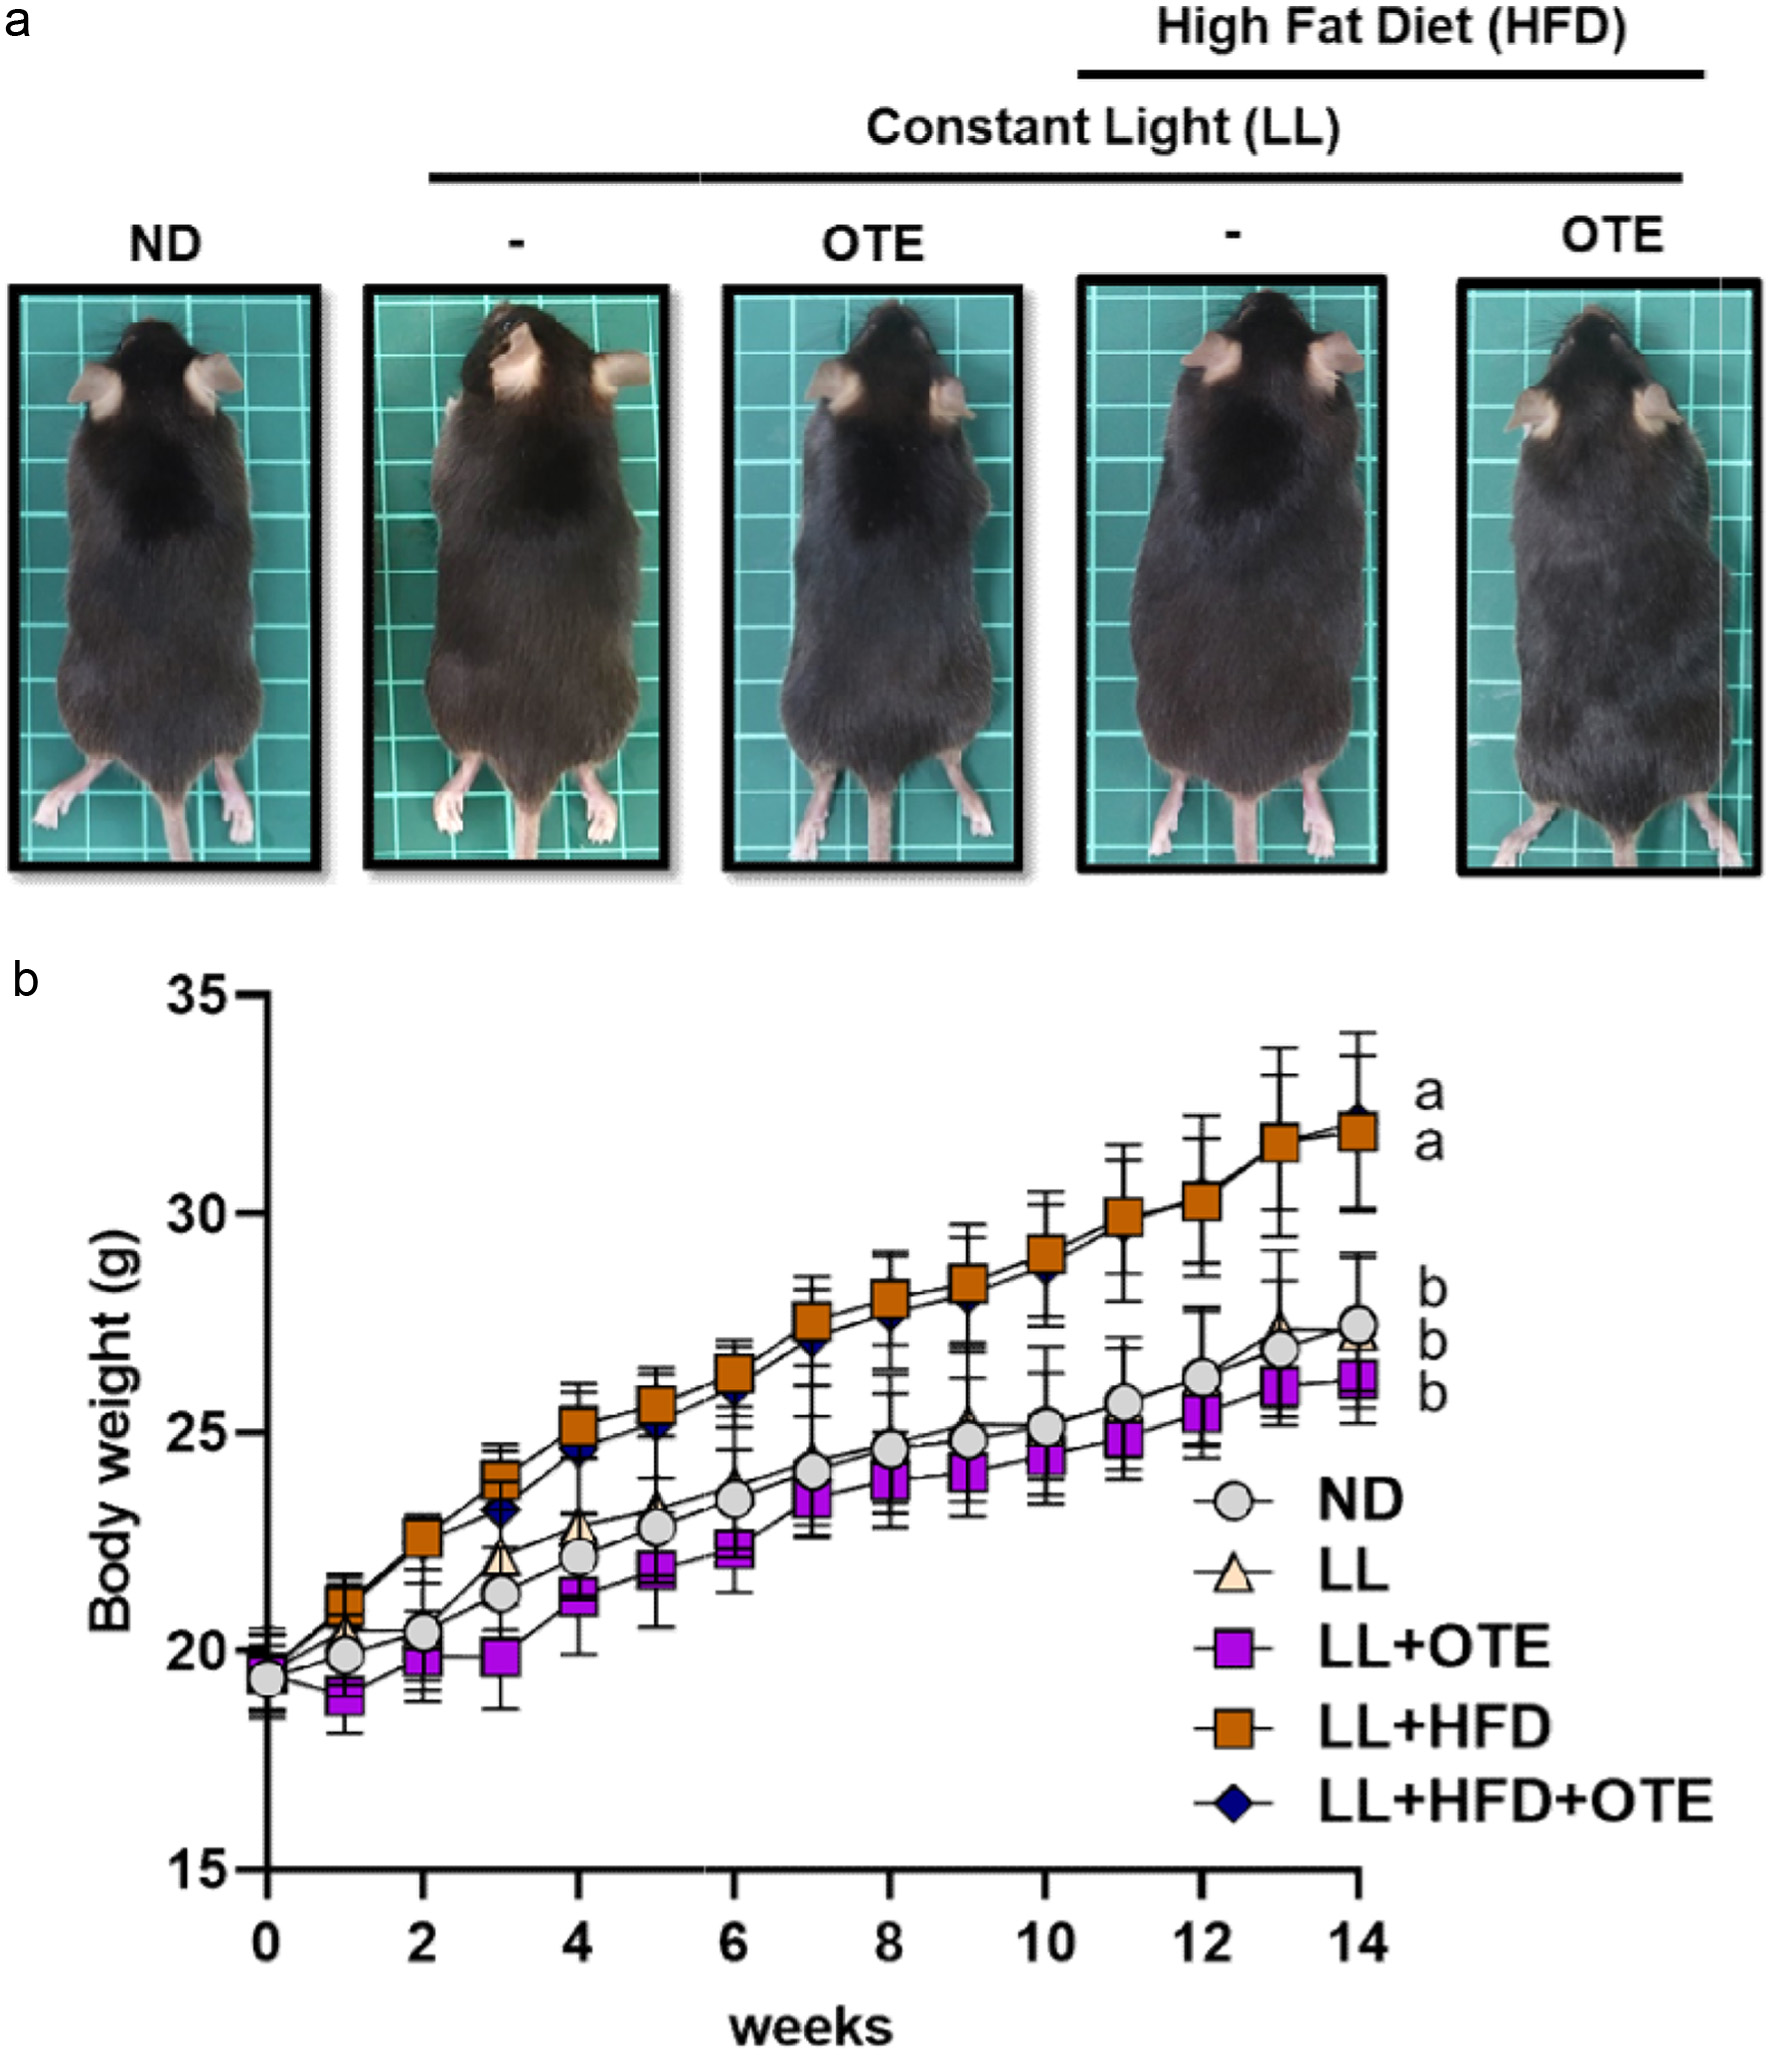 Click for large image | Figure 2. The effect of OTE on the appearance and body weight of C57BL/6 mice under HFD feeding and constant light conditions. (a) Representative images of mice from each group. (b) Body weight changes over 14 weeks (N = 8). Different lowercase letters indicate a significant difference among the groups, as determined by ANOVA followed by Duncan’s post hoc test. |
3.2. Effect of OTE on food intake, food efficiency, and water consumption in mice under constant light conditions
During the 14-week feeding period, weekly food intake was recorded to determine if OTE had an impact on the appetite of the mice. The results showed that compared to the ND group (4.43 ± 0.56 g), the LL group (3.48 ± 0.75 g) significantly reduced the food intake of the mice. Further reduction in food intake was observed in the LL + OTE group (3.12 ± 0.26 g). The LL + HFD group (2.58 ± 0.26 g) and LL + HFD + OTE group (2.70 ± 0.18 g) showed even more significant reductions in food intake (Figure 3a). These findings, in conjunction with Figure 2a, suggest that LL can suppress food intake without significantly affecting body weight, while the addition of HFD in the LL environment further exacerbates the suppressive effect and significantly increases body weight. Regarding food efficiency, the LL group (2.12 ± 0.18) and LL + OTE group (2.22 ± 0.14) exhibited significantly higher food efficiency compared to the ND group (1.70 ± 0.23). The LL + HFD group (4.06 ± 0.29) and LL + HFD + OTE group (4.13 ± 0.54) had significantly higher food efficiency than both the LL and LL + OTE groups (Figure 3b). This indicates that both LL and HFD increase food efficiency in mice, and the combination of both factors further increases food efficiency. However, regardless of whether HFD was applied, OTE did not change the food efficiency of the mice in a constant light environment.
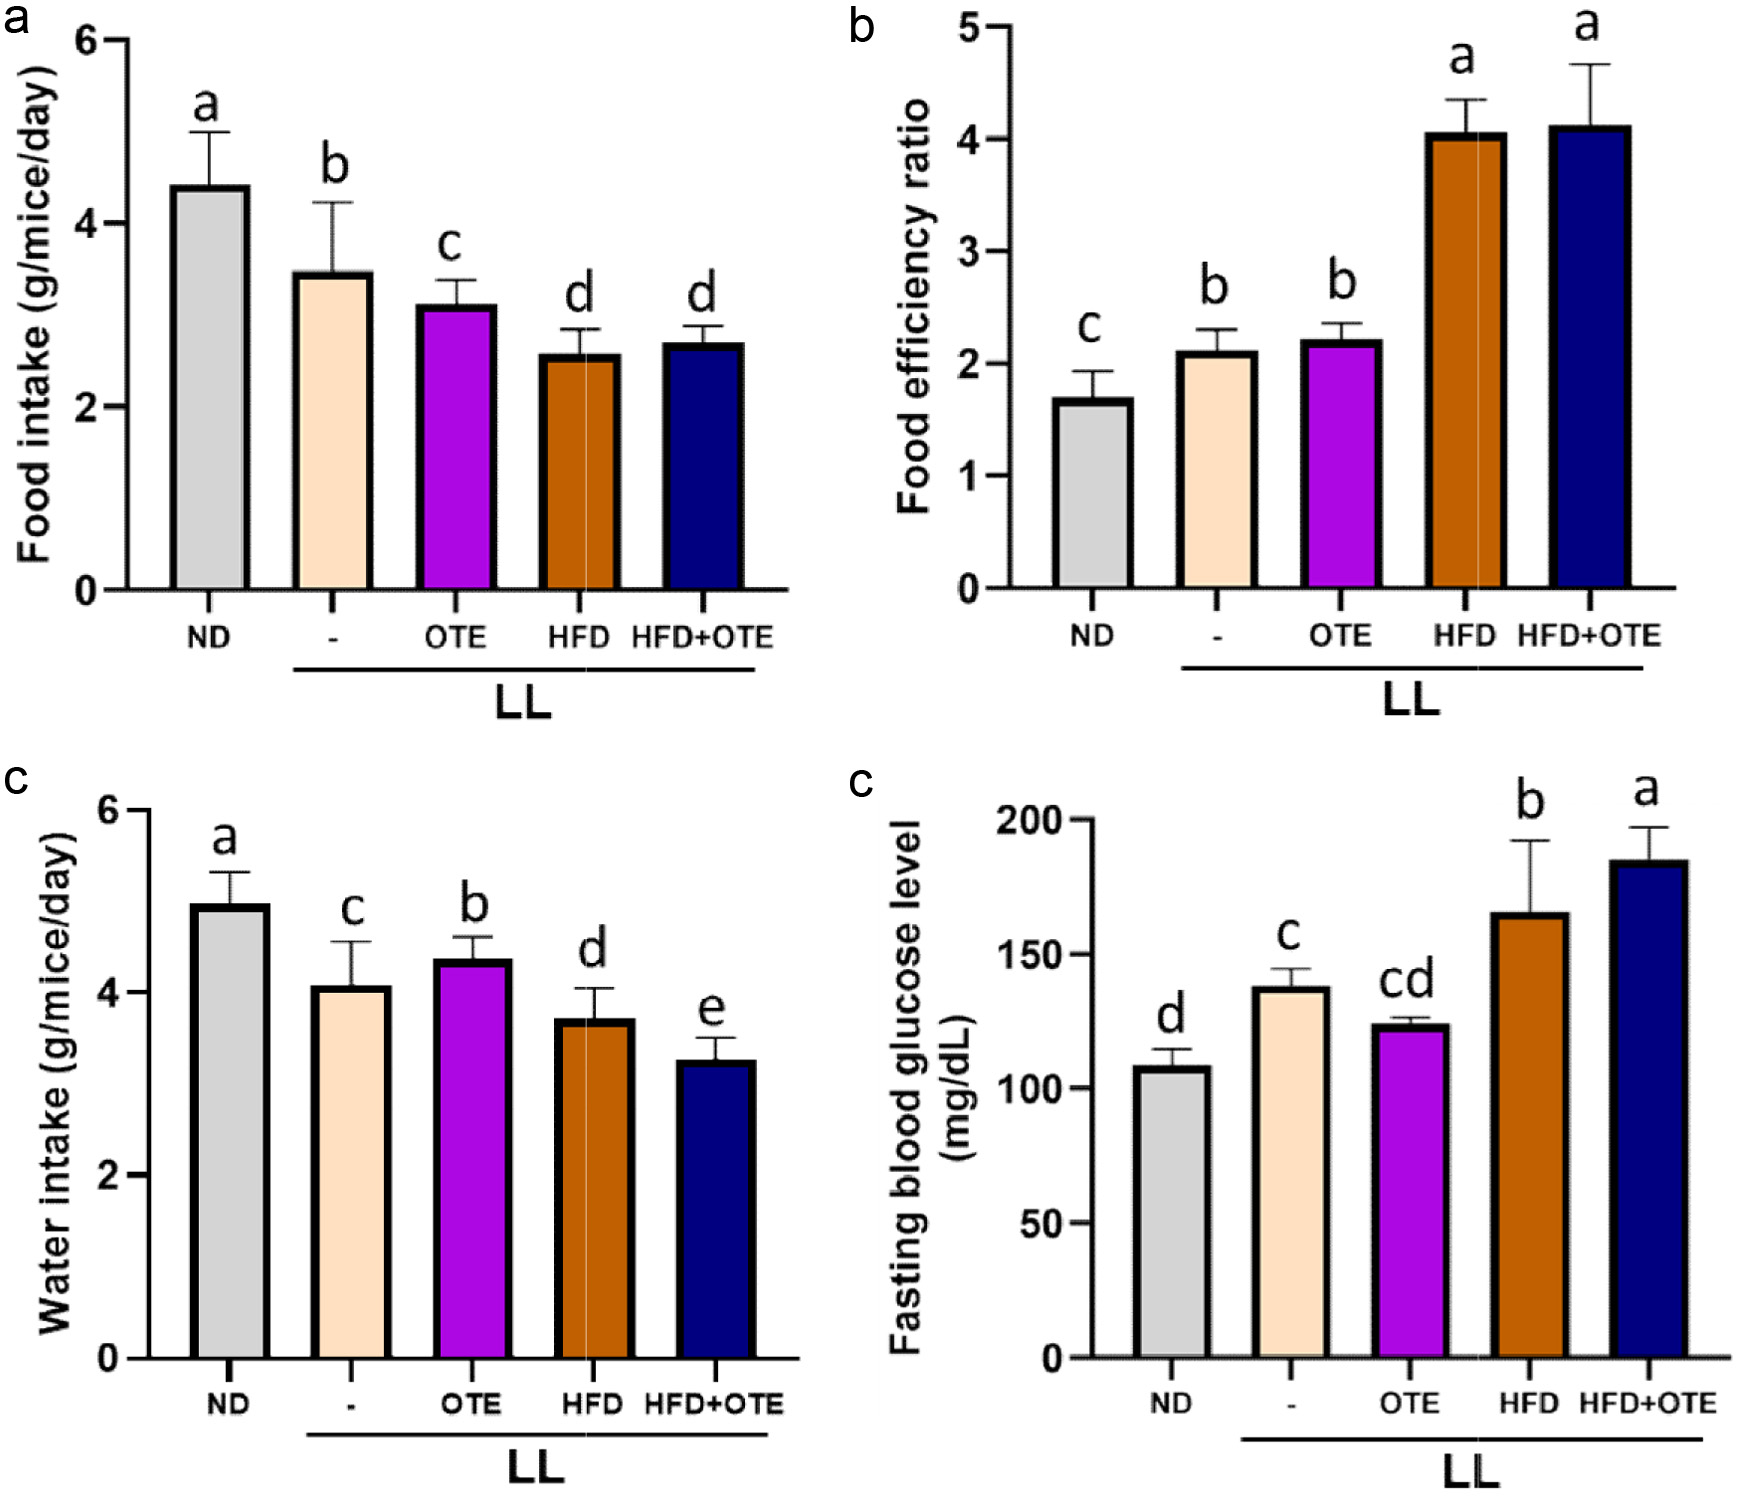 Click for large image | Figure 3. Effect of OTE on food intake, food efficiency, and water consumption in mice under constant light conditions. (a) Food intake, (b) food efficiency ratio, (c) water intake and (d) fasting blood glucose level (N = 8). Different lowercase letters indicate a significant difference among the groups, as determined by ANOVA followed by Duncan’s post hoc test. |
Water consumption was ranked from highest to lowest as follows: ND (4.98 ± 0.34 g), LL + OTE (4.37 ± 0.24 g), LL (4.10 ± 0.47 g), LL + HFD (3.72 ± 0.33 g), and LL + HFD + OTE (3.27 ± 0.24 g), with significant differences observed between all groups (Figure 3c). These results indicate that LL reduces water intake, while LL + OTE slightly increases water consumption. The LL + HFD group showed a further decrease in water intake, and this trend continued after OTE intervention. Since water intake is closely related to metabolic rate, it is suggested that LL may slow down metabolism, and the addition of HFD may further reduce the metabolic rate. Since water intake, metabolism, and blood glucose levels are interrelated, blood glucose levels will be further assessed in this experiment for additional insights.
At the 12th week, blood glucose levels were measured by tail vein blood collection using a glucose meter. The results showed that the LL group had significantly higher blood glucose levels (138.40 ± 6.35 mg/dL) compared to the ND group (108.80 ± 5.93 mg/dL) and the LL + OTE group (124.00 ± 2.65 mg/dL). The LL + HFD group (165.80 ± 26.51 mg/dL) showed an even higher blood glucose level compared to the LL group, while the blood glucose levels of LL + HFD + OTE group (185.00 ± 12.08 mg/dL) suggested that OTE showed no lowering effect under constant light.
3.3. Effect of OTE on adipose tissue weight in C57BL/6 mice under constant light conditions
In terms of adipose tissue weight, no significant differences were observed between the ND, LL, and LL + OTE groups, indicating that LL does not affect adipose accumulation in mice. However, the LL + HFD and LL + HFD + OTE groups showed significant increases in the weight of white adipose tissue (LL + HFD: 1.13 ± 0.40 g; LL + HFD + OTE: 1.25 ± 0.32 g), beige adipose tissue (LL + HFD: 0.46 ± 0.17 g; LL + HFD + OTE: 0.51 ± 0.17 g), and brown adipose tissue (LL + HFD: 0.08 ± 0.01 g; LL + HFD + OTE: 0.10 ± 0.02 g) compared to the previous groups, with the weight of white adipose tissue being more than twice that of the ND group (Figure 4a–d). These results suggest that under LL + HFD conditions, OTE does not improve lipid accumulation in the various adipose tissues.
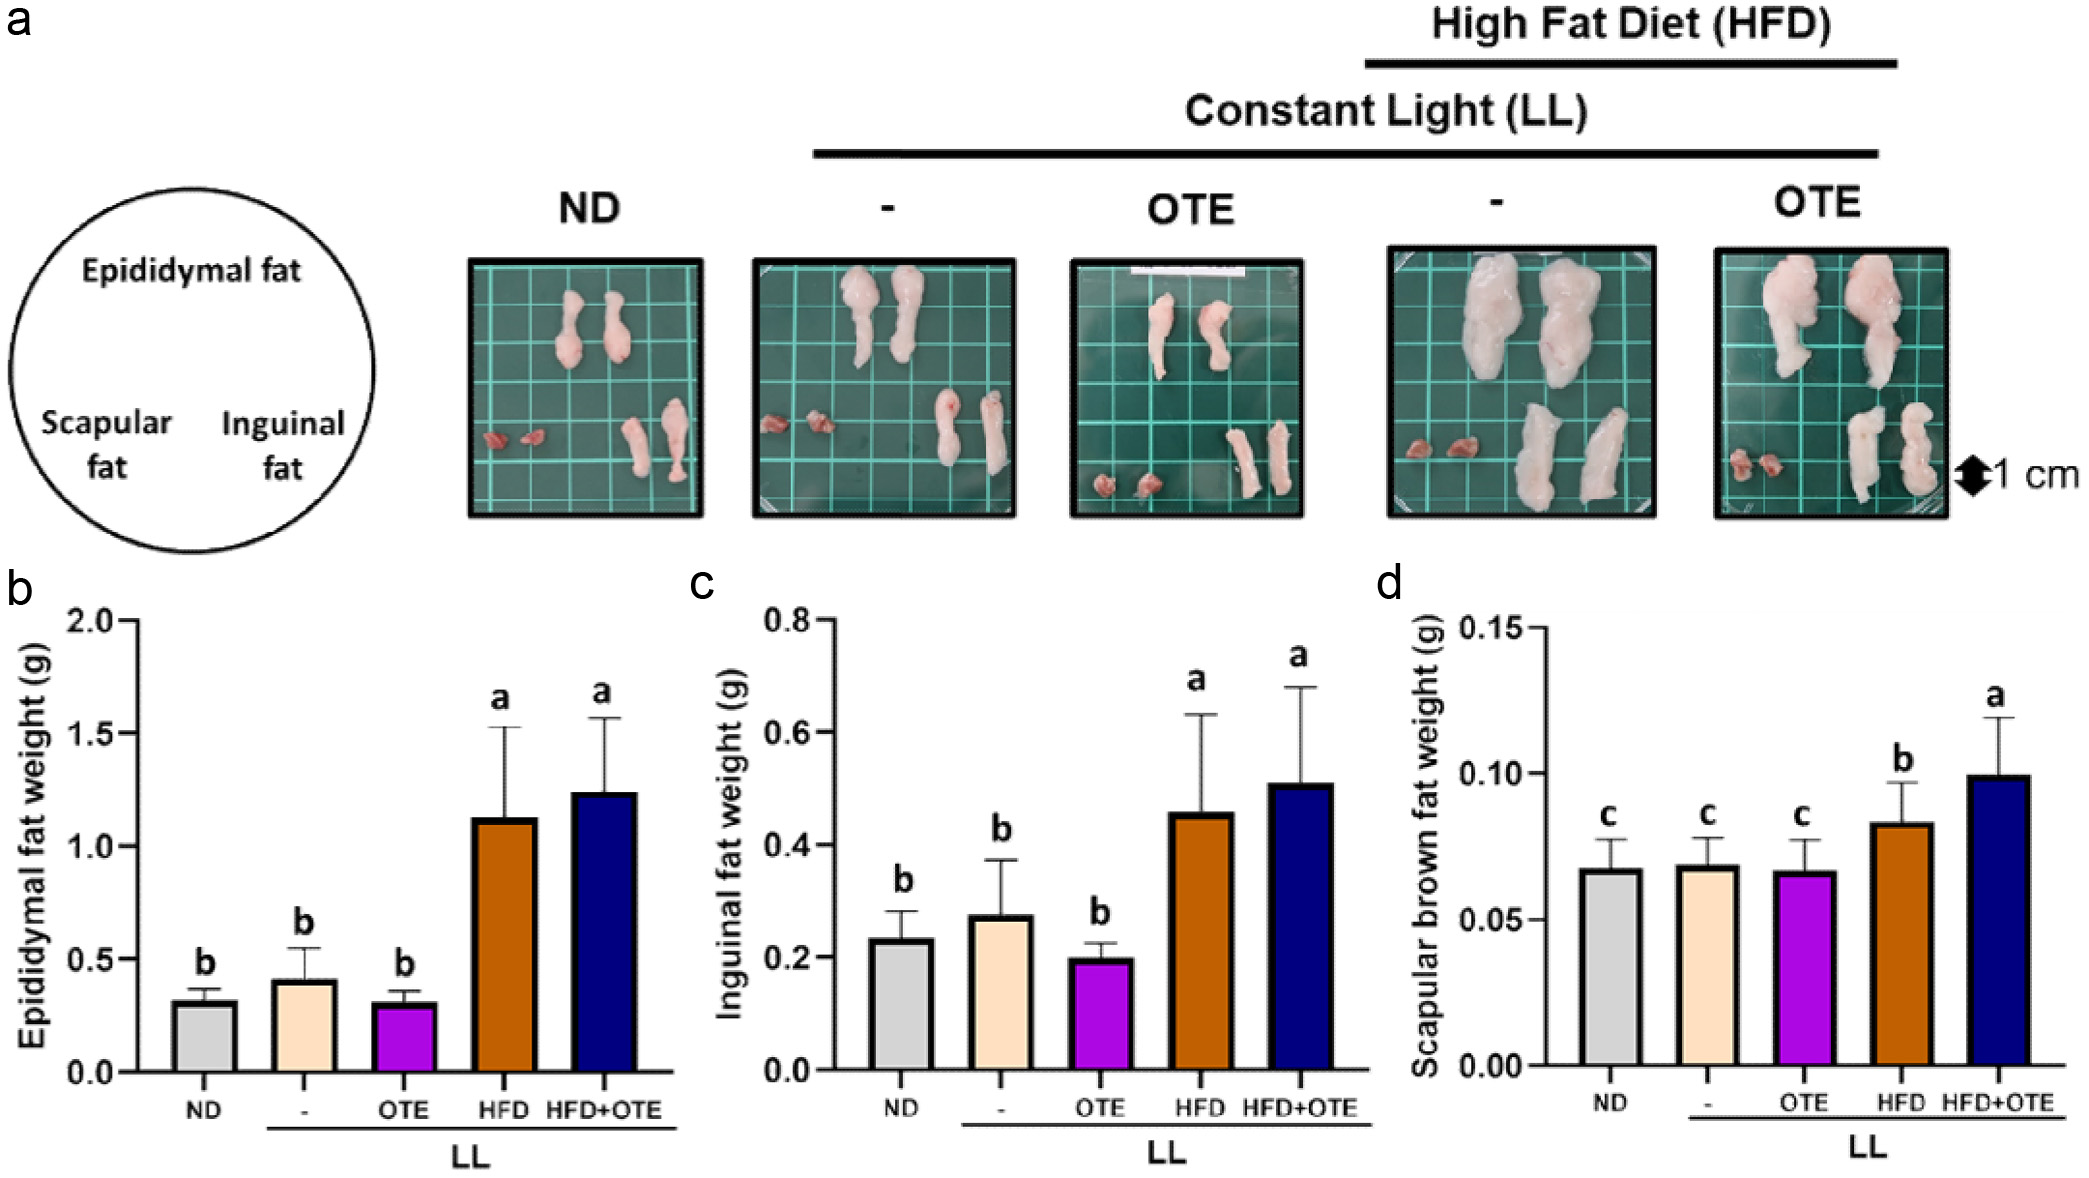 Click for large image | Figure 4. Effect of OTE on adipose tissue weight in C57BL/6 mice under constant light conditions. (a) Representative images of three type of adipose tissues. The average weights of (b) epididymal fat, (c) inguinal fat and (d) scapular fat (N = 8). Different lowercase letters indicate a significant difference among the groups, as determined by ANOVA followed by Duncan’s post hoc test. |
In the white adipose tissue of the epididymis, similar to the ND group, the fat cell size in the LL and LL + OTE groups mostly falls within the 500–1,000 µm2 (LL: 27.80 ± 6.89%; LL + OTE: 34.39 ± 6.54%) and 1,000–2,000 µm2 (LL: 41.80 ± 2.93%; LL + OTE: 42.93 ± 6.37%) size ranges, and the overall trend is also similar to that of the ND group. In contrast, the LL + HFD and LL + HFD + OTE groups predominantly fall within the 2,000–4,000 µm2 (LL + HFD: 36.58 ± 7.29%; LL + HFD + OTE: 35.54 ± 7.11%) and 4,000–8,000 µm2 (LL + HFD: 25.12 ± 7.92%; LL + HFD + OTE: 27.43 ± 7.29%) size ranges, showing a significant shift to the right compared to the ND group (Figure 5a and c, Table 1).
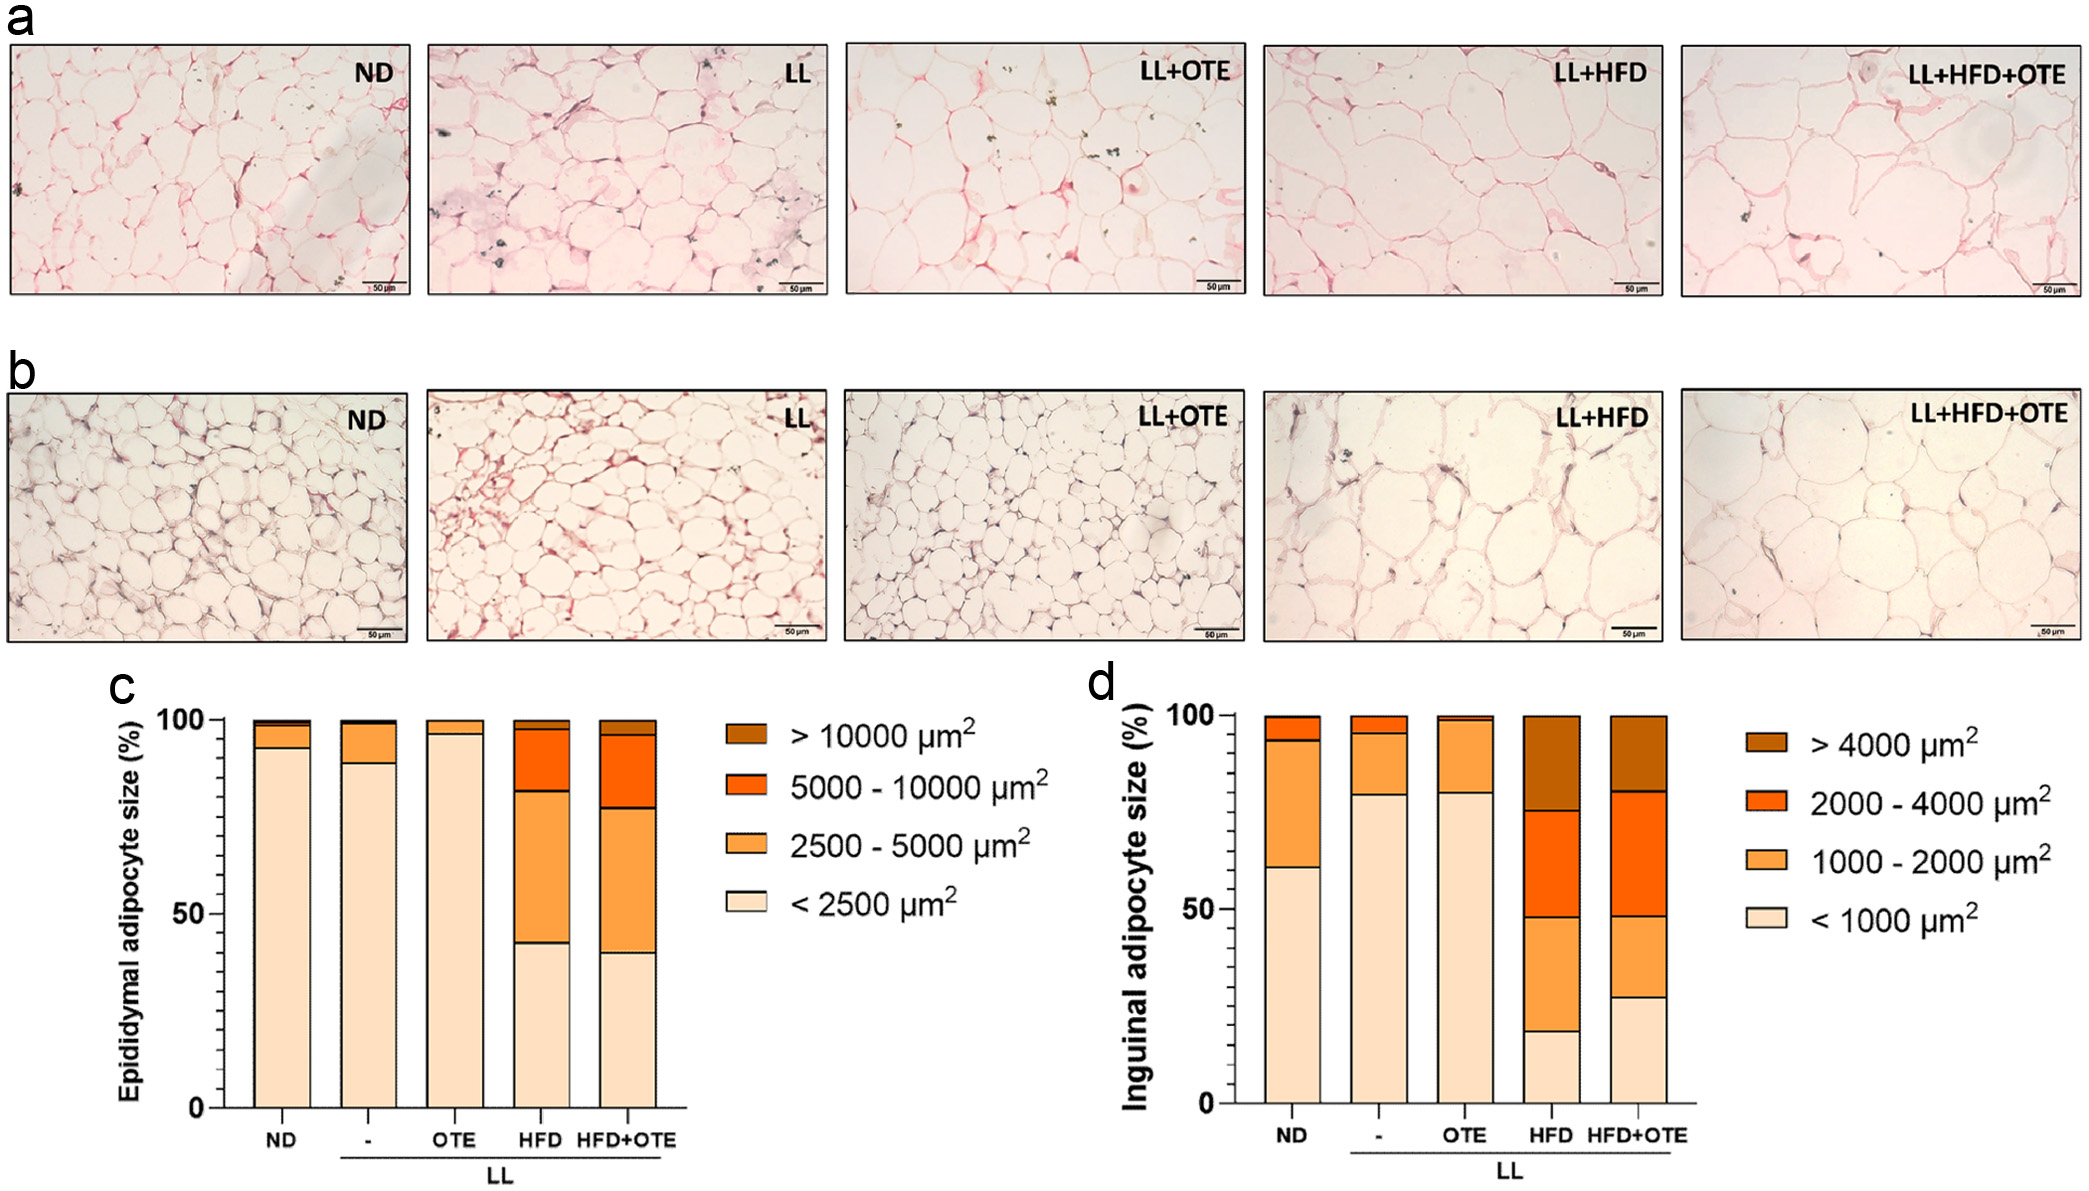 Click for large image | Figure 5. Histological analysis of adipose tissues in C57BL/6 mice under HFD feeding and constant light conditions. (a) Representative images of H&E stained epididymal fat and (b) inguinal fat under 400x magnification. (c) Size distribution of adipocytes in epididymal fat and (d) inguinal fat. At least four independent replications were conducted. |
 Click to view | Table 1. The adipocyte size distribution in epididymal adipose tissue |
The trend in the inguinal beige adipose tissue is similar to the above. In the LL and LL + OTE groups, most of the adipocytes fall within the < 500 µm2 (LL: 35.69 ± 12.07%; LL + OTE: 35.76 ± 12.51%) and 500–1,000 µm2 (LL: 44.05 ± 10.54%; LL + OTE: 44.54 ± 7.14%) size ranges, with the peak at 500–1,000 µm2. In contrast, the LL + HFD and LL + HFD + OTE groups primarily fall within the 2,000–4,000 µm2 (LL + HFD: 27.46 ± 10.14%; LL + HFD + OTE: 32.07 ± 9.44%) and > 4,000 µm2 (LL + HFD: 24.34 ± 18.68%; LL + HFD + OTE: 19.38 ± 13.22%) size ranges, with the peak at 2,000–4,000 µm2 (Figure 5b and d, Table 2). These results indicate that LL + HFD significantly promotes the accumulation of white adipose tissue in the epididymis and beige adipose tissue in the inguinal region, while the intervention with OTE fails to improve this effect.
Click to view | Table 2. The adipocyte size distribution in inguinal adipose tissue. |
3.4. The effect of OTE on the organ appearance and weight of c57bl/6 mice under constant light conditions
Regarding liver appearance, mice in the ND group, LL group, and LL + OTE group had bright red, firm livers with sharp edges. In contrast, the livers from the LL + HFD and LL + HFD + OTE groups were notably paler and yellowish compared to the ND group, with visible enlargement, and the liver lobes appeared swollen. The surface had a greasy feel, and the edges were rounded, suggesting signs of fatty liver (Figure 6a), indicating that OTE did not prevent fatty liver formation in the LL + HFD condition. No significant differences in the appearance of the kidneys and spleen were found between the groups.
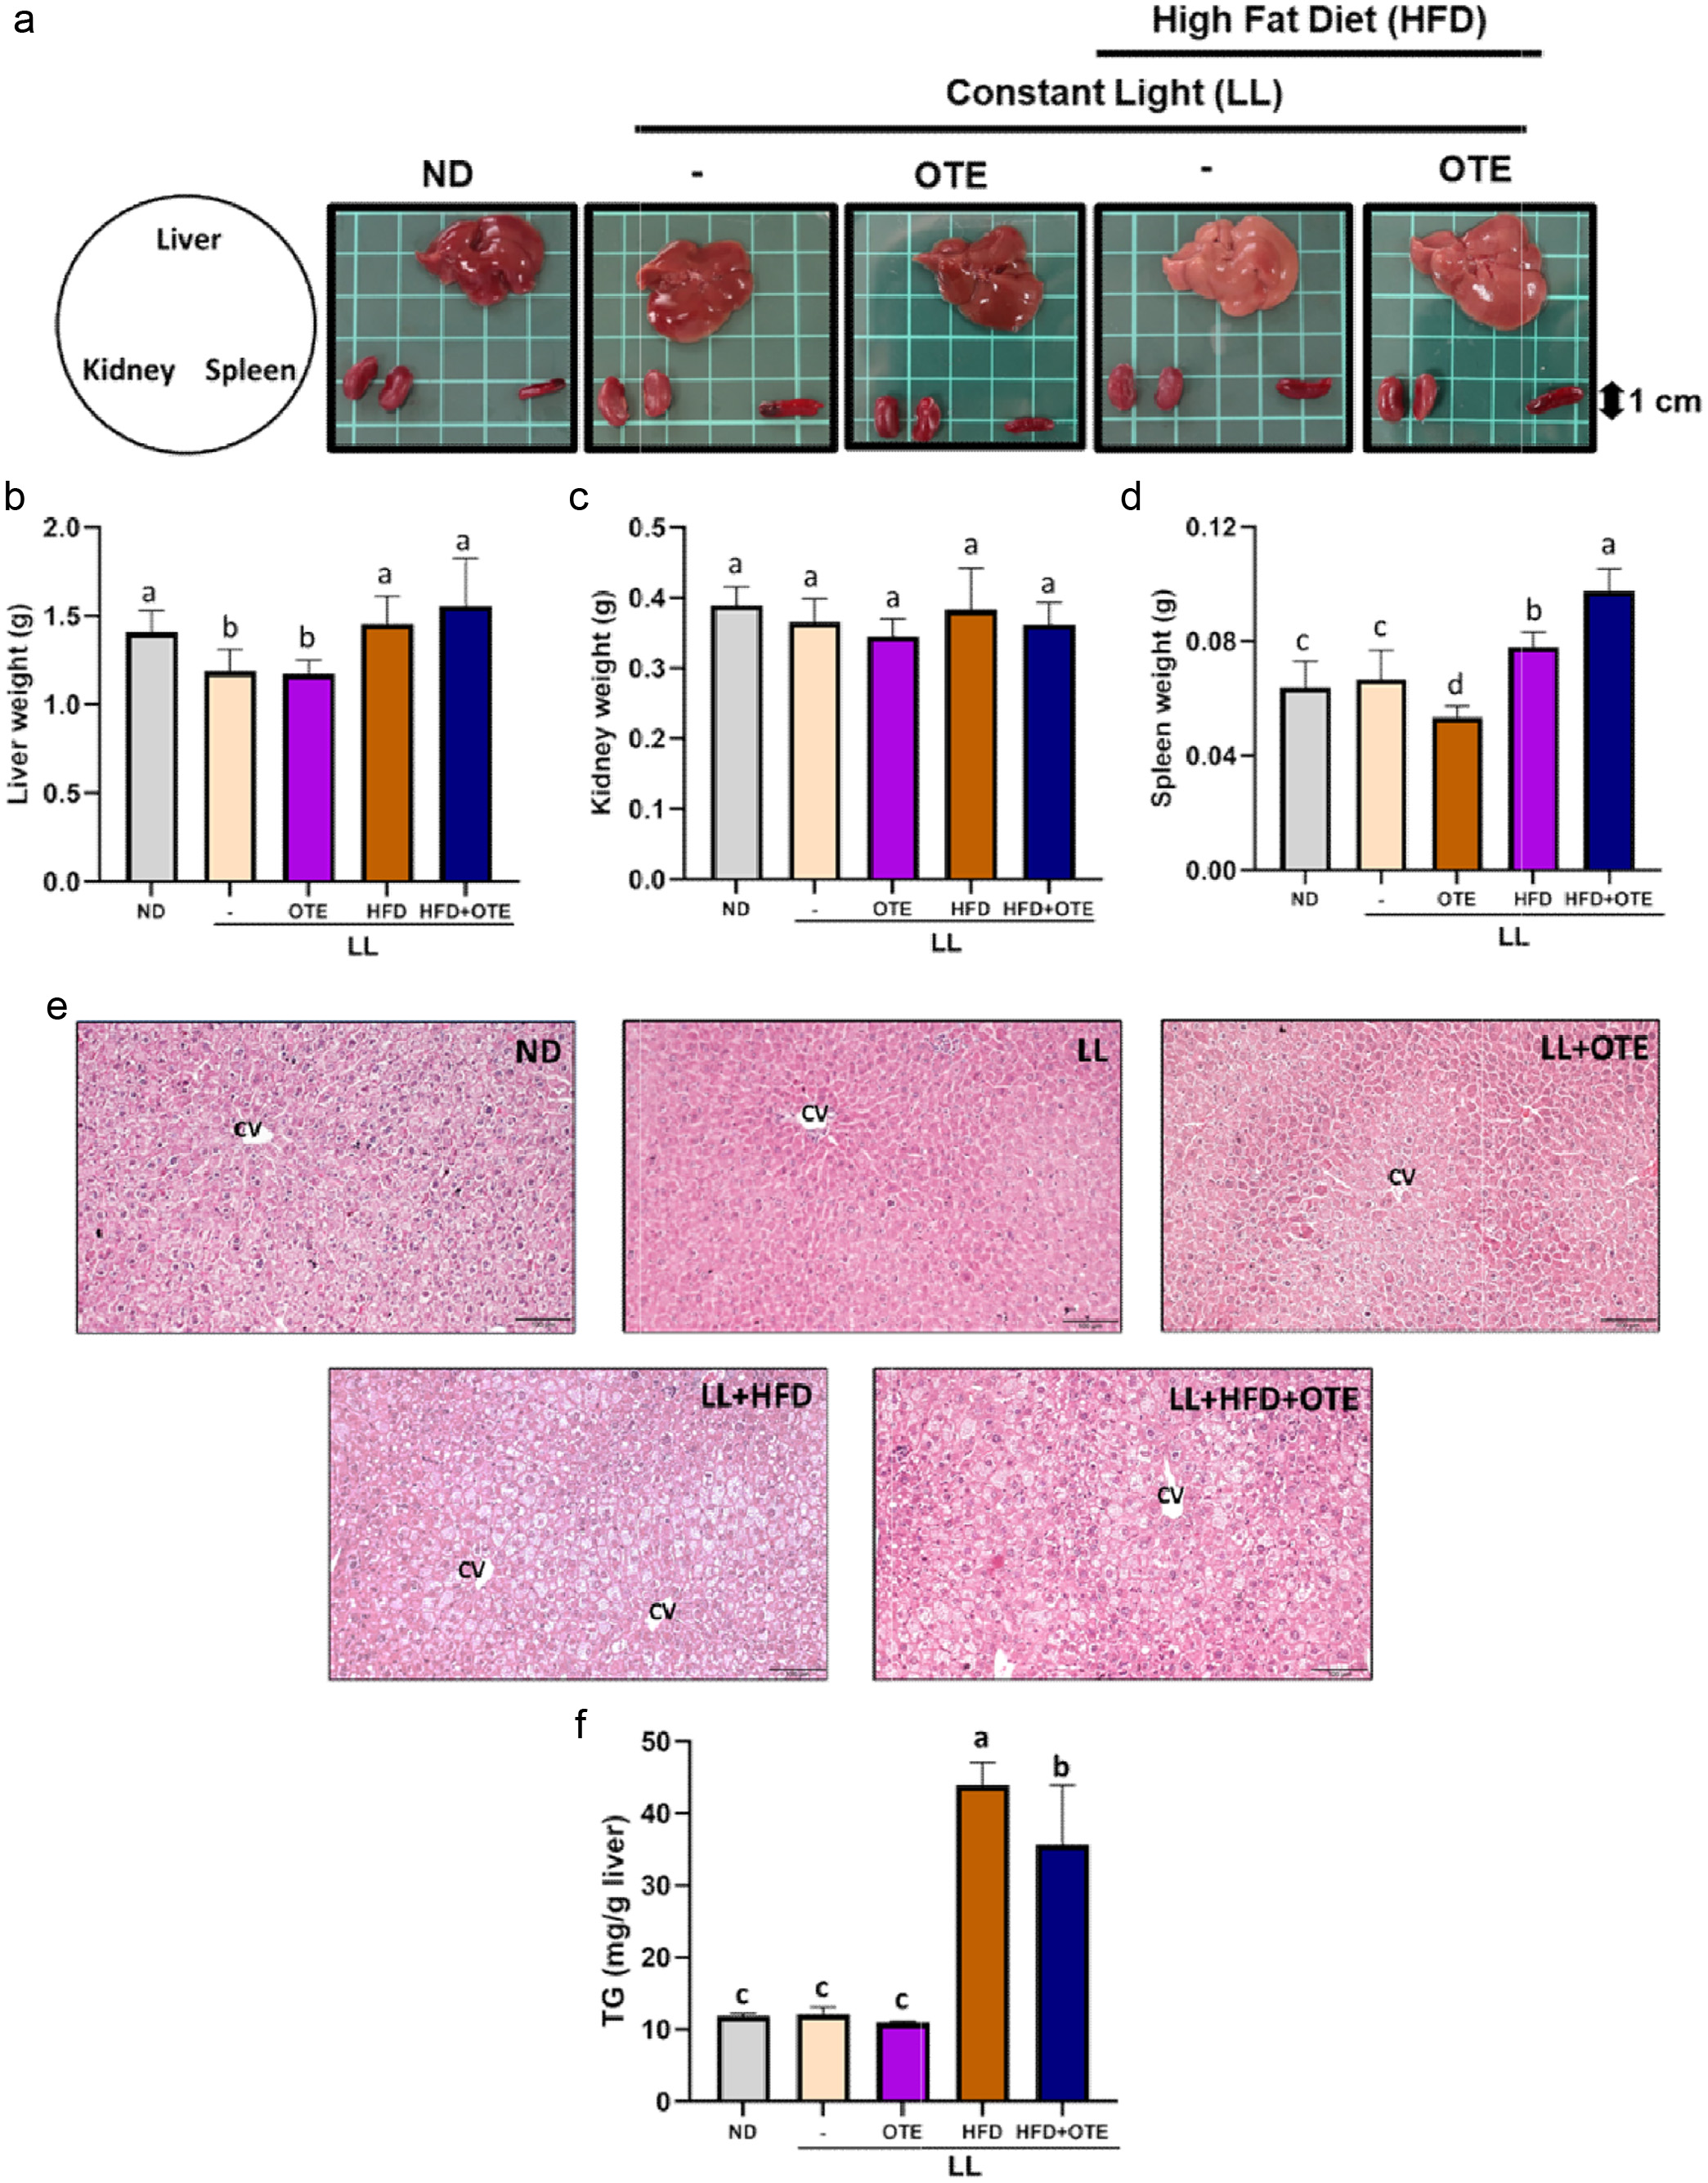 Click for large image | Figure 6. The effect of OTE on the organ appearance and weight of c57bl/6 mice under constant light conditions. (a) The representative images of liver, kidney and spleen of each group. The average weight of (b) livers, (c) kidneys and (d) spleens (N = 8). (e) Representative images of H&E-stained liver sections. (f) The hepatic TG levels. Different lowercase letters indicate a significant difference among the groups, as determined by ANOVA followed by Duncan’s post hoc test. |
No significant differences in kidney weight were observed between the groups. However, for liver weight, the LL + HFD group (1.53 ± 0.11 g) and the LL + HFD + OTE group (1.60 ± 0.10 g) had significantly higher liver weights than the ND group (1.42 ± 0.10 g), while the LL group (1.27 ± 0.06 g) and the LL + OTE group (1.19 ± 0.03 g) had significantly lower liver weights. When the liver weight was normalized to body weight, no significant differences in liver-to-body weight ratio were found across the groups. Regarding spleen weight, the LL + OTE group (0.053 ± 0.004 g) had a significantly lower spleen weight than the ND group (0.064 ± 0.009 g), while the LL + HFD group (0.078 ± 0.005 g) had a significantly higher spleen weight than the ND group (Figure 6d). However, OTE supplementation showed no positive effect on organ weight change caused by LL and HFD.
Upon examining the liver tissue under 100x magnification, it was observed that the liver sections of the LL + HFD and LL + HFD + OTE groups contained a greater number of fat vacuoles, which appeared white under the microscope, indicating more severe fatty infiltration. In contrast, the liver sections of the ND, LL, and LL + OTE groups had fewer fat vacuoles (Figure 6e), suggesting that LL and LL + OTE did not induce fatty liver formation. Further analysis using a TG kit revealed that the liver triglyceride (TG) content in the LL + HFD + OTE group (35.69 ± 8.19 mg/g) was significantly lower than that of the LL + HFD group (43.91 ± 3.10 mg/g), but still significantly higher than the ND (11.86 ± 0.35 mg/g), LL (12.10 ± 0.98 mg/g), and LL + OTE (10.97 ± 0.18 mg/g) groups (Figure 6f).
3.5. Impact of LL and OTE on liver fatty acid synthesis-related protein expression
To further investigate the potential fatty liver concerns raised by the pale-yellow liver appearance in the LL + HFD and LL + HFD + OTE groups, we examined the expression levels of liver fatty acid synthesis-related proteins. The results for protein expression related to liver fatty acid synthesis showed that the p-AMPK/AMPK ratio in the LL, LL + HFD, and LL + HFD + OTE groups was approximately 0.65 times that of the ND group, with a statistically significant difference. In contrast, the LL + OTE group was closer to the ND group and showed a 1.39-fold increase compared to the LL group (Figure 7a, b), although the difference was not statistically significant due to individual variability. These results suggest that LL, LL + HFD, and LL + HFD + OTE all inhibit AMPK phosphorylation, but the intervention with OTE in the LL group can reduce AMPK phosphorylation, whereas in the LL + HFD group, OTE does not have an inhibitory effect. For downstream proteins, no statistically significant differences were observed in the expression of SREBP-1c due to large within-group variability, although there was a trend of increased expression in the LL group compared to the ND group, while the other groups showed a slight decrease (Figure 7c). Further analysis of downstream proteins revealed that the p-ACC/ACC ratio in the LL group was only half of that in the ND group, with a statistically significant difference. Intervention with OTE led to a certain degree of increase in the p-ACC/ACC ratio. However, no statistically significant differences were found between the LL + HFD and LL + HFD + OTE groups, due to substantial within-group variability (Figure 7d). Similarly, the expression of FASN protein also showed no significant differences due to large within-group variability, but there was a trend of decreased expression in the groups treated with OTE (Figure 7e). In summary, while LL inhibits AMPK phosphorylation, it does not appear to significantly alter the expression of downstream proteins such as SREBP-1c, ACC, and FASN. Therefore, LL alone does not induce noticeable changes in liver fatty acid metabolism or metabolic syndrome symptoms. Besides, it is observed significant changes in the expression of PPARα. Both the LL and LL + OTE groups showed a significant decrease in PPARα expression compared to the ND group. Furthermore, the LL + HFD and LL + HFD + OTE groups exhibited even lower levels of PPARα expression, which was approximately half of the expression observed in the ND group. Notably, regardless of whether the mice were exposed to LL or LL + HFD conditions, the intervention with OTE did not result in significant improvements (Figure 7f). These findings suggest that LL + HFD may inhibit the overall metabolic activity of the liver, leading to the suppression of PPARα expression. The lack of a significant effect from OTE intervention further supports the idea that LL + HFD may primarily impair liver metabolism, without a substantial recovery from the OTE intervention.
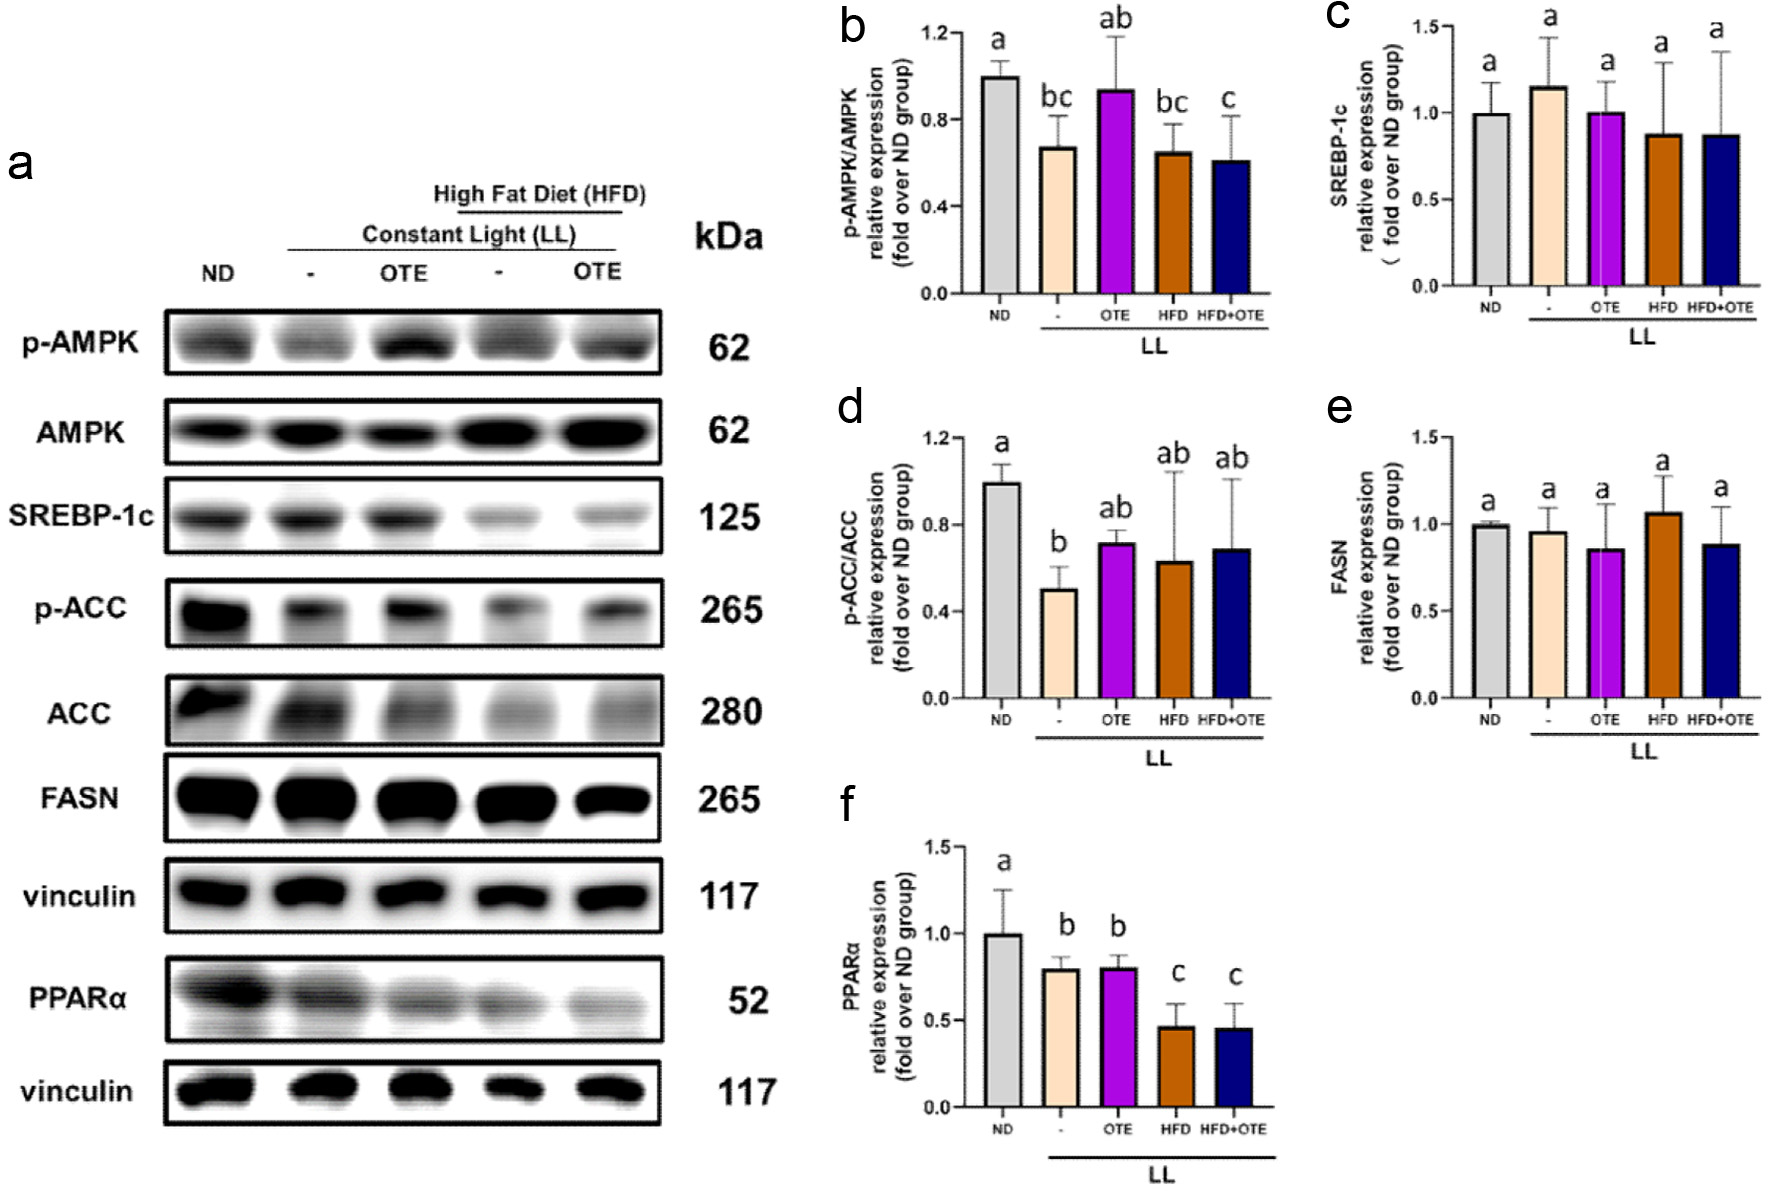 Click for large image | Figure 7. Impact of LL and OTE on liver fatty acid synthesis-related protein expression. (a) The representative images of western blots and the protein expression quantifications of (b) p-AMPK/AMPK, (c) SREBP-1c, (d) p-ACC/ACC, (e) FASN, and (f) PPARα. Different lowercase letters indicate a significant difference among the groups, as determined by ANOVA followed by Duncan’s post hoc test. At least three independent replications were conducted. |
| 4. Discussion | ▴Top |
The purpose of this experiment was to investigate the effects of Oolong Tea Extract (OTE) on the metabolic and adiposity changes in C57BL/6 mice under high-fat diet (HFD) and constant light (LL) conditions. The study aimed to evaluate the potential of OTE in modulating body weight, adipose tissue distribution, and liver fat accumulation under these conditions. The results showed that OTE did not significantly alter body weight or fat mass in mice under HFD and LL conditions, although it did slightly reduce liver triglyceride (TG) content. Histological analysis revealed significant changes in adipocyte size in both epididymal and inguinal fat under the experimental conditions. Furthermore, OTE intervention did not notably improve the observed adiposity or liver fat infiltration in the HFD + LL group, suggesting that while OTE may exert some effect on lipid metabolism, its impact on obesity-related parameters under these specific experimental conditions was limited. These findings will be further explored to understand the underlying mechanisms and the role of bioactive compounds in modulating metabolic dysfunctions associated with obesity.
Previous studies have shown that constant light (LL) does not lead to weight gain in mice, but feeding a high-fat diet (HFD) results in significant weight gain (Wei et al., 2020). Moreover, the weight of mice exposed to LL + HFD is heavier than those fed HFD alone, which is consistent with our findings. Other studies have indicated that in a constant light environment, light intensity is a factor determining whether mice become obese (Fan et al., 2022). A weaker constant light environment is not sufficient to induce obesity in mice, but regardless of light intensity, the combination of LL and HFD can significantly increase body weight and induce noticeable obesity symptoms. Since our experimental environment used standard incandescent lighting with insufficient light intensity, and mice tend to bury their heads in bedding to avoid light during rest, we speculate that LL in our study was not intense enough to cause sleep deprivation in mice, thus potentially weakening its effect on obesity and insufficient to impact body weight. However, the combined influence of LL and HFD increased body weight in the mice. Additionally, no effects of OTE on mouse appearance or body weight were observed, regardless of whether the mice were treated with LL or LL + HFD.
Previous studies have suggested that mice exhibit variable responses to LL, with some showing suppressed behavior rhythms and others experiencing extended activity cycles. In general, food intake in LL mice tends to be lower than in ND mice, but this does not affect body weight. This finding aligns with our experimental results, suggesting that LL may slow down metabolism and reduce energy expenditure, thus decreasing the demand for food. The reduced food intake may enhance food absorption and increase food efficiency (Schilperoort et al., 2020)
Past studies have shown that ClockΔ19 mutant mice (a circadian rhythm mutant mouse) exhibit significantly larger adipose tissue mass and size compared to standard mice. It has been suggested that fat breakdown also follows a circadian rhythm, and the loss of this rhythm leads to a reduced rate of fat breakdown. Since LL (constant light) also suppresses the expression of circadian rhythm genes, it is hypothesized that while LL can alter the endogenous rhythm in mice, the effect is not as drastic as in ClockΔ19 mutant mice, where the circadian rhythm is entirely disrupted. However, when HFD (high-fat diet) is introduced under LL conditions, it exacerbates the disruption of the fat breakdown rhythm. This results in severe interference with the expression of fat breakdown-related proteins, disrupting the mice’s homeostasis and leading to rapid lipid accumulation in adipose tissue, which causes an increase in both adipose tissue weight and size (Shostak et al., 2013).
Previous studies have shown that LL can significantly increase the size of epididymal white adipose tissue (Hong et al., 2020), but these experiments did not specify the light intensity. In this study, no significant increase in white adipose tissue size was observed, suggesting that the light intensity may have been insufficient, and therefore, the mice under LL conditions did not successfully develop obesity. However, some studies have reported that LL can significantly induce obesity in mice (Coomans et al., 2013), while others have found that LL does not induce obesity in mice (Wei et al., 2020). These studies did not explore the effect of light intensity on mice, so the potential differences in the degree of obesity in mice under LL conditions with varying light intensities remain to be further investigated.
Since the liver and spleen weights of the LL + HFD + OTE group were higher than those of the LL + HFD group, it was hypothesized that OTE might have a protective effect against fatty liver under HFD feeding conditions (Figure 6). However, under LL + HFD conditions, the intervention of OTE might have an adverse effect, leading to liver inflammation, which in turn could cause an increase in spleen weight. This experiment did not include a concentration gradient of OTE, so it is unclear whether the concentration of OTE used under LL conditions was too high or too low. Previous studies have pointed out that LL can increase liver inflammation scores and slightly increase NAFLD activity scores (NAFLD activity score), but it does not significantly increase the steatosis score (fatty degeneration) (Wei et al., 2020). Based on the results of this experiment, it is speculated that the impact of LL on liver fat is primarily related to inflammatory responses, without causing a significant increase in fat content.
Our results shows that LL and LL + OTE do not cause significant changes in liver TG levels, but LL + HFD increases the liver TG concentration. In this context, OTE intervention can slightly reduce the accumulation of TG, but it still does not fully resolve the fatty infiltration or fatty liver symptoms. Previous studies have also shown that LL does not induce fatty infiltration in the liver, while HFD significantly increases fat vacuoles. In the LL + HFD group, liver fat degeneration and inflammatory infiltration further worsen, which is consistent with the findings of this study (Wei et al., 2020). Earlier research has suggested that LL disrupts the function of the SCN (suprachiasmatic nucleus), leading to hormonal imbalances that affect liver circadian rhythms (Rumanova et al., 2020). It is hypothesized that the liver rhythm disturbance caused by LL in this study is relatively mild, likely only inducing slight inflammatory responses. Furthermore, the liver possesses intrinsic metabolic regulatory mechanisms to cope with external influences, which may prevent LL alone from causing fatty liver. However, in the LL + HFD model, the HFD causes liver fat infiltration, leading to fatty liver. Since LL can slightly enhance liver inflammation indicators, as noted in previous studies (Wei et al., 2020), it could accelerate the fatty infiltration process, resulting in a significant increase in liver TG levels and larger fat vacuoles.
In previous studies, it has been suggested that the TG observed in the liver of HFD mice may result from re-esterification of dietary fats rather than de novo lipogenesis (Duarte et al., 2014). Based on the results from the LL + HFD group, it is hypothesized that LL may promote the absorption of fats in the intestine, where they bind to proteins and enter the bloodstream as chylomicrons, which are then taken up by the liver and fat tissues. This effect is more prominent in the HFD group, where higher fat content leads to an increased absorption of lipids into the liver under the influence of LL. Since this process does not involve the lipid biosynthesis pathway, proteins related to lipid biosynthesis were not significantly affected. Previous literature has shown that when C57BL/6 mice are placed in a constant dark environment and fasted, the expression of SREBP-1 protein and RNA is significantly suppressed, suggesting that the expression of SREBP-1 is related to feeding time. When the natural circadian rhythm is disrupted, feeding time can take over as the primary regulator of liver rhythm (Matsumoto et al., 2010). This leads to the hypothesis that LL may cause sleep deprivation in mice, disrupting their circadian rhythms and making them rely on feeding time instead of their endogenous circadian rhythm for regulating liver metabolism. However, since no fasting protocol was implemented in this study before sacrificing the mice, the feeding times were not synchronized, which likely resulted in larger intra-group variations in the expression levels of downstream proteins.
Previous studies have shown that LL significantly suppresses the mRNA expression of PPARα in C57BL/6J mice, thereby inhibiting β-oxidation (Yamamuro et al., 2020). Similarly, HFD has also been found to suppress PPARα expression, which in turn inhibits hepatic β-oxidation (Lee et al., 2017). These findings align with the results of the current experiment, where both LL and HFD suppress PPARα expression. Since PPARα is involved in mitochondrial β-oxidation of fatty acids, a reduction in its expression leads to decreased fatty acid oxidation. CPT-1, a key protein involved in fatty acid metabolism, facilitates the transport of fatty acids across the mitochondrial inner membrane into the matrix for further oxidation (Serviddio et al., 2011). Therefore, when LL and HFD are combined, the suppression of PPARα expression likely exacerbates the impairment of fatty acid β-oxidation, resulting in the accumulation of fatty acids in the liver and a significant increase in TG content.
One the other hand, due to the high caffeine level in our sample, the effect of caffeine in our study is discussed. There is evidence suggesting that when an organism is subjected to sleep deprivation, adenosine levels significantly increase (Blanco-Centurion et al., 2006), and the A1 adenosine receptor expression also rises (Basheer et al., 2007). The main ingredient of OTE in this experiment is caffeine, which acts as an adenosine antagonist. Caffeine can bind to adenosine receptors on the cell membrane and compete with adenosine for receptor binding, thereby blocking adenosine signaling (Wu et al., 2017). It is hypothesized that under normal light cycles, caffeine competes with adenosine for receptor binding, and when adenosine receptors are fully occupied, even if adenosine is released by the body, it cannot bind to additional receptors, thus promoting alertness. However, since LL induces a sleep deprivation-like effect in mice, it leads to a significant increase in adenosine and adenosine receptor levels. With more adenosine occupying the receptors, caffeine is unable to bind to the receptors effectively, which could prevent caffeine from exerting its expected effects. This hypothesis is based on indirect evidence, and further experimental validation is needed, such as measuring adenosine levels in the mice.
In summary, constant light did not successfully induce obesity in the mice, but it was observed that food intake and water consumption were significantly reduced, while food conversion efficiency and blood glucose levels were significantly increased. The combination of constant light and high fat diet, however, led to a significant increase in body weight, further worsening the aforementioned indicators. Additionally, the combination of both inducers significantly increased the weight of white, beige, and brown adipose tissues, as well as the size of white and beige adipocytes, while also causing severe hepatic fat infiltration. However, OTE intervention did not lead to any significant improvement in obesity.
| 5. Limitations | ▴Top |
The sample used in this experiment was a GABA oolong tea extract, a complex mixture, making it difficult to determine whether GABA played a primary role in the observed effects. This sample was produced through an anaerobic fermentation process rather than the direct addition of GABA, likely for economic reasons, as large-scale production of this tea variety would otherwise face cost limitations. Furthermore, the extended fermentation period may prolong enzymatic activity, leading to a higher caffeine content in the final product. Besides, our result showed that OTE exhibited significant effect on reducing the activation of JNK and ERK (Figure S1). A previous study suggested that the inhibition of ERK and JNK activation could contribute to the alleviation of hepatic steatosis in rats (Cui et al., 2021). Additionally, since ERK and JNK activation are associated with inflammatory responses (Tang et al., 2023), we believe that the reduced expression of p-ERK/ERK and p-JNK/JNK may partially explain the decrease in hepatic triglyceride levels observed in our study. Therefore, future studies could focus on the JNK and ERK signaling pathways in obesity models. Lastly, to confirm the sample’s effects in this study, a higher dosage should be tested.
| Supplementary material | ▴Top |
Figure S1. Impact of LL and OTE on JNK, ERK and p38. (a) The representative images of western blots and the protein expression quantifications of (b) p-JNK/JNK, (c) p-ERK/ERK, and (d) p-p38/p38. Different lowercase letters indicate a significant difference among the groups, as determined by ANOVA followed by Duncan’s post hoc test. At least three independent replications were conducted.
This work was supported by the National Science and Technology Council, Taiwan, China under Grant [113-2320-B-002-040-MY3], [113-2320-B-002-042-MY3] and [111-2320-B-002-032-MY3].
Ethics approval statement
The animal study was conducted following ethical guidelines and was approved by the Institutional Animal Care and Use Committee of the National Taiwan University with the approval number NTU-109-EL-00147.
Funding
This work was supported by the “National Science and Technology Council” under Grant [113-2320-B-002-040-MY3], [113-2320-B-002-042-MY3] and [111-2320-B-002-032-MY3].
Conflict of interest
The authors declare that they have no known competing financial interests or personal relationships that could have appeared to influence the work reported in this paper.
Author contributions
MH Pan and YC Koh - conceptualization; Sang He and CH Chang-Data curation; MJ Yang-Sample preparation and analysis, YC Koh-Roles/Writing - original draft; C Liu and MH Pan-Writing - review & editing. All authors read and approved the final manuscript.
| References | ▴Top |