Figures
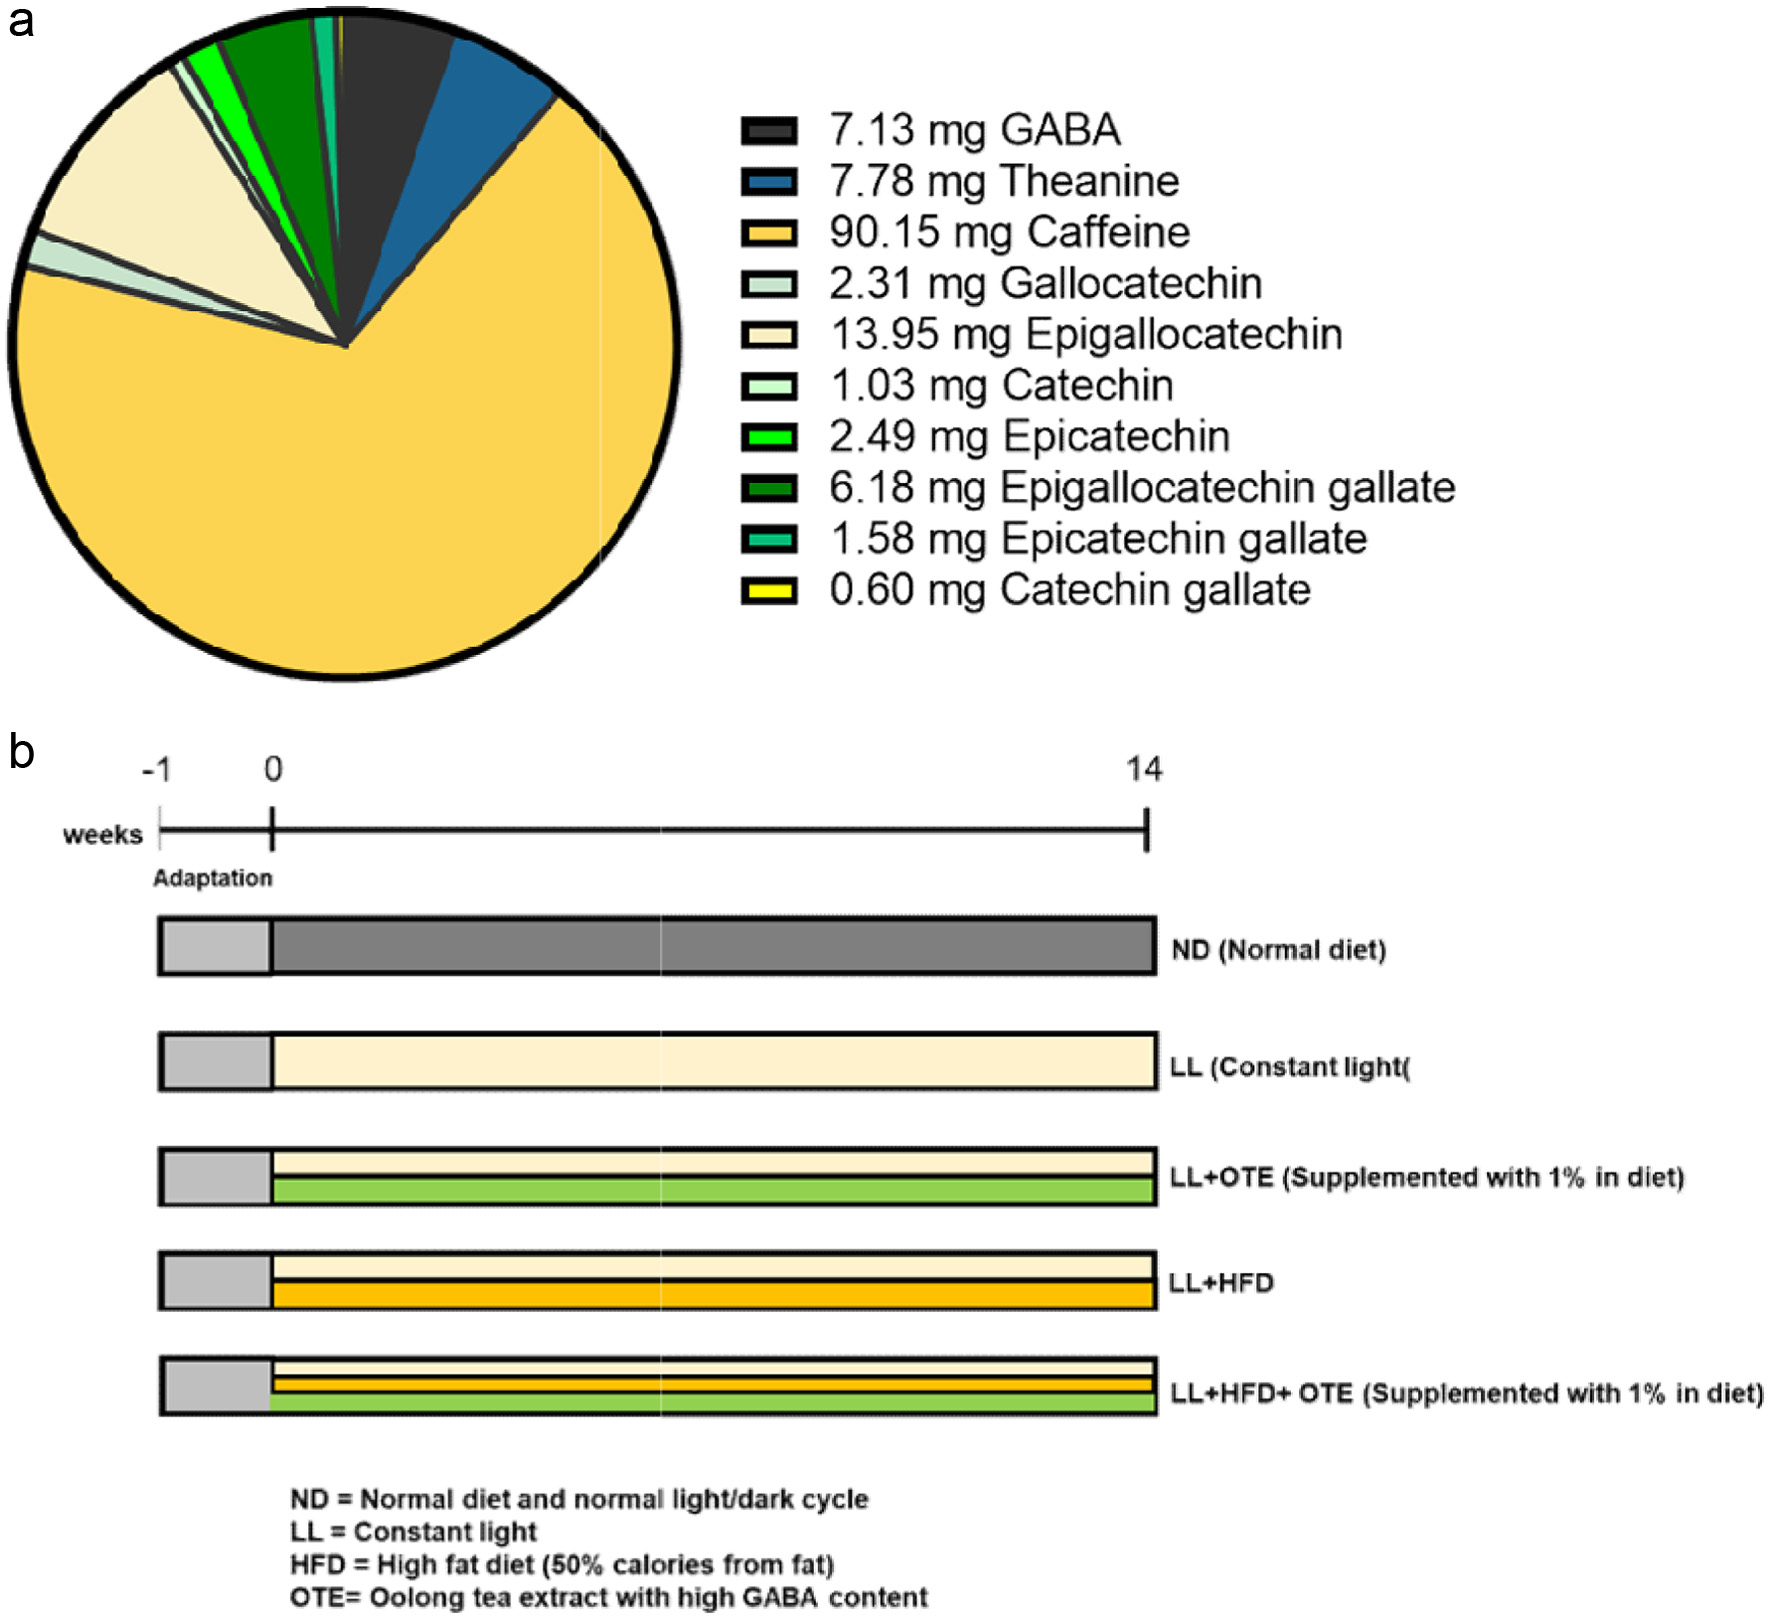
Figure 1. (a) Bioactive compound content per gram of freeze-dried tea extract. (b) Schematic representation of the experimental design. The OTE sample and the amount of bioactive compounds in OTE are based on our previous study (Weerawatanakorn et al., 2023). The chart is reproduced from the same analysis.
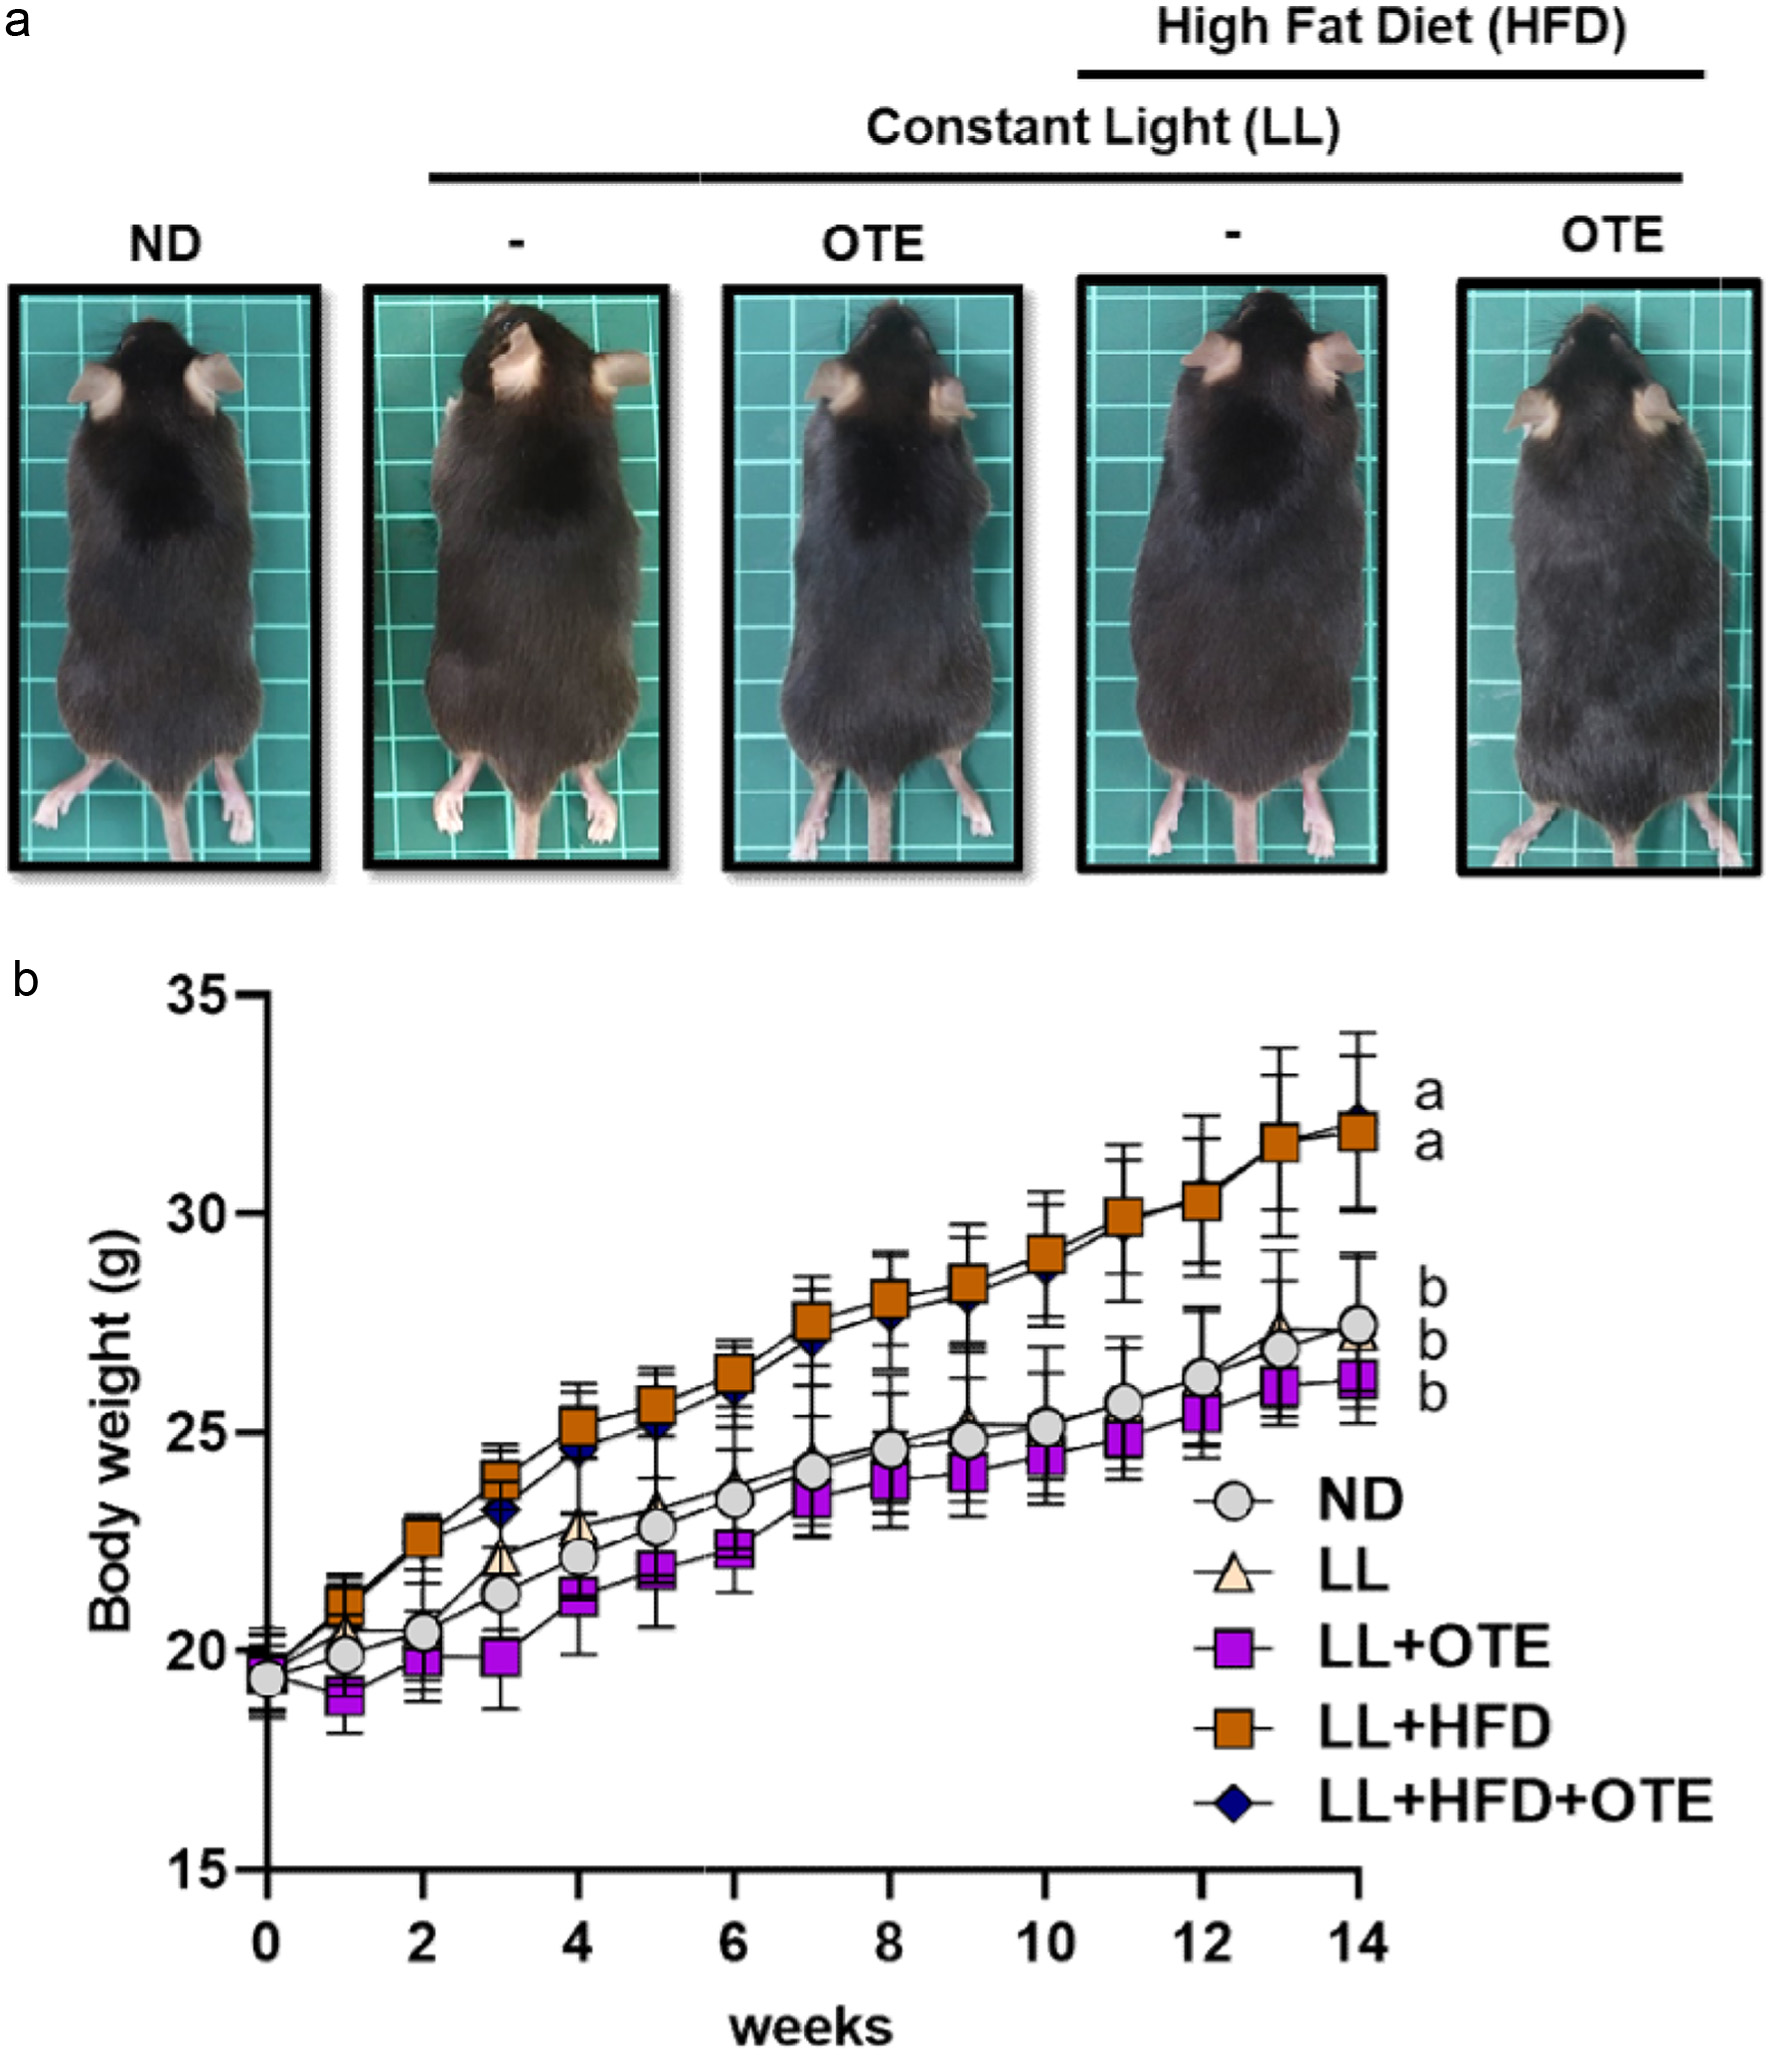
Figure 2. The effect of OTE on the appearance and body weight of C57BL/6 mice under HFD feeding and constant light conditions. (a) Representative images of mice from each group. (b) Body weight changes over 14 weeks (N = 8). Different lowercase letters indicate a significant difference among the groups, as determined by ANOVA followed by Duncan’s post hoc test.
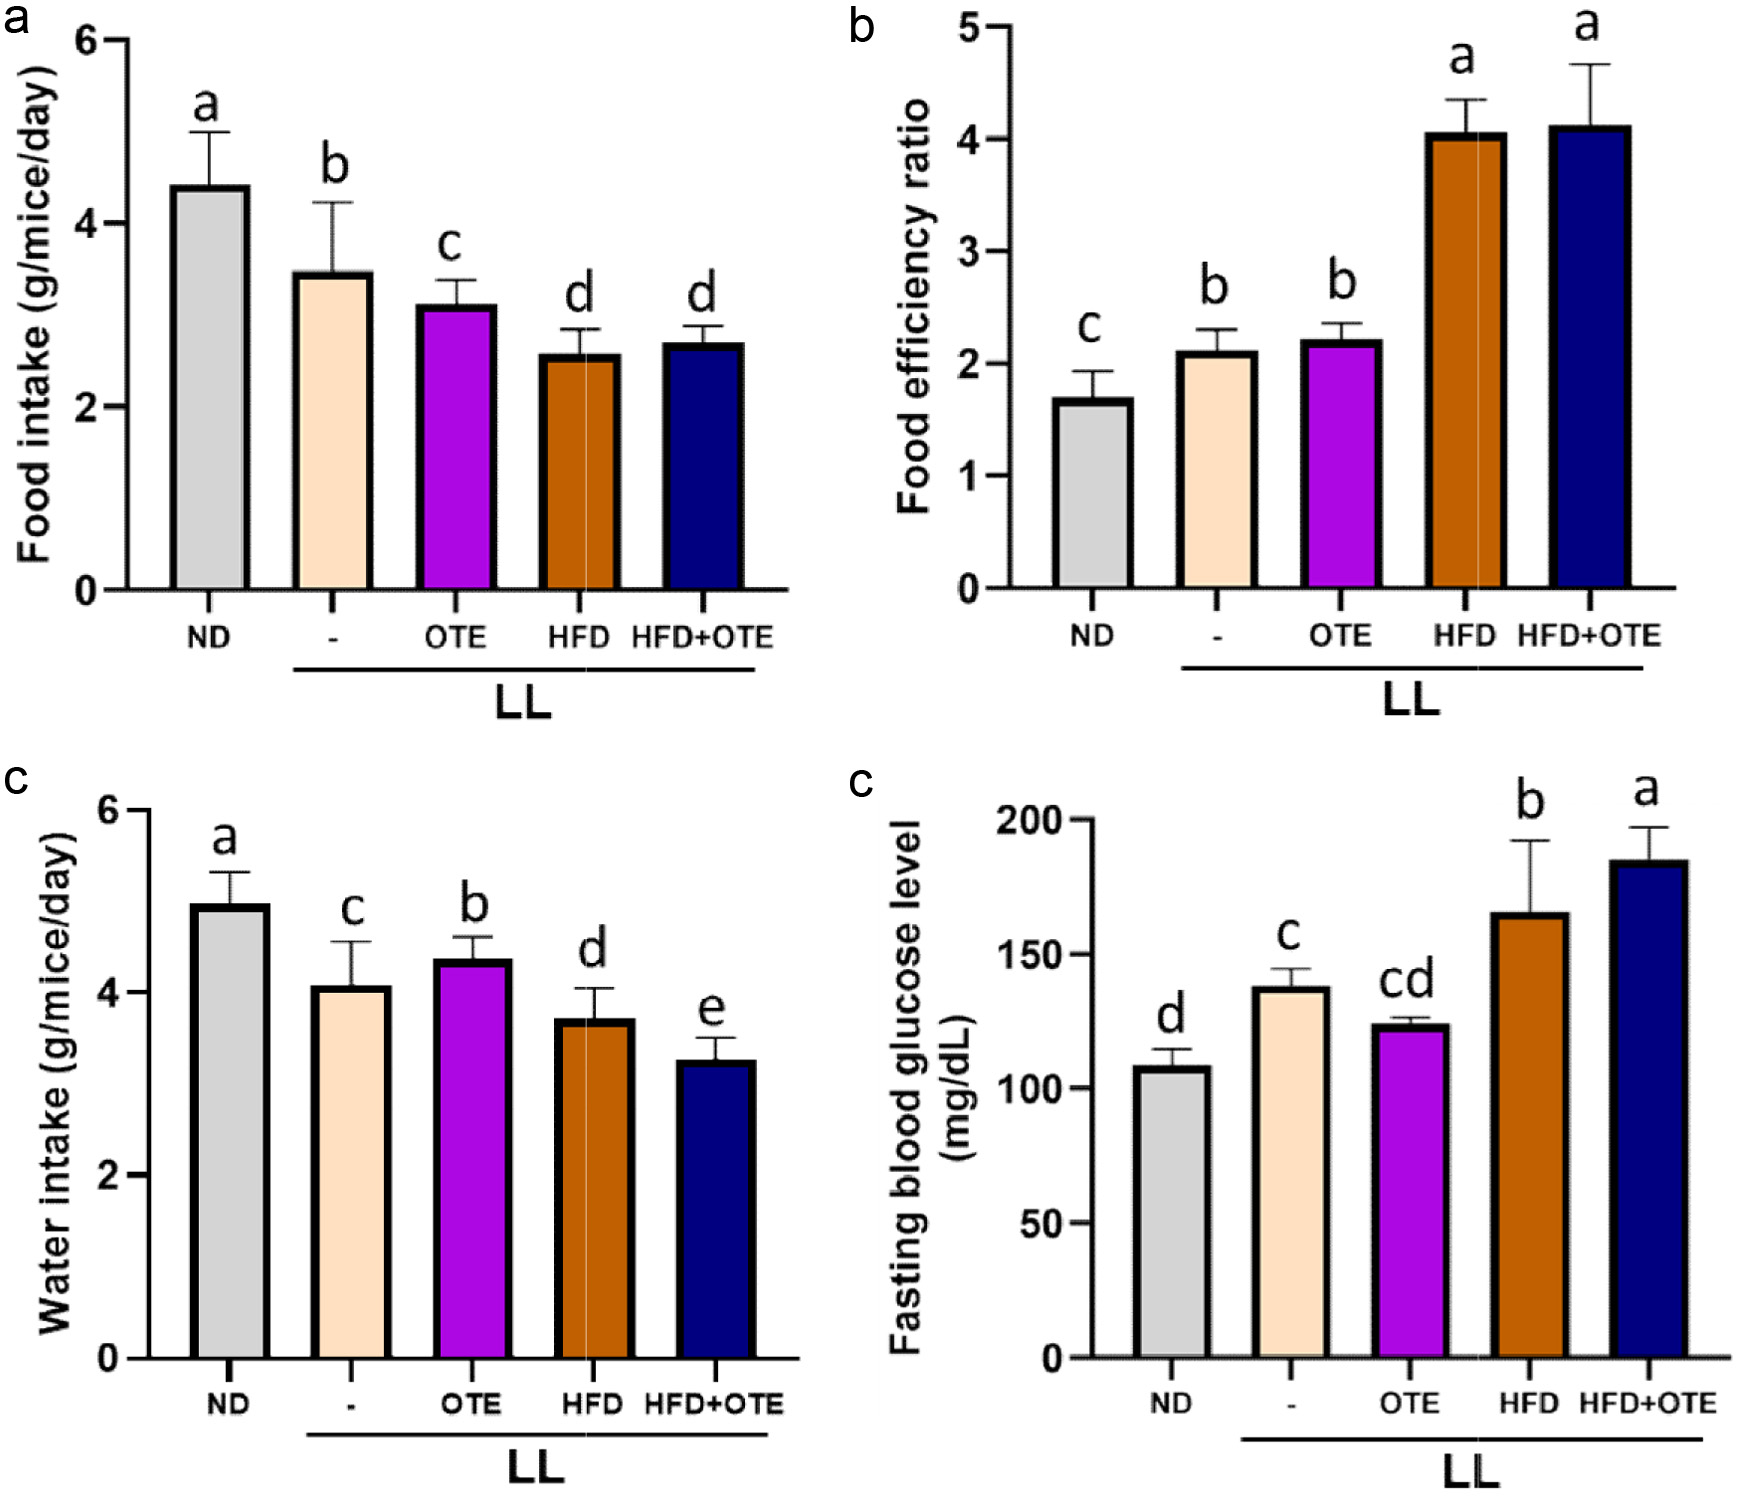
Figure 3. Effect of OTE on food intake, food efficiency, and water consumption in mice under constant light conditions. (a) Food intake, (b) food efficiency ratio, (c) water intake and (d) fasting blood glucose level (N = 8). Different lowercase letters indicate a significant difference among the groups, as determined by ANOVA followed by Duncan’s post hoc test.
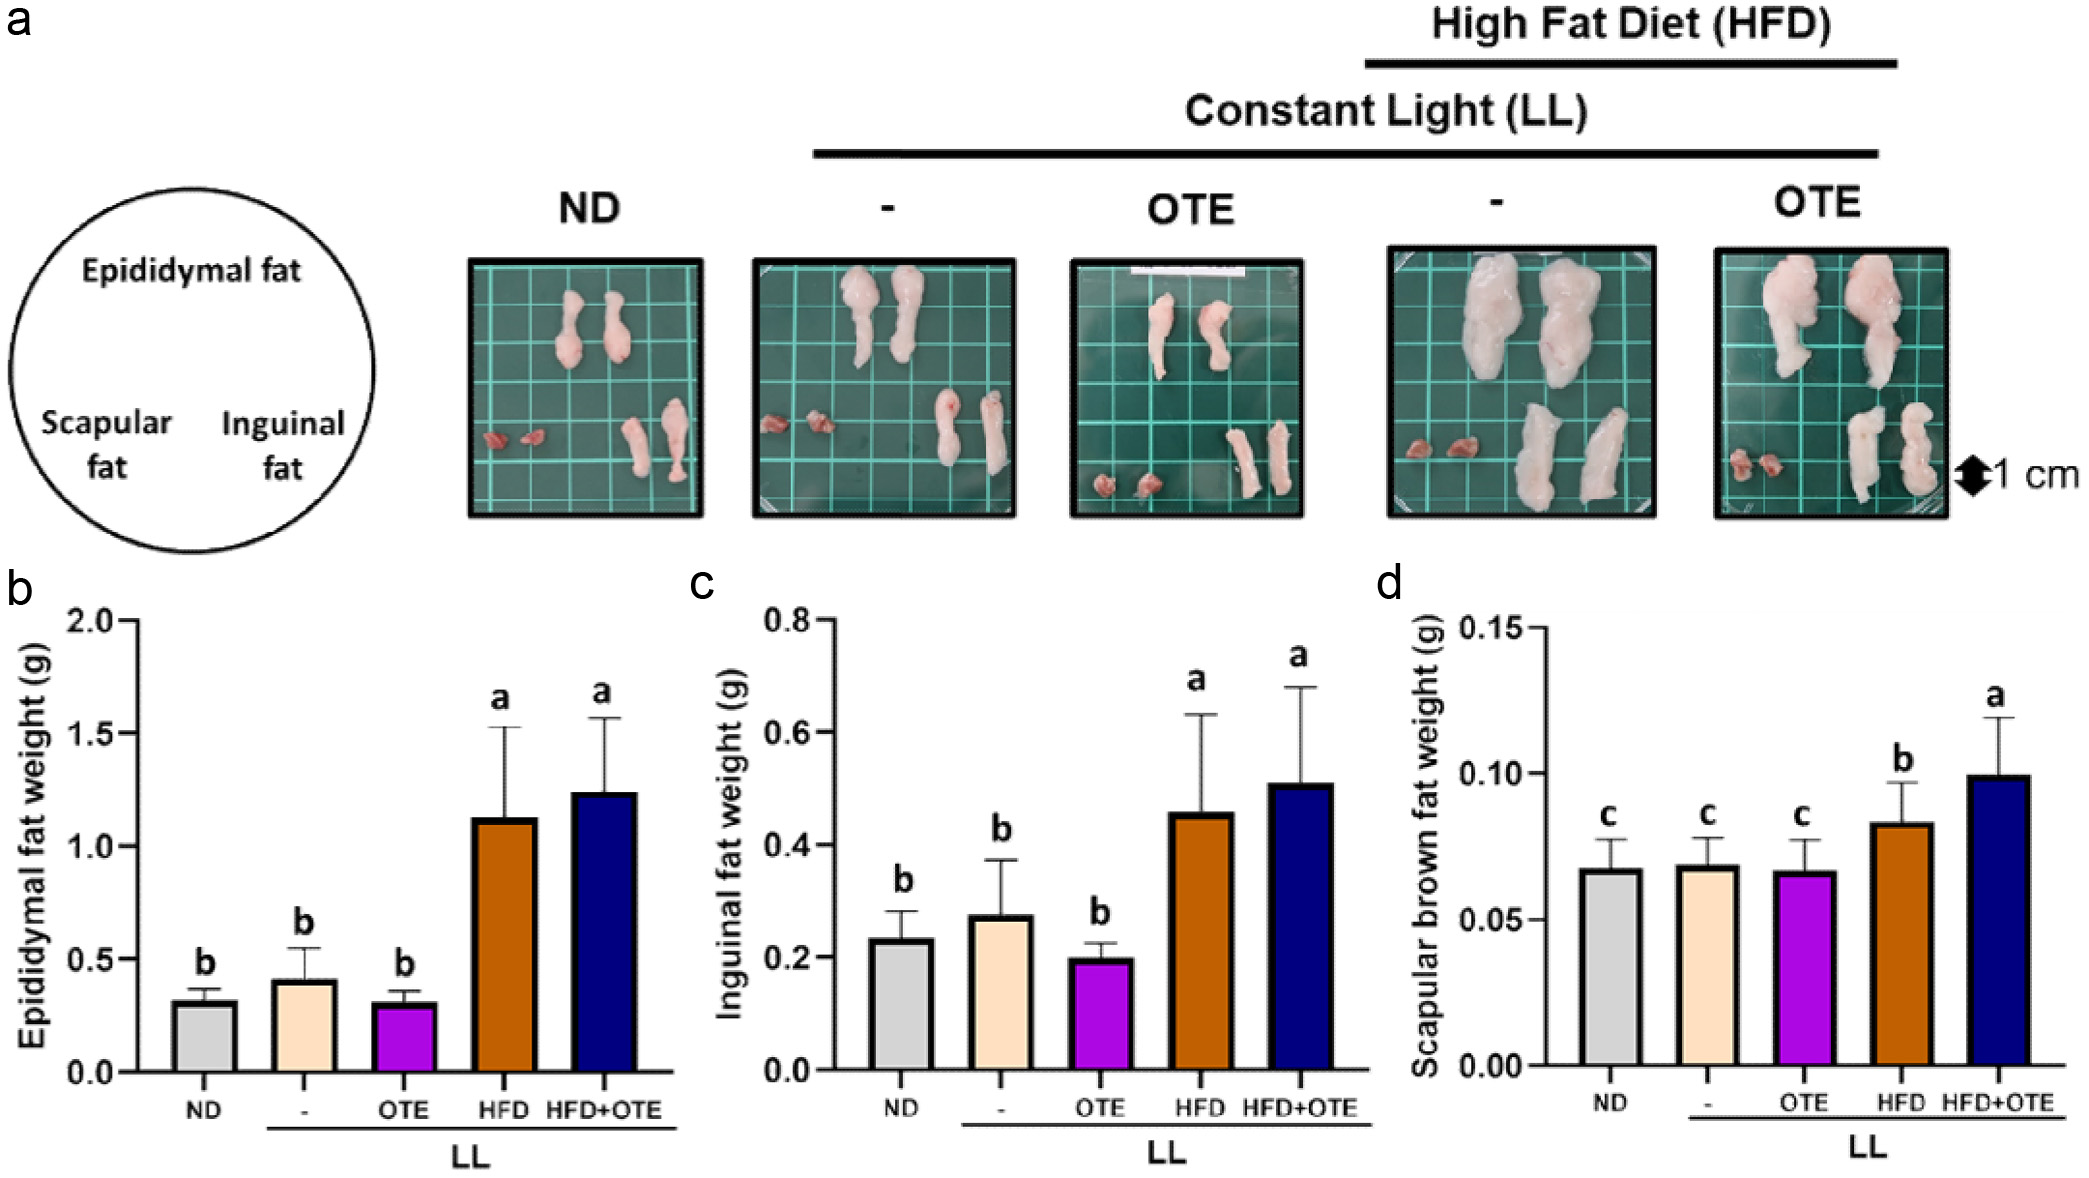
Figure 4. Effect of OTE on adipose tissue weight in C57BL/6 mice under constant light conditions. (a) Representative images of three type of adipose tissues. The average weights of (b) epididymal fat, (c) inguinal fat and (d) scapular fat (N = 8). Different lowercase letters indicate a significant difference among the groups, as determined by ANOVA followed by Duncan’s post hoc test.
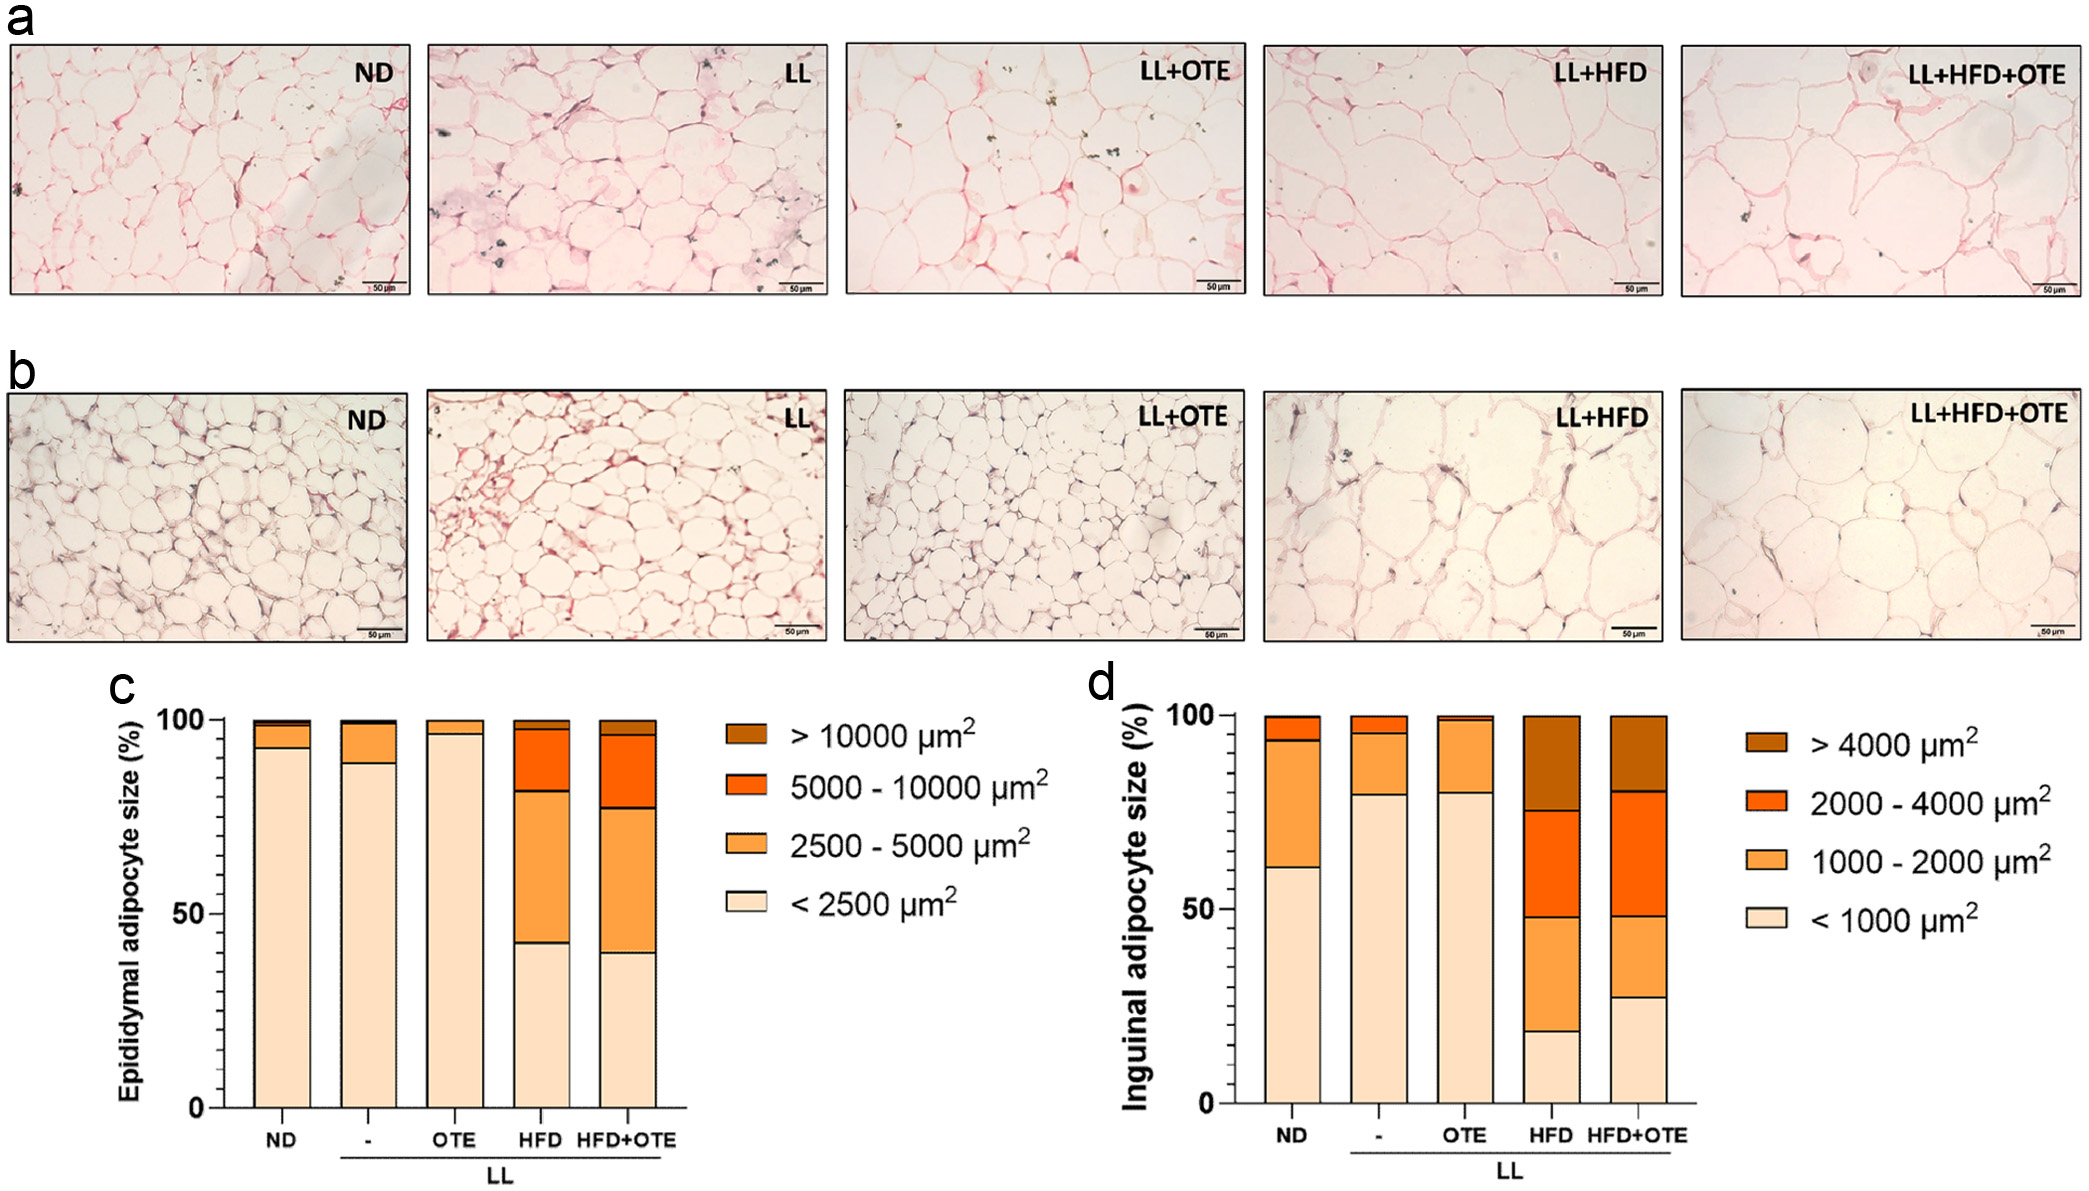
Figure 5. Histological analysis of adipose tissues in C57BL/6 mice under HFD feeding and constant light conditions. (a) Representative images of H&E stained epididymal fat and (b) inguinal fat under 400x magnification. (c) Size distribution of adipocytes in epididymal fat and (d) inguinal fat. At least four independent replications were conducted.
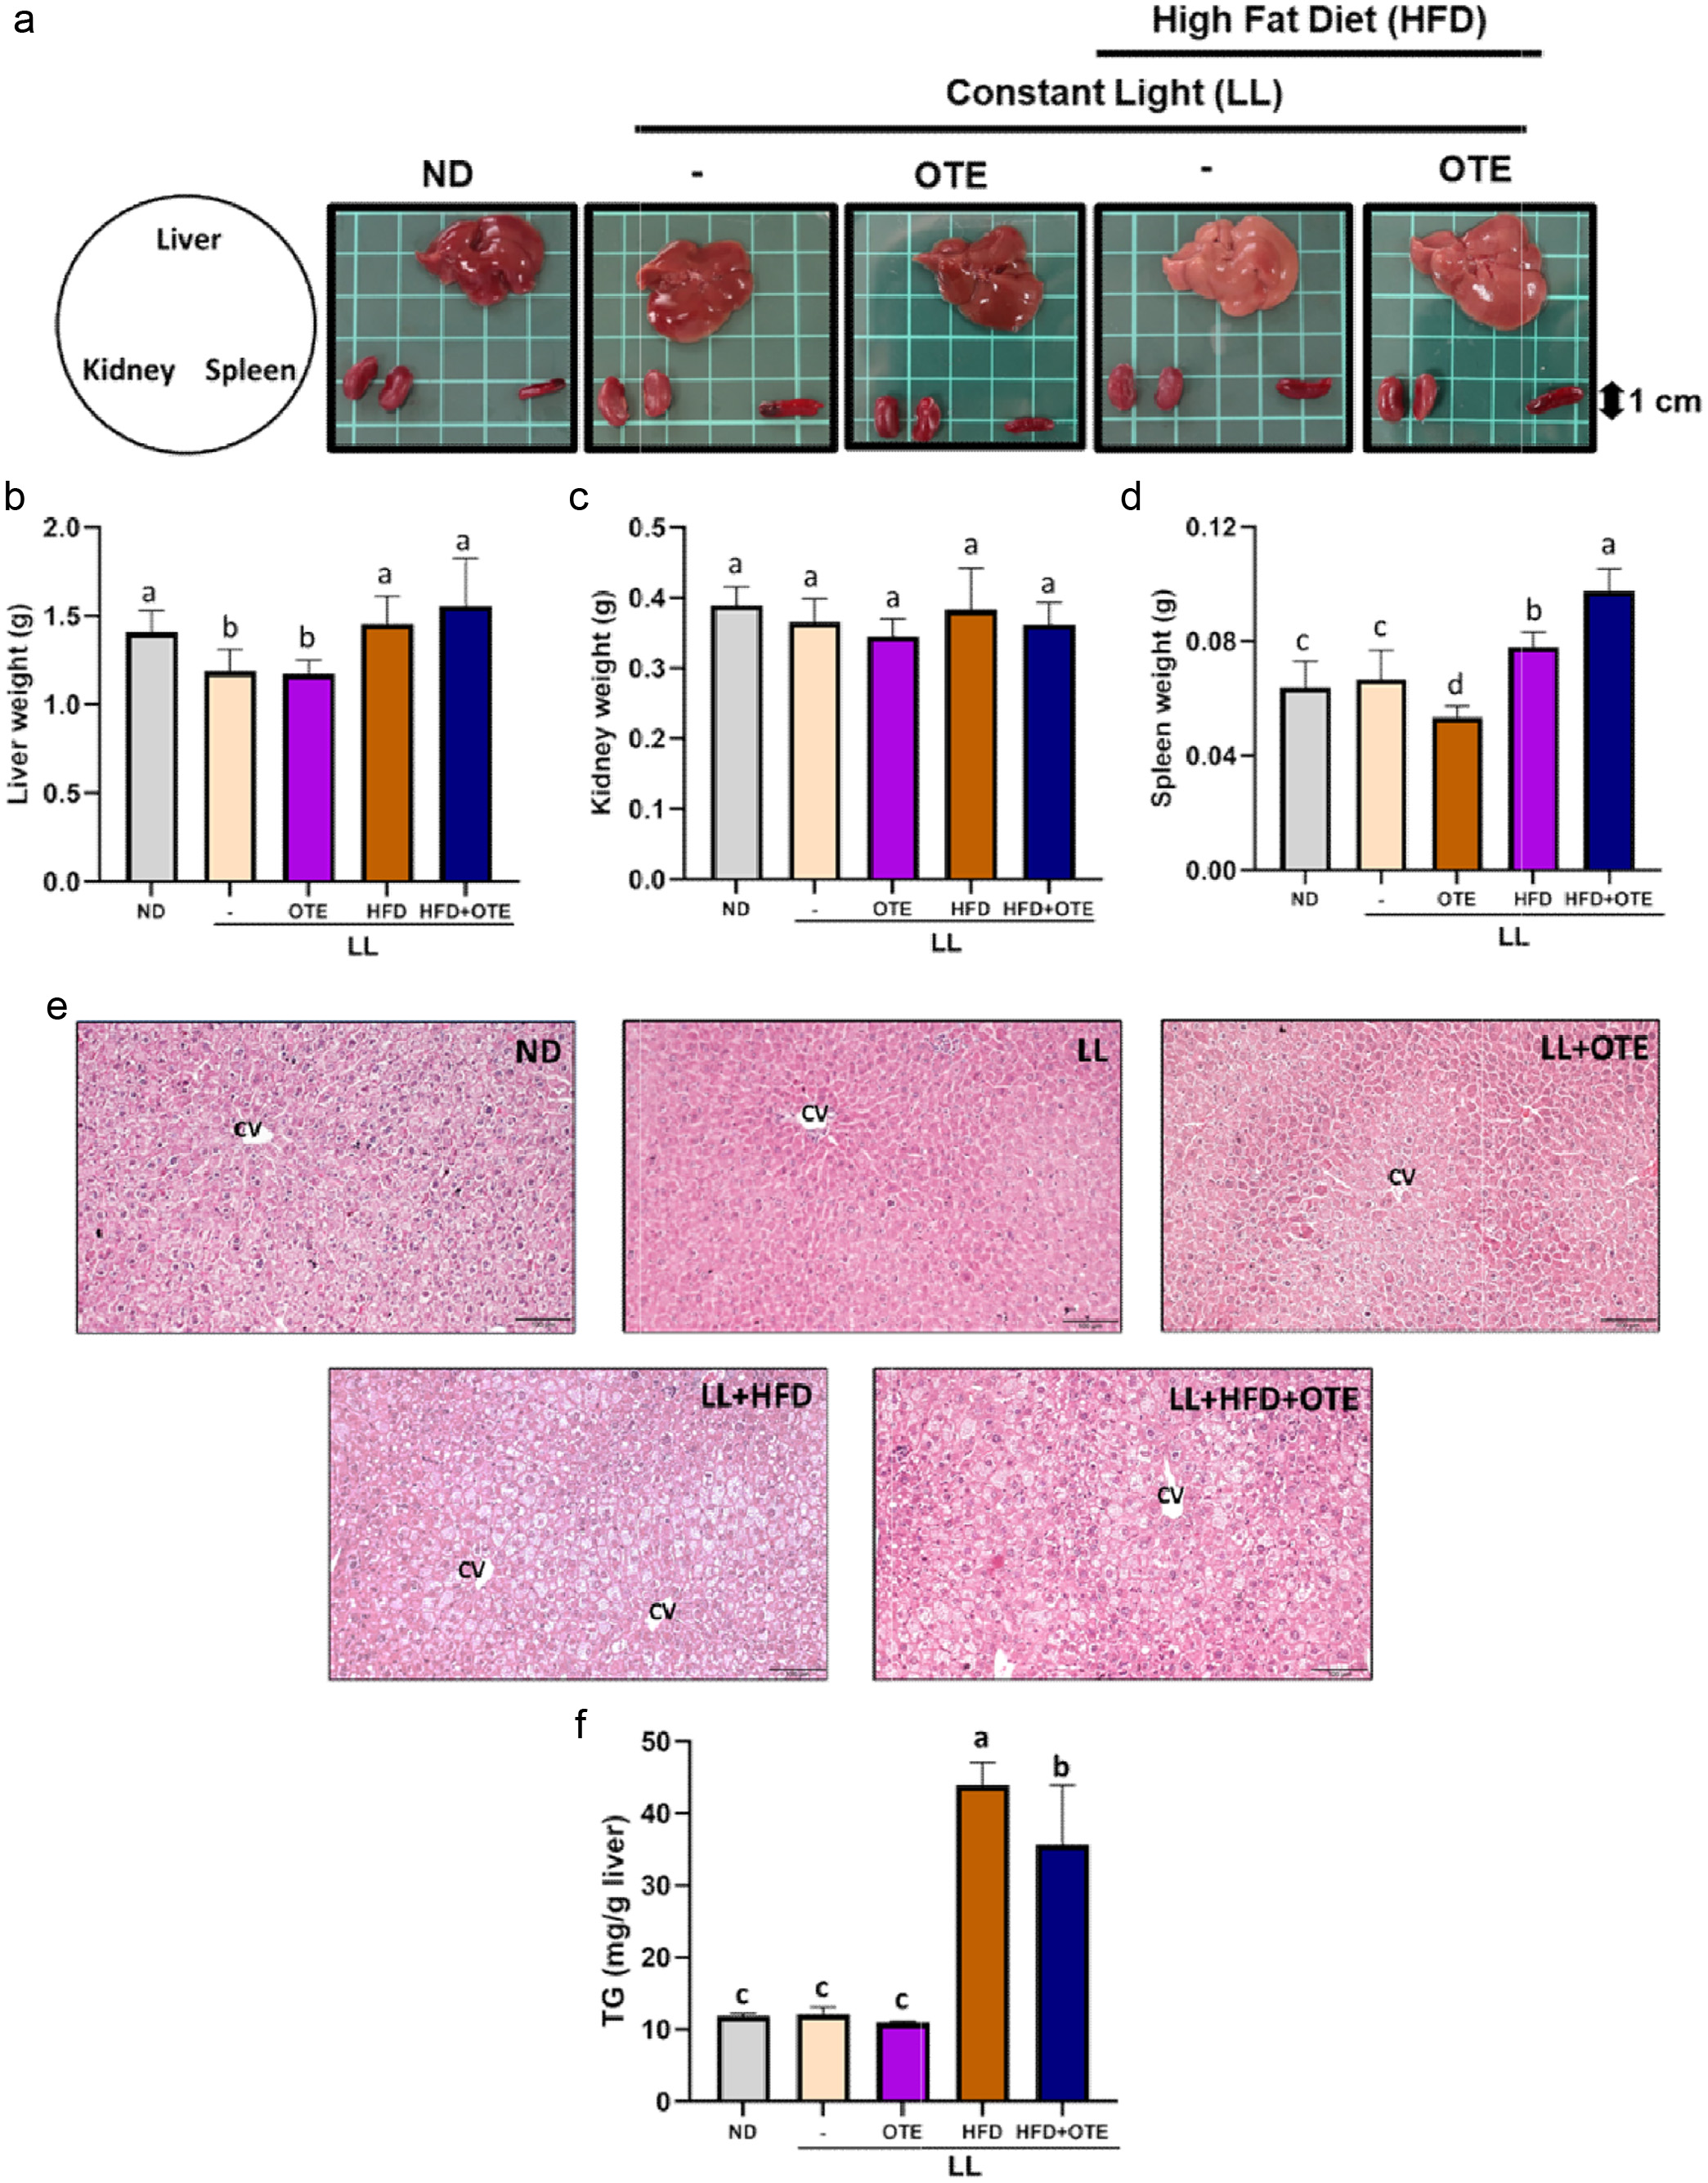
Figure 6. The effect of OTE on the organ appearance and weight of c57bl/6 mice under constant light conditions. (a) The representative images of liver, kidney and spleen of each group. The average weight of (b) livers, (c) kidneys and (d) spleens (N = 8). (e) Representative images of H&E-stained liver sections. (f) The hepatic TG levels. Different lowercase letters indicate a significant difference among the groups, as determined by ANOVA followed by Duncan’s post hoc test.
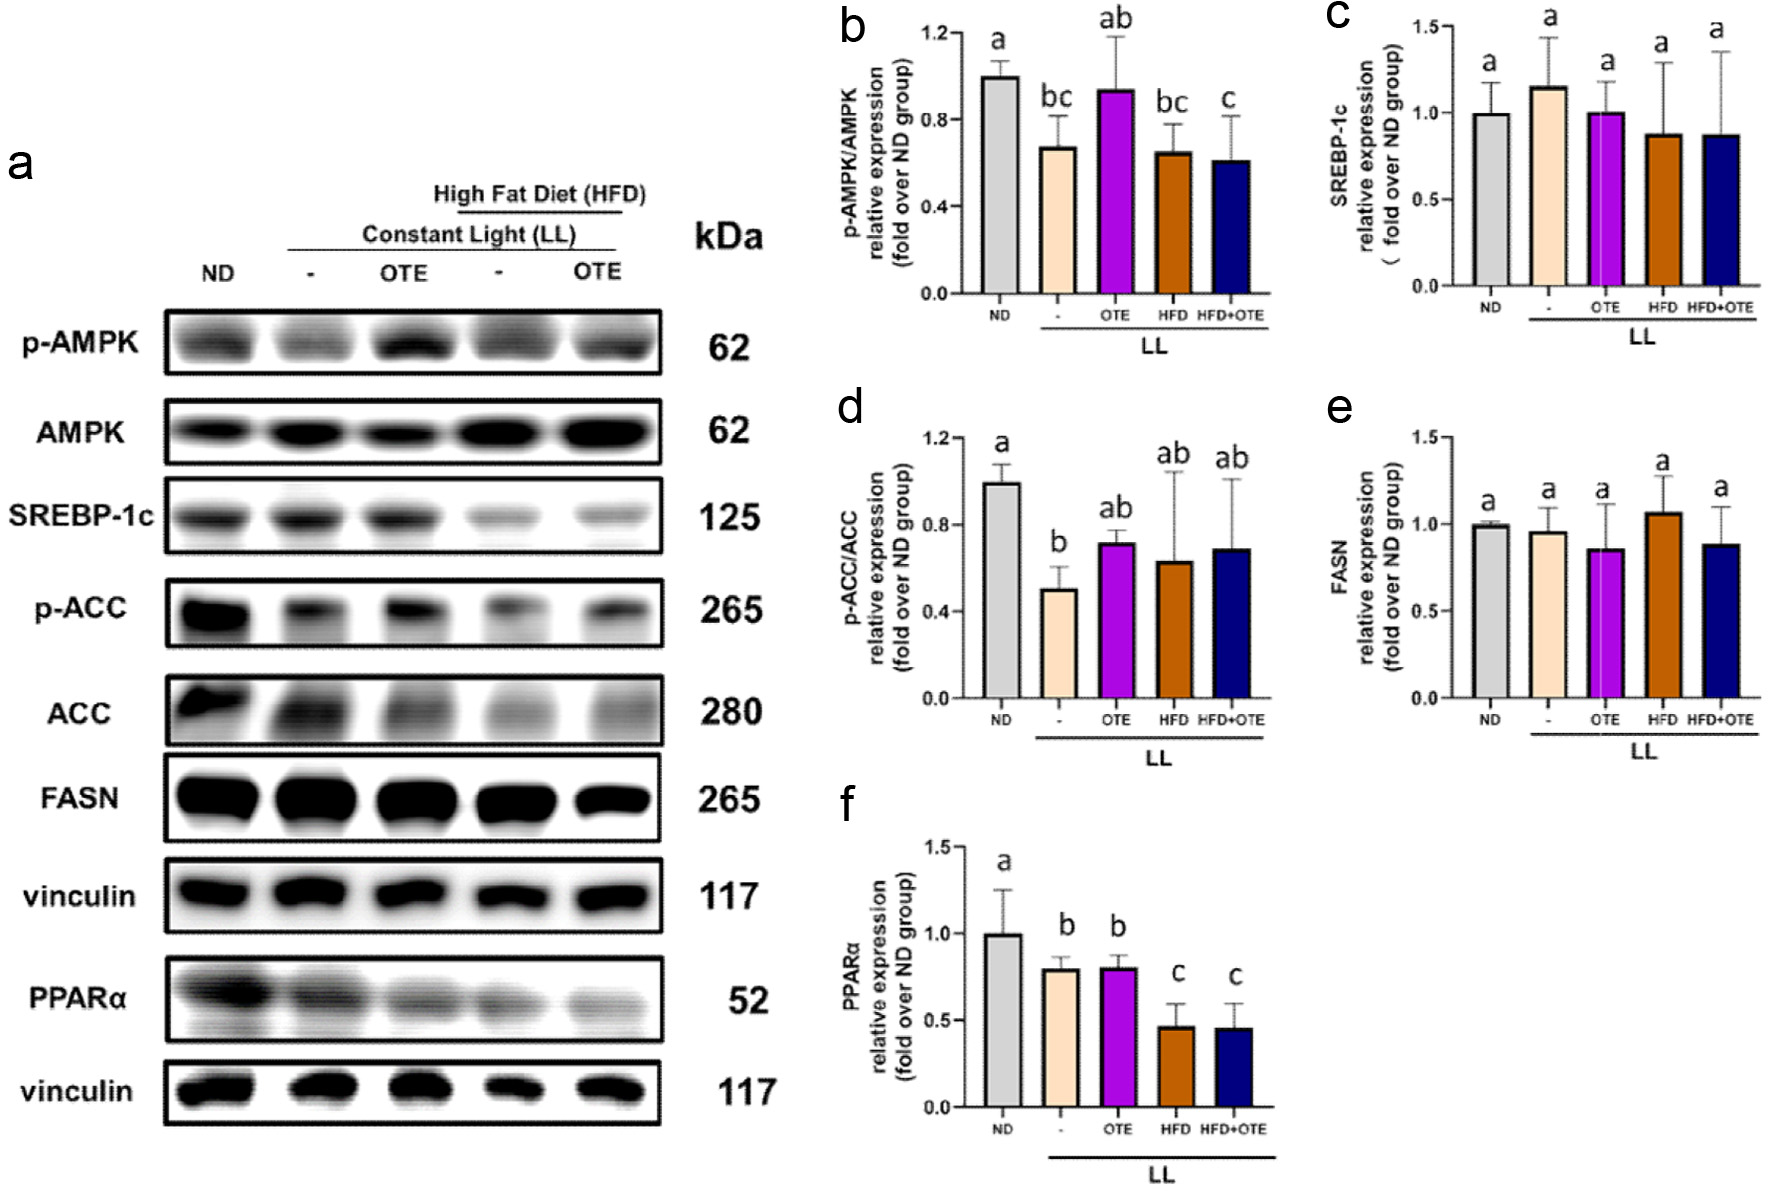
Figure 7. Impact of LL and OTE on liver fatty acid synthesis-related protein expression. (a) The representative images of western blots and the protein expression quantifications of (b) p-AMPK/AMPK, (c) SREBP-1c, (d) p-ACC/ACC, (e) FASN, and (f) PPARα. Different lowercase letters indicate a significant difference among the groups, as determined by ANOVA followed by Duncan’s post hoc test. At least three independent replications were conducted.
Tables
Table 1. The adipocyte size distribution in epididymal adipose tissue
| ND | LL | LL+OTE | LL+HFD | LL+HFD+OTE |
|---|
| Different lowercase letters indicate a significant difference among the groups, as determined by ANOVA followed by Duncan’s post hoc test. At least four independent replications were conducted. |
| <2,500 µm2 | 92.91 ± 2.71a | 89.15 ± 10.77a | 96.65 ± 3.36a | 42.85 ± 8.78b | 40.34 ± 7.16b |
| 2,500–5,000 µm2 | 5.98 ± 1.95b | 10.20 ± 10.23b | 3.27 ± 3.36b | 39.06 ± 5.08a | 37.16 ± 5.84a |
| 5,000–10,000 µm2 | 0.91 ± 0.72b | 0.51 ± 0.70b | 0.08 ± 0.18b | 15.98 ± 6.51a | 18.78 ± 4.14a |
| >10,000 µm2 | 0.21 ± 0.41b | 0.14 ± 0.19b | 0.00 ± 0.00b | 2.12 ± 2.68a | 3.72 ± 1.62a |
Table 2. The adipocyte size distribution in inguinal adipose tissue.
| ND | LL | LL+OTE | LL+HFD | LL+HFD+OTE |
|---|
| Different lowercase letters indicate a significant difference among the groups, as determined by ANOVA followed by Duncan’s post hoc test. At least four independent replications were conducted. |
| <1,000 µm2 | 61.02 ± 10.99a | 79.73 ± 15.55a | 80.29 ± 9.33a | 18.80 ± 14.51b | 27.62 ± 13.07b |
| 1,000–2,000 µm2 | 32.58 ± 7.49a | 15.94 ± 9.25c | 18.58 ± 8.98c | 29.29 ± 8.20ab | 20.93 ± 7.72bc |
| 2,000–4,000 µm2 | 5.95 ± 4.96b | 4.19 ± 7.87b | 1.13 ± 1.28b | 27.46 ± 10.14a | 32.07 ± 9.44a |
| >4,000 µm2 | 0.35 ± 0.61b | 0.13 ± 0.30b | 0.00 ± 0.00b | 24.34 ± 18.68a | 19.38 ± 13.22a |