| Journal of Food Bioactives, ISSN 2637-8752 print, 2637-8779 online |
| Journal website www.isnff-jfb.com |
Original Research
Volume 3, September 2018, pages 151-160
Anti-diabetic effects of a theaflavin-enriched black tea extract in the obese ZDF rat model
Alexander Gosslaua, b, c, *, Emmanuel Zachariahd, Shiming Lic, Chi-Tang Hoc
aDepartment of Science (Biology), City University of New York, BMCC, New York, NY 10007, USA
bDepartment of Chemistry and Chemical Biology, Rutgers University, Piscataway, New Jersey 08854-8087, USA
cDepartment of Food Science, Rutgers University, New Brunswick, New Jersey 08901-8520, USA
dOncopath Genomics, Monmouth Junction, New Jersey 08852, USA
*Corresponding author: Alexander Gosslau, Department of Science, City University of New York, BMCC, 199 Chambers Street, New York, NY 10007, USA
DOI: 10.31665/JFB.2018.3158
Received: August 30, 2018; Revised received & accepted: September 6, 2018
| Abstract | ▴Top |
Effects of a theaflavin-enriched black tea extract (BTE) against type 2 diabetes (T2D) were analyzed using the obese ZDF model. ZDF rats were hyperglycemic, dyslipidemic and express pro-inflammatory markers. BTE was well tolerated and caused an elevation of fasted and fed glucose as well as lower glucose tolerance in contrast to hypoglycemic effects by metformin. However, the BTE group showed decreased levels of LDL and triacylglycerols which corresponded to an increase in free fatty acids. Positive effects against dyslipidemia of BTE corresponded to a significant decrease in weight gain. The impact on inflammatory pathways was analyzed by expression analysis of inflammatory mediators in whole blood and epididymal adipose tissue using TaqMan PCR and ELISA. Whole blood analysis revealed a significant down-regulation of ICAM-1 and TNF-α, whereas IL-4, IL-6, IL-10, IL-13 and IFN-γ were elevated to higher levels as compared to ibuprofen. In adipose tissue, BTE treatment induced an upregulation of COX-2 and IL-6. Thus, BTE treatment showed strong effects against systemic inflammation and caused a reduction of weight gain with positive effects against dyslipidemia. The complexity of signaling pathways leading to complications in diabetes suggest a treatment of BTE in combination with antidiabetic therapeutics as promising strategy against T2D.
Keywords: Type 2 diabetes; Black tea; Theaflavin; Zucker Diabetic Fatty rats; Chronic inflammation; Obesity
| 1. Introduction | ▴Top |
Type 2 diabetes (T2D) is one of the most escalating global health concerns (Bluher, 2016; Chaudhury et al., 2017; Donath, 2014). Currently, T2D is at 425 million worldwide and projected to be at 629 million people by 2,045 with a high proportion of the diabetic population still remaining undiagnosed according to the International Diabetes Federation (www.idf.org). Chronic inflammation is a key pathologic link between obesity and T2D in hypertrophic adipose tissue. It is generally accepted that dysfunctional lipid metabolism gives rise to increased circulating free fatty acids (FFAs) leading to hyperlipidemia, lipid peroxidation and the accumulation of necrotic, apoptotic and autophagic adipocytes (Boutens and Stienstra, 2016; Donath, 2014; Lee, 2013; McArdle et al., 2013). These events lead to an infiltration of pro-inflammatory immune cells responsible for progression of T2D (Bluher, 2016; Boutens and Stienstra, 2016; Calle and Fernandez, 2012; Chawla et al., 2011; Donath, 2014; Lee, 2013). Accumulation of free radicals released by immunocompetent cells, or derived from conditions of dyslipidemia, cause a disruption of the insulin signaling cascade. In a vicious cycle, more reactive radicals formed by high glucose expedite an impairment of the insulin receptor, causing a further disconnection of signaling pathways to glucose transporters, thus leading to chronic hyperglycemia and insulin resistance (Boutens and Stienstra, 2016; Chen et al., 2015; Donath, 2014; Ramasamy et al., 2012; Vlassara and Uribarri, 2014). Due to the connection between obesity and chronic inflammation, a dramatic rise in T2D is expected with an aging population and epidemic obesity (Bluher, 2016; Boutens and Stienstra, 2016; Ouchi et al., 2011).
Majorly, two different types of macrophages contribute to inflammation in adipose tissue: M1 alternative type macrophages have mainly anti-inflammatory functions through IL-4, IL-10 and IL-13, and predominate in lean adipose tissue (Boutens and Stienstra, 2016; Chawla et al., 2011; Donath, 2014; Lee, 2013); M2 classical macrophages induce inflammation through secretion of pro-inflammatory cytokines and chemokines (Boutens and Stienstra, 2016; Chawla et al., 2011; Donath, 2014; Lee, 2013; Ouchi et al., 2011). Adipose tissue derived from obese individuals is mainly infiltrated with M2 macrophages, visible as crown-like structures (Lee, 2013; Ouchi et al., 2011). In a positive feedback loop, TNF-α, IL-1β, IL-6 and ICAM-1 stimulate the inflammatory cascade through NFκB and AP-1 signaling to generate free radicals such as reactive nitrogen (RNS) and reactive oxygen species (ROS) (Bluher, 2016; Boutens and Stienstra, 2016; Chawla et al., 2011; Chen et al., 2015; Gosslau et al., 2011; Gu et al., 2013; Lee, 2013; Ouchi et al., 2011; Shoelson et al., 2006; Vlassara and Uribarri, 2014). Increased serine phosphorylation of insulin receptor substrates, IRS1 and IRS2, by JNK and NFkB signaling, in turn, inhibit the tyrosine kinase activity of the insulin receptor (Hotamisligil et al., 1996; Schenk et al., 2008). Ultimately, an impairment of PI-3K/AKT insulin signaling causes a decrease of translocation and insertion of GLUT-4 leading to chronic hyperglycemia (Li et al., 2017; Saltiel and Kahn, 2001). The formation of advanced glycated end-products (AGE) by reactive carbonyl species (RCS; e.g.,methylglyoxal) and glycated proteins (e.g., HbA1c) will lead to cell, tissue and organ damage, ultimately causing nephropathy, cardiovascular disease, retinopathy, neuropathy or different cancers (Chawla et al., 2011; Donath, 2014; Goldfine et al., 2011; Ramasamy et al., 2012; Shoelson et al., 2006; Vlassara and Uribarri, 2014).
Most therapies for diabetes involve control of hyperglycemia or insulin resistance. Metformin is considered to be the first-line anti-hyperglycemic drug treatment for T2D, by mechanisms of increased cellular insulin sensitivity and suppression of hepatic glucose production (Romero et al., 2017; Thomas and Gregg, 2017). Metformin or other anti-diabetic drugs often fail to control the inflammatory processes leading to T2D and may have side effects. Natural products with potent efficacy have the potential to fill this therapeutic gap addressing the complexity in the inflammatory cascade, which may be advantageous for long-term therapy (Leiherer et al., 2012; McArdle et al., 2013; Nowlin et al., 2012). Health promoting and therapeutic effects of black tea are well documented. Theaflavines are considered to be the major bioactives. Four different isoforms such as theaflavin (TF-1), theaflavin-3-O-gallate (TF-2a), theaflavin-3′-O-gallate (TF-2b) and theaflavin-3,3′-O-O-digallate (TF-3) have been described with strong anti-oxidative and anti-inflammatory effects (de Mejia et al., 2009; Gosslau et al., 2018; He, 2017; Ho et al., 2008; Khan and Mukhtar, 2007; Li et al., 2013; Sang et al., 2011; Sharma and Rao, 2009; Yang et al., 2009). Previously, significant anti-inflammatory effects of our theaflavin-enriched black tea extract (BTE) in cell-based, animal, and clinical settings had been demonstrated (Arent et al., 2010; Gosslau et al., 2011; Gosslau et al., 2008). In contrast to green tea, studies on black tea related to T2D are limited and, partly due to the lack of characterization, not uniformly comparable (Naveed et al., 2018; Yang et al., 2016). Effects of black tea against hyperglycemia and dyslipidemia had been demonstrated in different experimental settings (Mahmoud et al., 2016; Naveed et al., 2018; Neyestani et al., 2010; Ramadan et al., 2009; Ramlagan et al., 2017). An inhibition of inflammatory pathways in diabetic conditions by black tea is indicated by an increase of IL-10 and IL-17, and a decrease of IFN-γ and C-reactive protein, respectively (Mahmoud et al., 2016; Naveed et al., 2018; Neyestani et al., 2010). In accordance to anti-diabetic effects of black tea, theaflavins showed anti-hyperglycemic (e.g., decline in glucose, increase in insulin sensitivity, scavenger activity for RCS) (Imran et al., 2018; Lo et al., 2006; Miyata et al., 2013) and anti-dyslipidemic effects (e.g., decrease in cholesterol, LDL and triacylglycerols; increase in HDL) (Imran et al., 2018). Recent studies showed an impact of black tea on weight reduction via lipid metabolism (Rothenberg et al., 2018).
The growing body of evidence pointing to the benefits of natural anti-inflammatory extracts in T2D led us to test the effects of BTE. The ZDF rat model reflects the relationship between obesity, chronic inflammation and T2D. Here, we report that BTE showed significant effects against obesity-related inflammation. In addition, BTE caused a reduction of weight gain, paralleled by a decline in triglycerides and increase in FFAs as compared to ZDF controls. On the other hand, BTE caused an increase in hyperglycemia. Our results suggest a potential therapeutic application of BTE to attenuate the inflammatory cascade and activate catabolic pathways in lipid metabolism. A combination with therapeutics to lower blood glucose might be a promising strategy to address the complexity of different pathways leading to T2D.
| 2. Materials and methods | ▴Top |
2.1. Materials and chemicals
For RNA isolation from whole blood and epididymal adipose tissue, Trizol reagent and RNeasyTM Total RNA Kit or RNeasyTM Lipid Mini Kit (Qiagen, Chatsworth, CA) was used. Oligo-dT, dNTPs, SuperscriptTM II reverse transcriptase were purchased from Invitrogen, Life Technologies (Grand Island, NY). TaqMan qPCR probes, primers and master mix were from Applied Biosystems, Life Technologies (Grand Island, NY). Other chemicals were purchased from Sigma (St. Louis, MO).
2.2. Preparation and chemical characterization of the black tea extract
The black tea extract (95%) was provided by DH Nutraceutical USA Inc. (Edison, NJ). Chemical characterization was performed using HPLC analysis. Standard compounds caffeine and (–)-epicatechin (EC) were purchased from Sigma-Aldrich (St. Louis, MO). (–)-Epigallocatechin gallate (EGCG) was provided by Mitsui Norin (Shizuoka, Japan). (–)-Epigallocatechin (EGC), (–)-epicatechin-3–gallate (ECG), theaflavin (TF-1), theaflavin-monogallate (TF-2), and theaflavin-3,3′-digallate (TF-3) were prepared in house using the separation method described, previously (Lo et al., 2006). HPLC grade of anhydrous ethanol, hexanes, ethyl acetate, acetonitrile, methanol, water and ACS reagent grade of acetone and 95% ethanol were purchased from Pharmaco-Aaper (Brookfield, CT). The Dionex UltiMate 3000 LC Modules equipped with a pump (Model: LPG-3400 pump, Sunnyvale, CA), UVVis detector (Model: VWD-3400 detector), and an autosampler (Model: WPS-3000 SL) were used. A reverse phase column (Luna C18, 150 × 4.6 mm id, 3 µm particle size, 100 Å, Phenomenex, Torrance, CA) was used for analysis. The column temperature was maintained at 25 °C in a column oven (Dionex Model STH585). The mobile phases consisted of water with 0.15% acetic acid (solvent A) and acetonitrile (solvent B) with a flow rate of 0.8 mL/min and detection wavelength at 280 nm. A linear gradient elution was performed as following: initially, 8% solvent B, increased to 12% B over 10 min, to 18% B in next 30 min, to 21% B in 1 min, to 28% over next 29 min. The external standard quantification method was applied in this study. Every single peak area for the quantification was laid in the linear range of each standard curve. The sample solution of the black tea extract was prepared in a concentration of 3 mg/mL in a mixed solvent of ethanol and water (1:1 ratio). Each sample was repeated for analysis at least three times.
2.3. Animals used
Zucker diabetic fatty (ZDF) rats, based on a missense mutation in the leptin receptor gene (Phillips et al., 1996) and control animals were studied at Charles River Laboratories (CRL). 40 six-week old male ZDF were used. At 10 weeks of age, fed glucose (via glucometer) was assessed and 40 animals with blood glucose levels ≥ 250 mg/dL were selected along with 8 age matched lean controls. Rats were singly housed on a normal light cycle in the animal facility and received a control diet 5008 (LabDiets, changed weekly) for the duration the study. All protocols were approved by the IACUC (Piedmont research center).
2.3.1. Treatment
For experiments, the 40 ZDF rats were randomized and combined with the lean control group into six different cohorts by HbA1c levels: group 1 (Lean ZDF control treated with vehicle (0.5% HPMC + 0.2% Tween)); group 2 (ZDF control treated with vehicle); group 3 (ZDF treated with metformin (250 mg/kg)); group 4 (ZDF treated with ibuprofen (100 mg/kg); group 5 (ZDF treated with BTE (250 mg/kg)); group 6 (ZDF treated with BTE (500 mg/kg)). The BTE concentrations were chosen based on earlier studies (Gosslau et al., 2011). Oral gavage doses were formulated weekly, and released from the pharmacy in daily aliquots for dosing. Animals were gavaged once daily for 30 days at 10 mL/kg. Rats were weighted twice a week and food intake was recorded weekly. Body mass index (BMI) was determined after animals were weighed using animal length (tip of the nose to the tip of the tail). Fed (at 8 hrs, prior to test article dosing) and 5 hrs fasted (at 13 hrs) blood glucose was checked at Baseline, Day 8, 15, and 22, and 28. On study day 29, an oral glucose tolerance test was conducted on overnight fasted animals. Food was returned to all animals following the final time point.
2.3.2. Sampling
On study day 30, blood was collected at CRL. HbA1c was measured at 8 hrs on a drop of tail whole blood and then animals were fasted. At 11 hrs, animals were dosed per normal and euthanized at 13 hrs by CO2 asphyxiation. Blood was withdrawn by cardiac puncture and 1 mL of whole blood placed into cryo vials for RNA extraction. Remaining blood was centrifuged (at 2,200 × g for 10 minutes at 22 °C) and serum (500 uL) pipetted into 96 well plates on dry ice for analysis of the following: insulin, adiponectin, clinical chemistry panel with lipid parameters, and the inflammatory panel. Liver, epididymal fat, kidney, heart and spleen were collected and a representative piece was snap frozen. 100 mg of tissue was transferred into 1.5 mL cold RNA later tubes and stored overnight at 4 °C before being moved to −20 °C.
2.4. HbA1c analysis
Glycated hemoglobin (HbA1c) levels in venous whole blood were determined at CRL using the HbA1c Now test kit (Bayer, Whippany, NJ). HbA1c was measured in treatment groups by immunoassay with anti-HbA1c using tail nick whole blood.
2.5. Oral glucose tolerance test
On study day 29 an oral glucose tolerance test was conducted on overnight fasted animals at CRL. All animals had been dosed per normal daily routine at 8 hrs. One hour later animals were gavaged with glucose at 2 g/kg. Whole blood glucose sampling occurred at the following times (min) relative to glucose dose: 0, 15, 30, 60, 90 and 120 min and were determined using a veterinary glucometer (Alpha Trak, Abbott Laboratories, Abbott Park, IL).
2.6. Clinical chemistry analysis
Plasma analysis of insulin, adiponection, cytokines and a full clinical chemistry panel with lipid parameters was performed at CRL using commercially available ELISA and colorimetric kits.
2.7. TaqMan qPCR analysis
For gene expression analysis by TaqMan qPCR, we employed five inflammatory surrogate genes (COX-2, TNF-α, ICAM-1, IL-1β, and IL-6), previously selected and validated in cell-based, animal and clinical studies by whole genome Affymetrix and custom-made Oligo microarrays (Gosslau et al., 2011). RNA was isolated from whole blood samples with Trizol reagent, followed by chloroform and isopropanol extraction. Total RNA was precipitated using the RNeasyTM (Qiagen, Chatsworth, CA) for whole blood or RNeasyTM Lipid Mini Kit for epididymal adipose tissue. Total RNA was reverse transcribed using standard protocols and reagents from Invitrogen, Life Technologies (Grand Island, NY). TaqMan qPCR was run on a Roche 480 Lightcycler (Roche Life Science, Indianapolis, IN) for 50 cycles with concentrations ranging from 100 ng to 0.01 ng for the standard curve. Gene expression of COX-2 (Rn01483828_m1), TNF-α (Rn01525859_g1), ICAM-1 (Rn00564227_m1), IL-1β (Rn00580432_m1), IL-6 (Rn01410330_m1), and GAPDH (Rn01775763_g1) were analyzed using probes, primers and master mix from Applied Biosystems (Life Technologies). After normalization to GAPDH, gene expression was expressed either as delta CT mean values +/- standard deviation or as delta-delta ct values to show the comparison with ZDF vehicle controls.
2.8. Statistics
Results were expressed as mean values + standard deviation for the different treatment groups (n = 8 for each group). Statistical comparisons of data were performed using the student’s t-test. Significant differences from the control group with P < 0.05, 0.01 or 0.001 were indicated as *, **, and ***, respectively.
| 3. Results | ▴Top |
3.1. Chemical profile of the BTE extract
The active entities of the purchased black tea extract were evaluated by analytical methods described in Section 2.2. Chemical characterization and quantification was performed using HPLC analysis. The total tea polyphenols reached 83.7% in the black tea extract, mainly theaflavins (68.4%) and minor concentrations of unfermented catechins (15.3%). The individual contributions from theaflavins are TF-1 (7.6%), TF-2a (26.3%), TF-2b (6.1 %), and TF-3 (28.4%). Hence, the black tea extract has a very high content theaflavins, particularly 32.4% of TF-2 (26.3% TF-2a and 6.1% TF-2b) and 28.4% of TF-3 accounting for more than two thirds of total tea polyphenols and 80% of theaflavins.
3.2. Effects of BTE on body weight and food intake
Lean control rats showed significant lower food intake, body weight and BMI compared to the ZDF control group (Table 1). All treatment groups showed a decline in body weight between day 25 and day 29 due to the overnight fasting on day 28. Chronic treatment with high concentrations of BTE did cause a significant decrease in weight after 8 and 22 days compared to ZDF controls with no changes in food intake. However, changes in body weight did not translate into significant changes in BMI. Overall assessment by clinical chemistry (total proteins, albumin, globulin, gamma-glutamyl transpeptidase, creatinine, Ca, P, Na, K and Cl) and organ morphology revealed that treatment with low and high concentrations of BTE was well tolerated and did not cause any toxicity or damaging effects (data not shown).
 Click to view | Table 1. Effects of BTE on weight and food intake |
3.3. Effects of BTE on glucose homeostasis
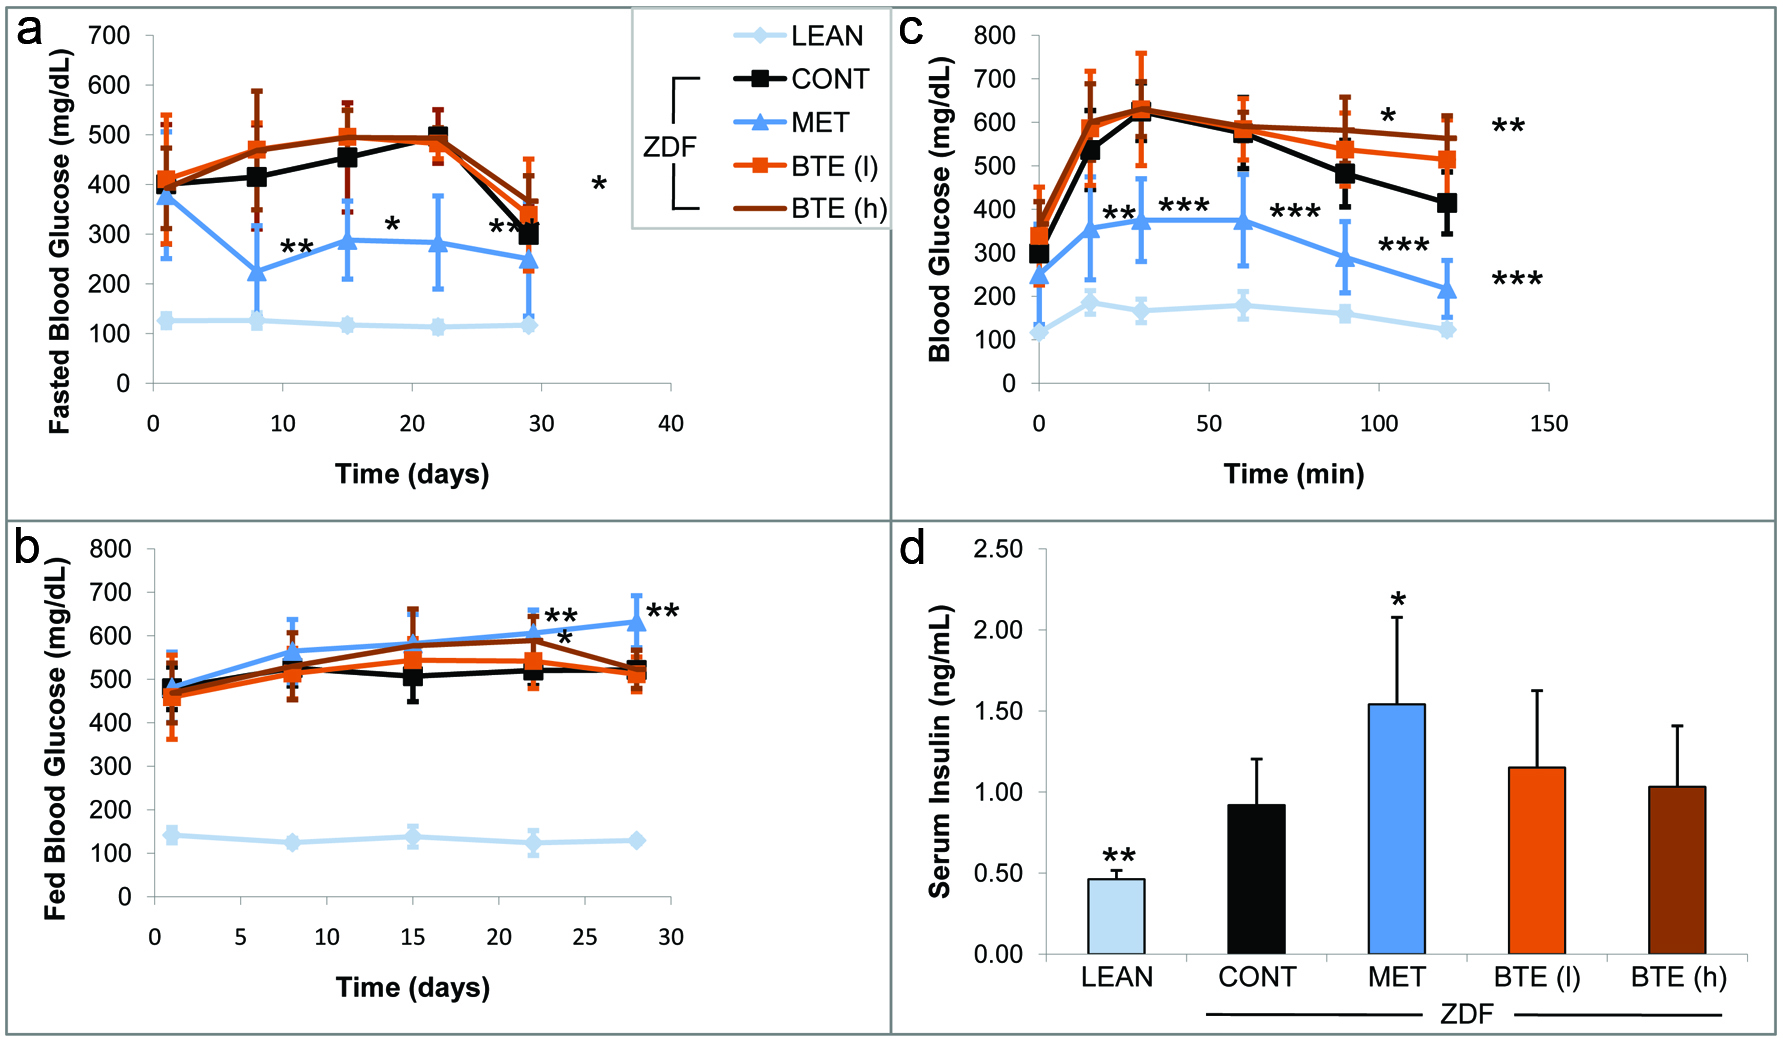
In the next set of experiments, we analyzed the effects of BTE on glucose-related parameters. Figure 1a shows a significant decrease in fasted blood glucose levels after 8 days of metformin treatment in ZDF rats. The overnight fasting on day 28, however, induced a decline of blood glucose levels to around 250 mg/dL on day 29 in all treatment groups. High concentrations of BTE (500 mg/kg) induced an increase in fasted glucose on day 29 (p < 0.05). Lean control animals did not show major changes in glucose levels throughout the study. Fed glucose levels showed significant higher levels on day 22 and 28 in response to metformin (Fig. 1b). Also ZDF rats receiving high concentrations of BTE showed elevated levels of fed glucose on day 22 (p < 0.05).
 Click for large image | Figure 1. Effects of BTE and metformin on glucose-related parameters. |
An oral glucose tolerance test (OGTT) was performed on day 29 of the study (Fig. 1c). Metformin, as expected induced a significant decline in blood glucose in a time-dependent manner as compared to the ZDF vehicle control starting after 15 min (p < 0.01). BTE treatment caused a dose-dependent increase in blood glucose. The effects by high concentrations of BTE were significant 90 min (p < 0.05) and 120 min (p < 0.01) after the glucose challenge. In lean controls we did observe a similar pattern of glucose clearance of significant smaller amounts of blood glucose.
The analysis of plasma insulin levels on day 30 revealed significant lower levels of insulin in lean controls as compared to ZDF rat treatment groups (Fig. 1d). Metformin treated ZDF rats showed significantly (p < 0.05) higher levels of insulin release (1.54 ng/mL) when compared to ZDF controls. Also BTE induced an increase of insulin release although to a lesser degree as compared to metformin and in a non-significant manner. We also quantified glycated hemoglobin (HbA1c) in our treatment groups on day 1 and day 30 (data not shown). The lean control group showed significant lower levels of HbA1c on day 1 as well as after 30 days as compared to ZDF vehicle controls (p < 0.001). Both concentrations of BTE but also metformin did not significantly affect HbA1c levels after 30 days of treatment as compared to the ZDF controls (data not shown).
3.4. Effects of BTE on fat metabolisms
Significantly higher adiponectin levels were determined in plasma derived from the lean control group (11.6 ug/mL) as compared to ZDF controls (6.7 ug/mL), but not in the metformin and BTE treated animals after 30 days (Fig. 2a). There was a significant reduction (p < 0.001) in the levels of triacylglycerols (TGs) in the lean control animals (around 70 mg/dL) when compared to the ZDF control animals (around 435 mg/dL). Also ZDF rats receiving BTE showed a decline in levels of triacylglycerols (Fig. 2b). Interestingly, lower concentrations of BTE were more effective (p < 0.01) than higher concentrations (p < 0.05). Free fatty acids (FFA) were reduced in plasma derived from lean control rats (p < 0.01) as compared to the ZDF rats (Fig. 2c). BTE treatment induced a dose-dependent increase in FFAs with significant effects at high concentrations (p < 0.05) in correlation to the decline in TGs (Fig. 2b). No major changes in FFAs were observed in metformin treated animals. Fasting cholesterol and HDL, but not LDL, were significantly reduced in the lean control group compared with ZDF control rats (Figs. 2d–f). No significant differences in cholesterol, HDL and LDL were observed for metformin treated ZDF rats. However, whereas no changes were observed for cholesterol, BTE affected HDL and LDL with a significant decline in LDL (p < 0.05) in response to high concentrations (Fig. 2e).
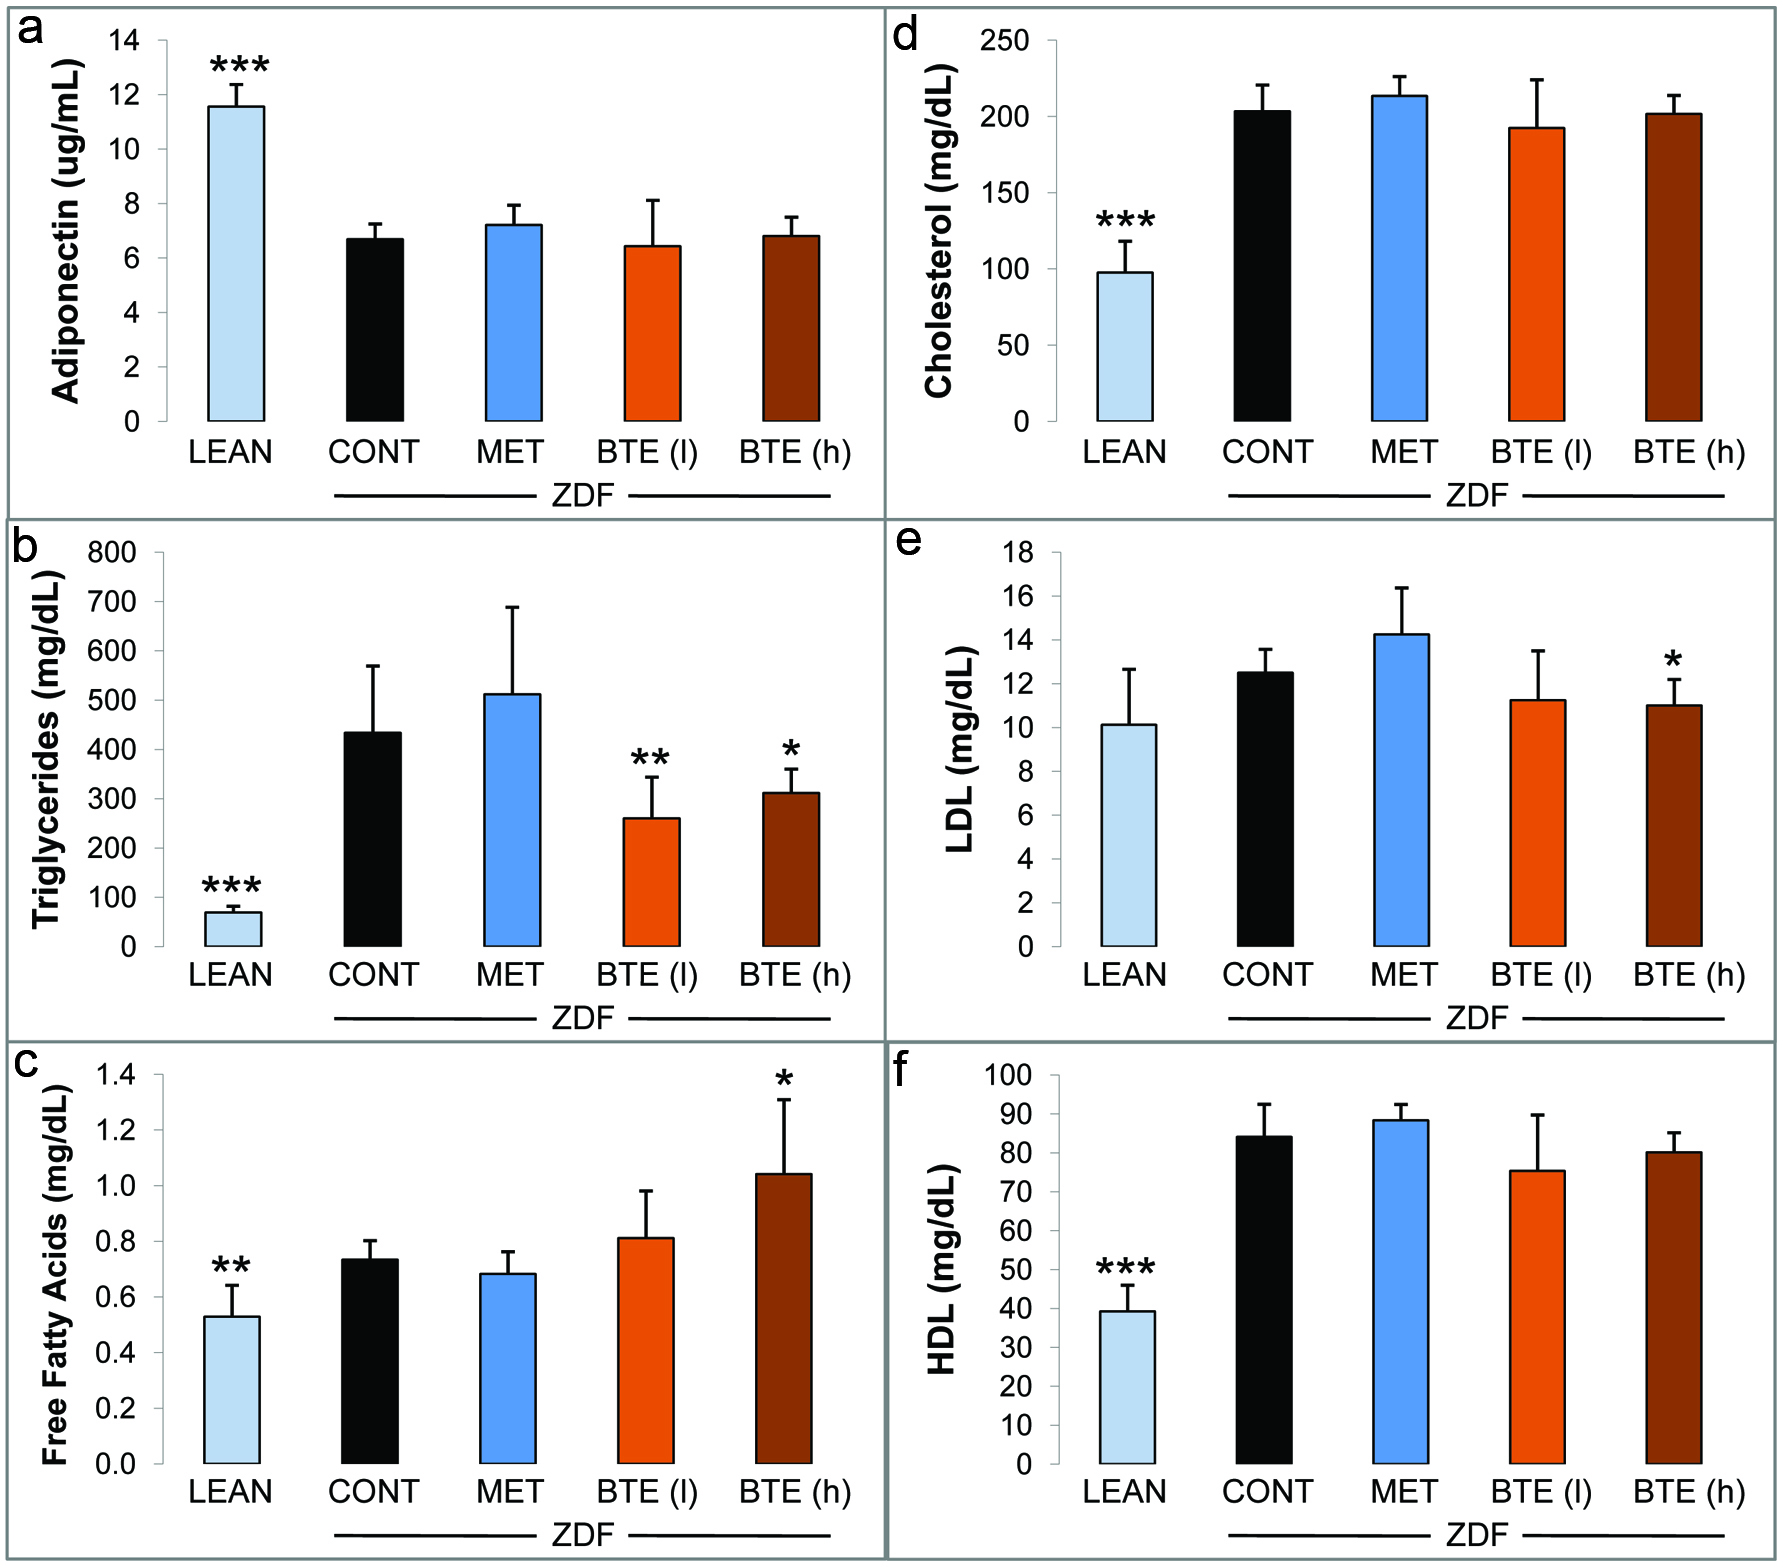 Click for large image | Figure 2. Effects of BTE and metformin on levels of lipid-related mediators. |
3.5. Effects of BTE on inflammation in fat tissue and whole blood
Due to a link between obesity and systemic inflammation, we next analyzed the expression of inflammatory genes in blood and epididymal adipose. A panel of six cytokines in whole blood was quantified by ELISA analysis as a measure for systemic inflammation (Fig. 3). IL-4, IL-10, and IL-13 are involved in the reduction of the inflammatory response through inhibition of NFκB signaling and cytokine release from macrophages. IL-6 and IFN-γ possess both pro-inflammatory and anti-inflammatory properties, whereas TNF-α is a pro-inflammatory cytokine (Chawla et al., 2011; Donath, 2014; Ouchi et al., 2011). IL-4 was significantly increased in lean controls (p < 0.01) and ibuprofen treated ZDF rats (p < 0.05) as compared to ZDF controls (Fig. 3a). Treatment with BTE induced a dose-dependent increase of IL-4 in a significant manner (p < 0.01). Noteworthy, levels of IL-4 were higher in the group treated with low concentrations of BTE (e.g., 250mg/kg) as compared to lean controls and the ibuprofen control group. IL-6 showed increased levels throughout all groups compared to ZDF controls indicating an anti-inflammatory role (Fig. 3b). Although the increase observed in lean controls and the ibuprofen group was in the non-significant range, BTE induced a prominent upregulation of IL-6 levels at low concentrations (p < 0.001). A similar pattern was observed for IL-10 plasma levels. Only marginal and non-significant increases were measured in lean controls and ibuprofen treated rats (Fig. 3c). However, BTE induced a significant dose-dependent increase in IL-10 (e.g., p < 0.01 and p < 0.001, respectively). IL-13 levels increased in response to ibuprofen treatment in ZDF rats (p < 0.05), whereas the increase in the lean control group was non-significant (Fig. 3d). Again, BTE induced a higher increase of IL-13 as compared to the ibuprofen group with p < 0.001 and p < 0.05 for low and high concentrations, respectively. Marginal increases in IFN-γ were observed for lean controls and the ibuprofen group. However, BTE induced a dose-dependent increase of IFN-γ with strong effects (p < 0.001) starting at low concentrations (250 mg/kg). For TNF-α we did not observe a major regulation in lean controls and in response to ibuprofen. BTE treatment induced even higher levels of TNF-α although also in a non-significant manner (Fig. 3f).
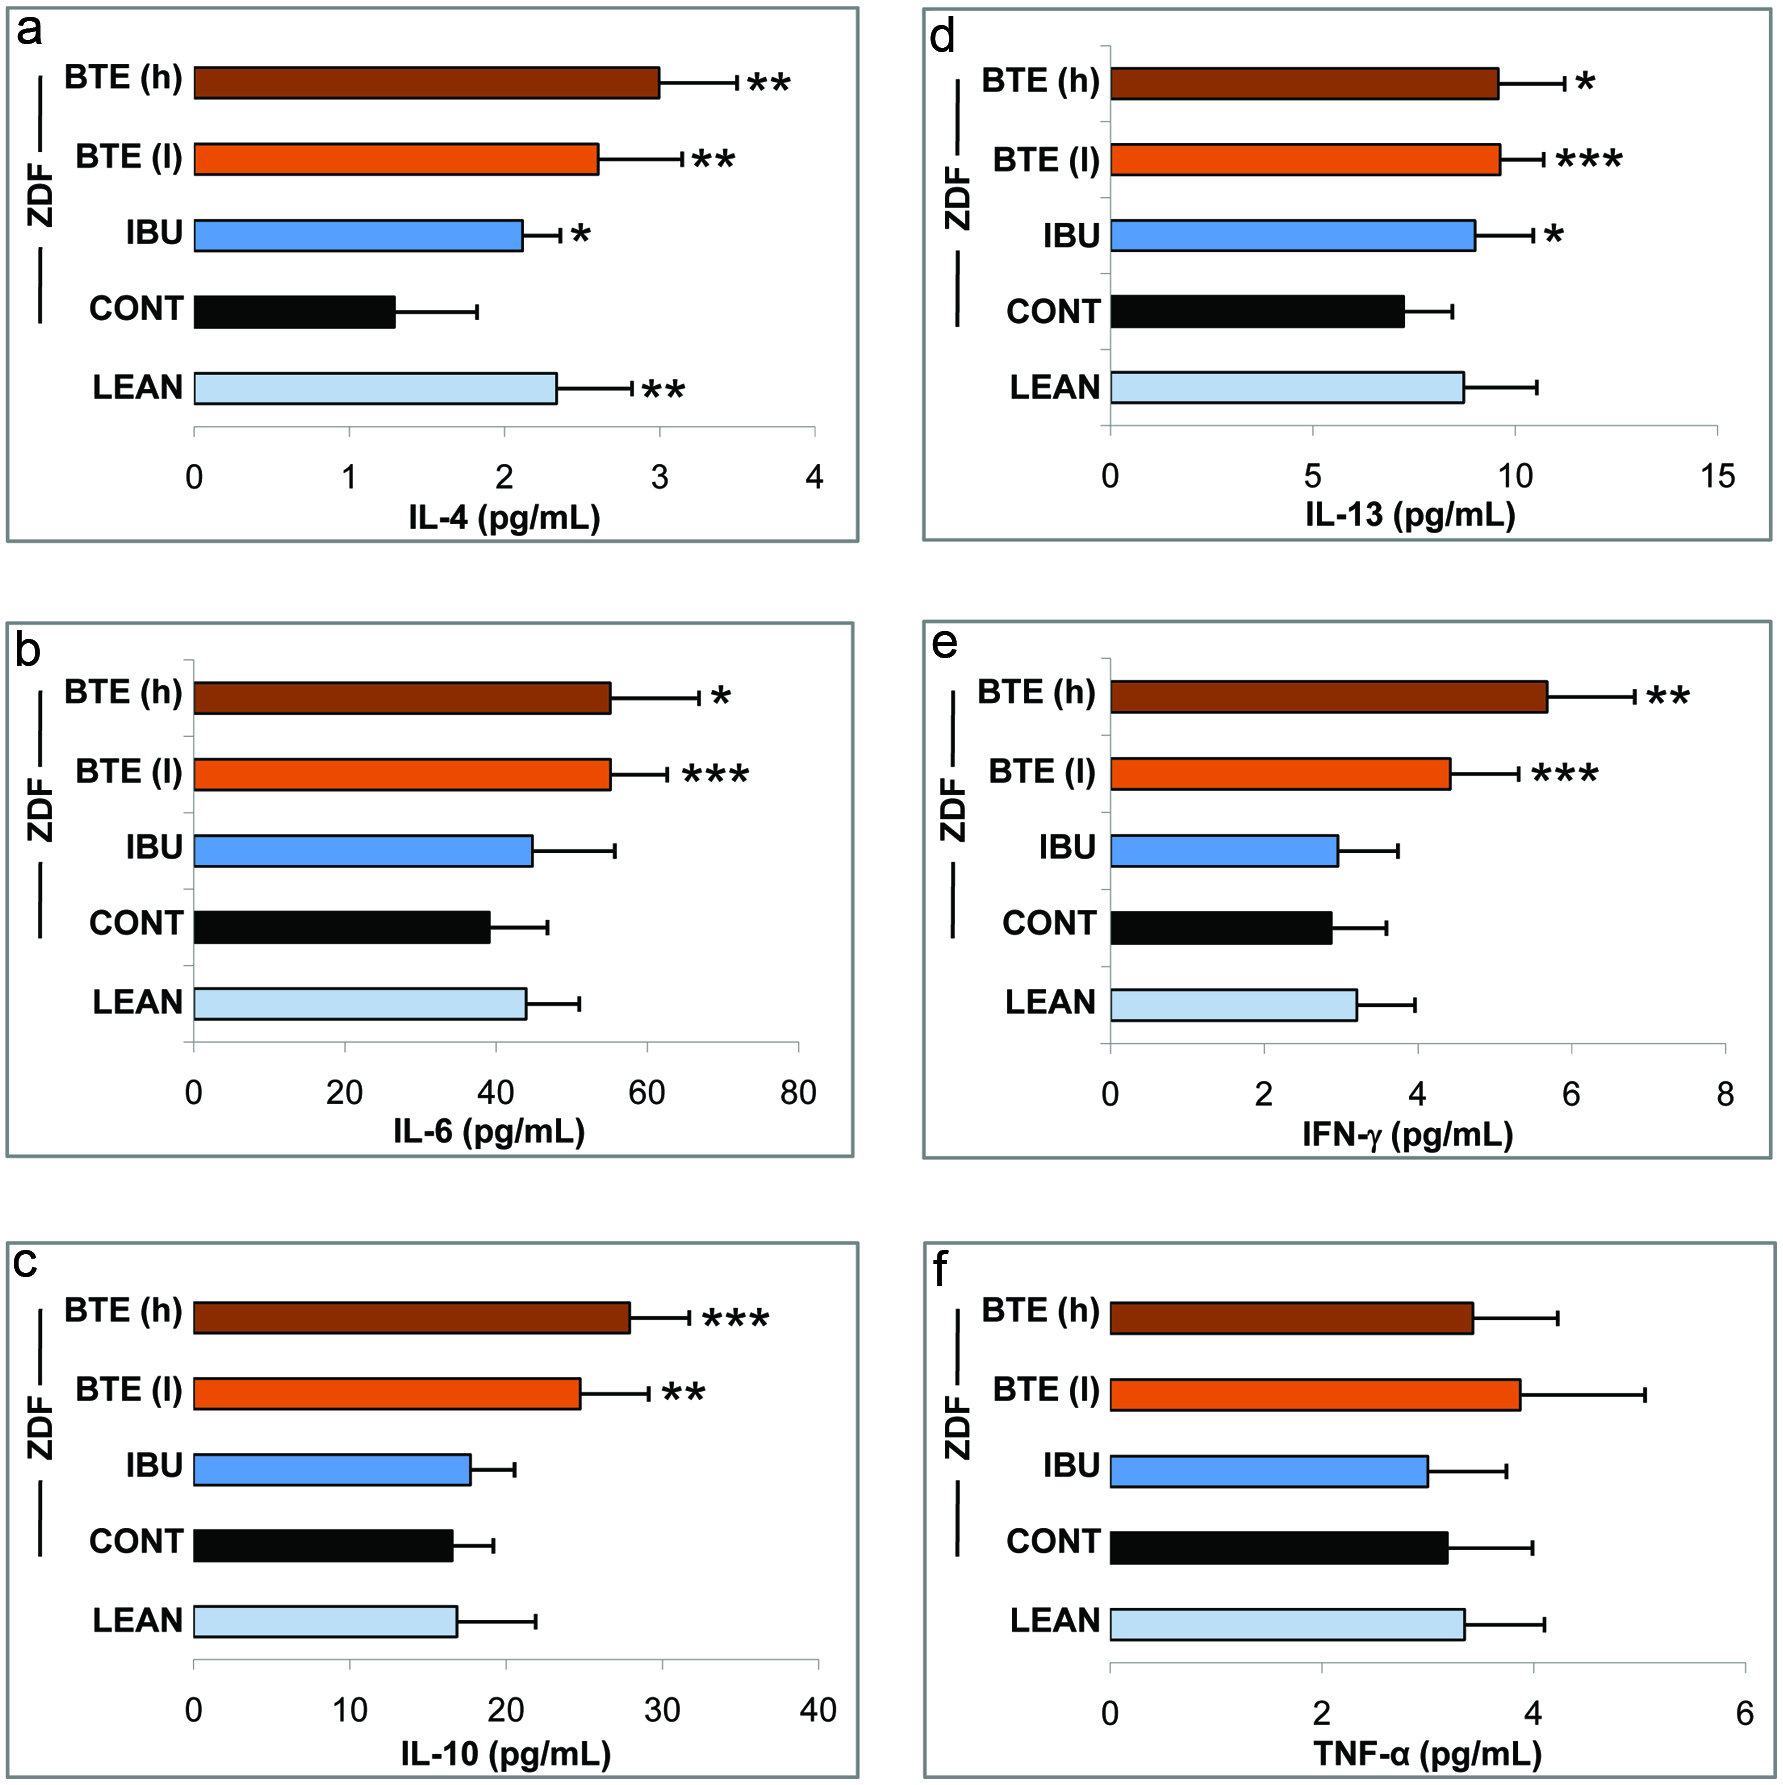 Click for large image | Figure 3. Effects of BTE and ibuprofen on levels of inflammatory cytokines. |
In the next set of experiments, we quantified the expression of a subset of inflammatory genes in whole blood (Fig. 4a) and epididymal adipose tissue (Fig. 4b): cyclooxygenase-2 (COX-2), intracellular adhesion molecule-1 (ICAM-1), interleukin-1β (IL-1β), interleukin-6 (IL-6) and tumor necrosis factor-α (TNF-α) by TaqMan qPCR analysis. Gene expression levels were normalized to GAPDH (Delta ct values +/- SD indicated as “I”) or normalized to the ZDF controls (Delta delta ct values indicated as “II”) as described in Materials and Methods. The expression of COX-2 in blood derived from lean control rats was similar to that of ZDF control animals (Fig. 4a, I). The BTE group showed only a slight decrease in COX-2 expression in a non-significant manner. In contrast, ibuprofen treatment induced a significant down-regulation of COX-2 (p < 0.05), as demonstrated by higher delta ct values. Similarly, there were no differences for ICAM-1 between lean and ZDF controls. However, ZDF rats treated with BTE (p < 0.01) and to a higher degree with ibuprofen (p < 0.001) showed a strong down-regulation of ICAM-1. The BTE group also showed an inhibition of IL-1β but in a non-significant manner. However, in response to ibuprofen treatment levels of IL-1β were significant reduced as compared to ZDF controls (p < 0.05). IL-6 was significantly up-regulated in lean control rat blood (p < 0.05) but not in BTE or ibuprofen treated animals. Finally, a down-regulation of TNF-α was observed in all groups when compared to ZDF controls. Ibuprofen treated animals showed strongest effects (p < 0.001) as compared to lean controls and the BTE group (p < 0.05).
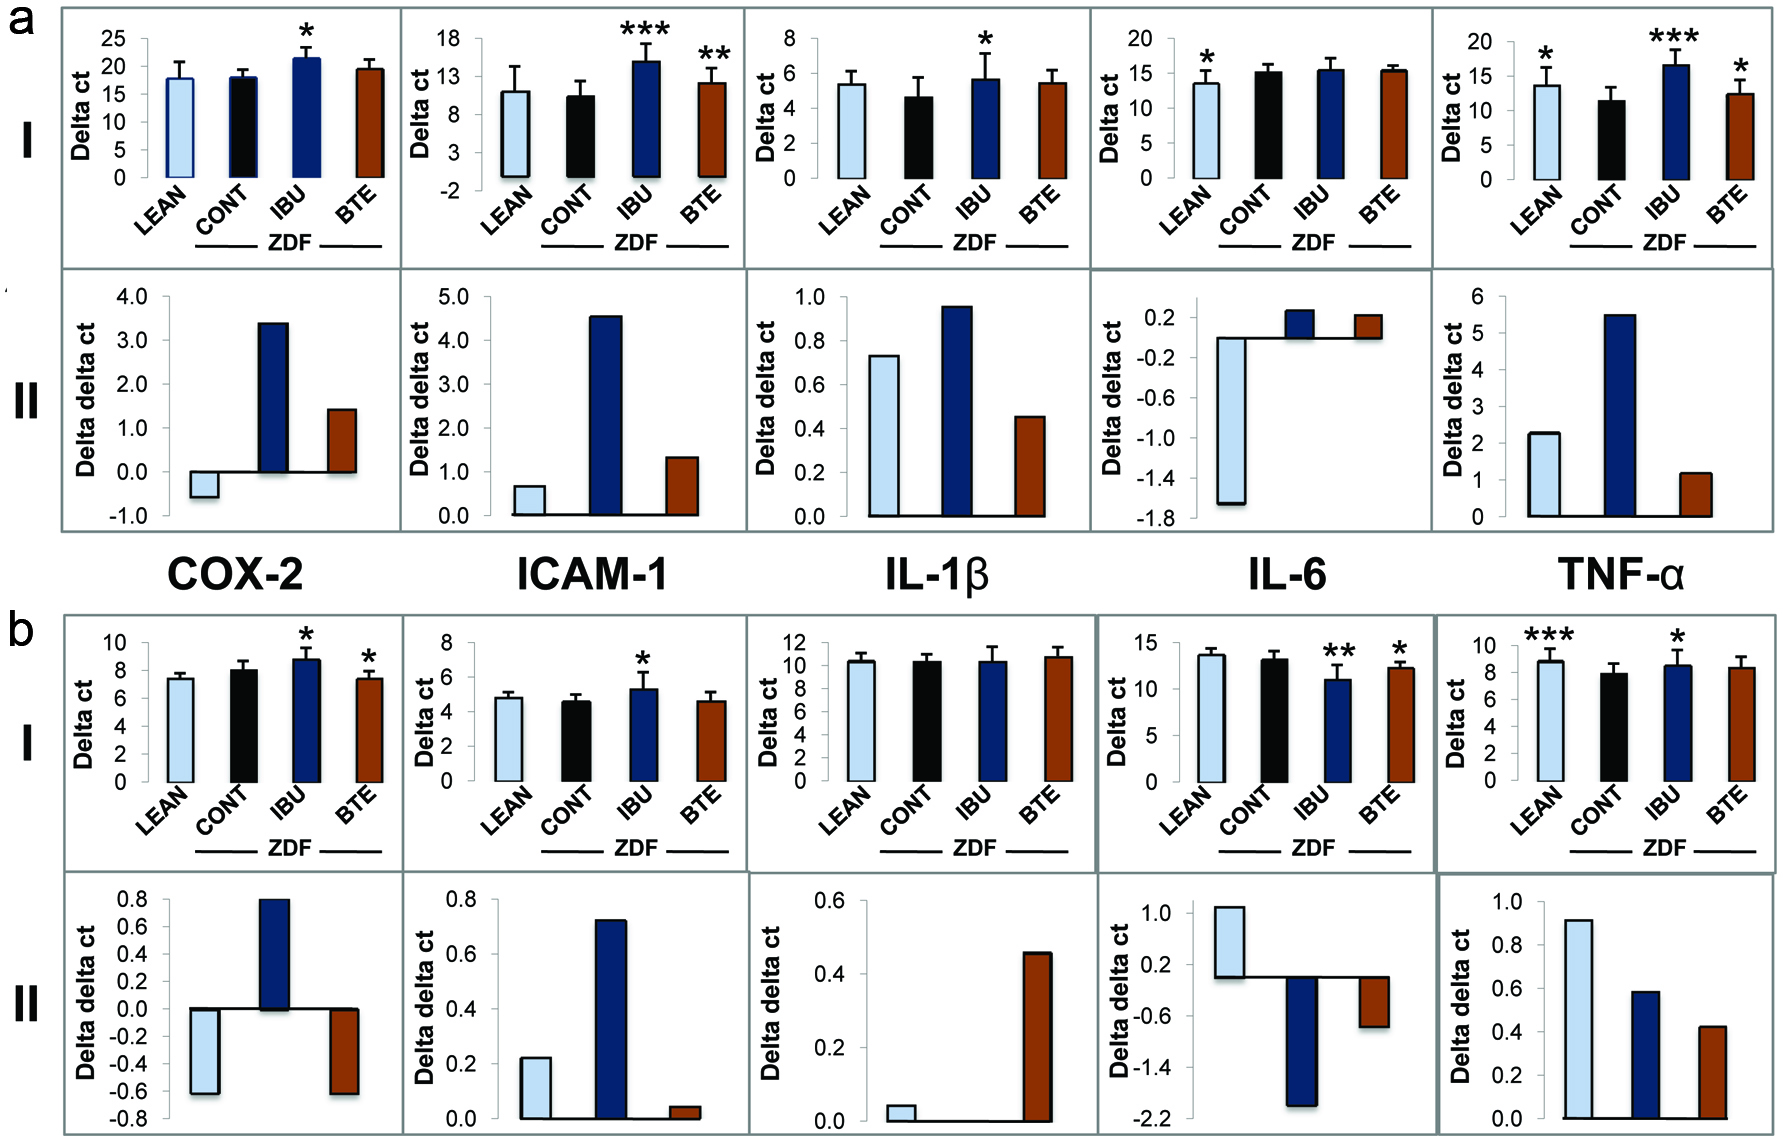 Click for large image | Figure 4. Effects of BTE and ibuprofen on the expression of inflammatory genes. |
The expression of COX-2, ICAM-1, IL-1β, IL-6 and TNF-α was then analyzed in epididymal fat tissue (Fig. 4b). COX-2 expression was significantly down-regulated in ibuprofen treated animals (p < 0.05) but not in fat tissue from the lean control group. ZDF rats treated with BTE induced a significant up-regulation COX-2 (p < 0.05). For ICAM-1, a similar pattern of gene regulation was observed in whole blood (A) and epididymal fat tissue (B) of lean controls and ibuprofen treated animals. Ibuprofen induced a downregulation of ICAM-1 although to a lesser level (p < 0.05) as compared to whole blood (p < 0.001). In contrast to whole blood analysis, BTE did not affect ICAM-1 expression. No differences throughout the treatment groups were observed for IL-1β expression in fat tissue. The regulation of IL-6 was different in fat tissue as compared to blood. Ibuprofen treatment significantly upregulated IL-6 (p < 0.01). An upregulation of IL-6 was also observed for BTE although to a lesser degree (p < 0.05), whereas the effects in lean controls were not significant. As observed for whole blood, TNF-α was down-regulated in lean control animals as compared to the ZDF controls but to a larger degree (p < 0.001). Again, ibuprofen treatment significantly down-regulated TNF-α expression in epididymal fat (p < 0.05), although this effect was greater in whole blood. On the other hand, the effects of BTE in adipose tissue were non-significant.
| 4. Discussion | ▴Top |
Our study investigated the effects of a theaflavin-enriched black tea extract on the inflammatory response in obesity and T2D pathogenesis using the ZDF rat model. ZDF rats express a mutant leptin receptor and thus authenticate obesity as a leading cause for T2D and damaging effects on various organs (Phillips et al., 1996). These animals have significantly higher body weight, BMI and food intake with higher plasma levels of glucose in the absorptive and post absorptive states, as compared to lean control rats. In addition, ZDF animals have significantly higher HbA1c levels, triglycerides, free fatty acids, cholesterol, HDL, and slightly increased levels of LDL. Furthermore, the inflammatory cytokine TNF-α was upregulated in epididymal adipose tissue and plasma, confirming its central role in the adipocyte inflammatory cascade (Chawla et al., 2011; Donath, 2014; Goldfine et al., 2011; Ouchi et al., 2011). The role of IL-6 signaling in obesity-related insulin resistance has been controversial (Chen et al., 2015; Donath, 2014; McArdle et al., 2013; Ouchi et al., 2011). In contrast to studies showing elevated levels of IL-6 in blood of obese patients with T2D (Kado et al., 1999; Pradhan et al., 2001), we observed an upregulation of IL-6 in lean controls indicating an anti-inflammatory role in the ZDF model. The increased levels of adiponectin in lean controls is in accordance with earlier studies in patients with T2D, showing a negative correlation of plasma adiponectin with visceral fat (Mancuso, 2016; Ouchi et al., 2011). It is well established that a more favorable glycemic, lipidemic as well as inflammatory profile in a normal weight population can have a positive impact on human health. These relationships are evident in studies showing that caloric restriction can induce an extension of life span in mammals (Sohal and Weindruch, 1996). Several studies demonstrated that black tea polyphenols causes weight loss by mechanisms of enhanced lipid metabolism through AMP-activated protein kinase (AMPK) signaling (Rothenberg et al., 2018). In our study, BTE treatment also caused a reduction of weight gain which corresponded to a significant decline in levels of triglycerides and LDL, paralleled by an increase in FFAs. In previous studies, positive effects against dyslipidemia by BTE had been demonstrated by a decrease in cholesterol, LDL and triglycerides and/or increase in HDL or theaflavins (Imran et al., 2018; Mahmoud et al., 2016; Miyata et al., 2013; Naveed et al., 2018; Ramadan et al., 2009).
Metformin is a widely used T2D drug which significantly decreased fasted blood glucose levels in ZDF rats and improved glucose tolerance. Hypoglycemic effects of metformin correlated to a higher insulin release. Some studies indicate that insulin may exert an anti-inflammatory response, independent of its effects on glycemia by mechanisms of NO release, and inhibition of NFκB signaling thus decreasing ICAM-1 and MCP-1 expression (Dandona et al., 2008; Sun et al., 2014). Our study showed pro-hyperglycemic effects by BTE as indicated by increased levels of fasted and fed glucose as well as lesser glucose tolerance, whereas levels of insulin were not changed significantly. This is in contrast to previous animal studies, where a decline in glucose as well as an increase in insulin sensitivity and glucose tolerance were demonstrated by the treatment with black tea extracts or theaflavins (Anderson and Polansky, 2002; Imran et al., 2018; Miyata et al., 2013; Ramadan et al., 2009). However, a double-blind randomized study with T2D patients showed no effects on HbA1c (Mackenzie et al., 2007) which reflect our observation where no changes of HbA1c were measured in the BTE group (data not shown). It is well accepted that systemic inflammation is causal in T2D development supported by clinical studies (Boutens and Stienstra, 2016; Calle and Fernandez, 2012; Chawla et al., 2011; Donath, 2014). Our study demonstrated strong effects of BTE against systemic inflammation as indicated by a significant down-regulation of ICAM-1 and TNF-α in whole blood. A decline of ICAM-1 might lower infiltration of monocytes or other leukocytes (Gu et al., 2013), whereas a decrease of TNF-α is involved in inhibition of NFκB signaling, thus lowering the expression of a variety of pro-inflammatory genes (Ghosh and Hayden, 2008). In addition, the BTE group showed an increase of IL-4, IL-6, IL-10, IL-13 and IFN-γ to higher levels as compared to ibuprofen. IL-4 represents a cytokine involved in the reduction of the inflammatory response by inhibiting cytokine release in macrophages, but also in M2 activation thus enhancing IL-10 release (Chawla et al., 2011; Donath, 2014; Lee, 2013; McArdle et al., 2013). IL-10 and IL-13 have anti-inflammatory effects through attenuation of NFκB signaling as well as inhibition of macrophages (Chawla et al., 2011; Lee, 2013; McArdle et al., 2013; Ouchi et al., 2011). IFN-γ had been demonstrated to have pleiotropic effects by activating NFκB signaling and macrophage stimulation as well as apoptosis, but also anti-inflammatory properties by mechanism of IL-1 receptor antagonist and IL-18 expression (Gosslau et al., 2011; Muhl and Pfeilschifter, 2003). The role of IL-6 in obesity-related T2D symptoms has been controversial since pro-inflammatory and anti-inflammatory properties have been demonstrated (Donath, 2014; Lee, 2013; McArdle et al., 2013; Ouchi et al., 2011). The upregulation of IL-6 in lean controls as well as in the ibuprofen and BTE group in our study, suggest an anti-inflammatory function in ZDF rats. Interestingly, only a few studies show evidence of COX-2 mediated inflammation in diabetes (Bagi et al., 2006; Helmersson et al., 2004; Kellogg et al., 2008). The significance of COX-2 in our study remains unclear: no major differences between COX-2 expression in lean and ZDF controls were found and the upregulation of COX-2 by BTE in adipose tissue is in contrast to a downregulation by ibuprofen in whole blood and adipose tissue.
Our study demonstrated strong effects of a theaflavin-enriched black tea extract against obesity-related inflammation. In addition, BTE treatment caused a reduction of weight gain which corresponded to positive effects against dyslipidemia. However, BTE induced pro-hyperglycemic effects. Although considered as an initial assessment, these results suggest a potential therapeutic application of BTE to decrease systemic inflammation and dyslipidemia as well as for weight reduction. A combination with other hypoglycemic therapeutics might be a promising strategy against type 2 diabetes in a population with epidemic obesity rates. Further studies in more predictable long-term and clinical settings are required to clarify the role of black tea and its bioactive theaflavins in the management of T2D.
Acknowledgments
This research was supported by the National Institute of Health grant R43/44 AT007889.
| References | ▴Top |