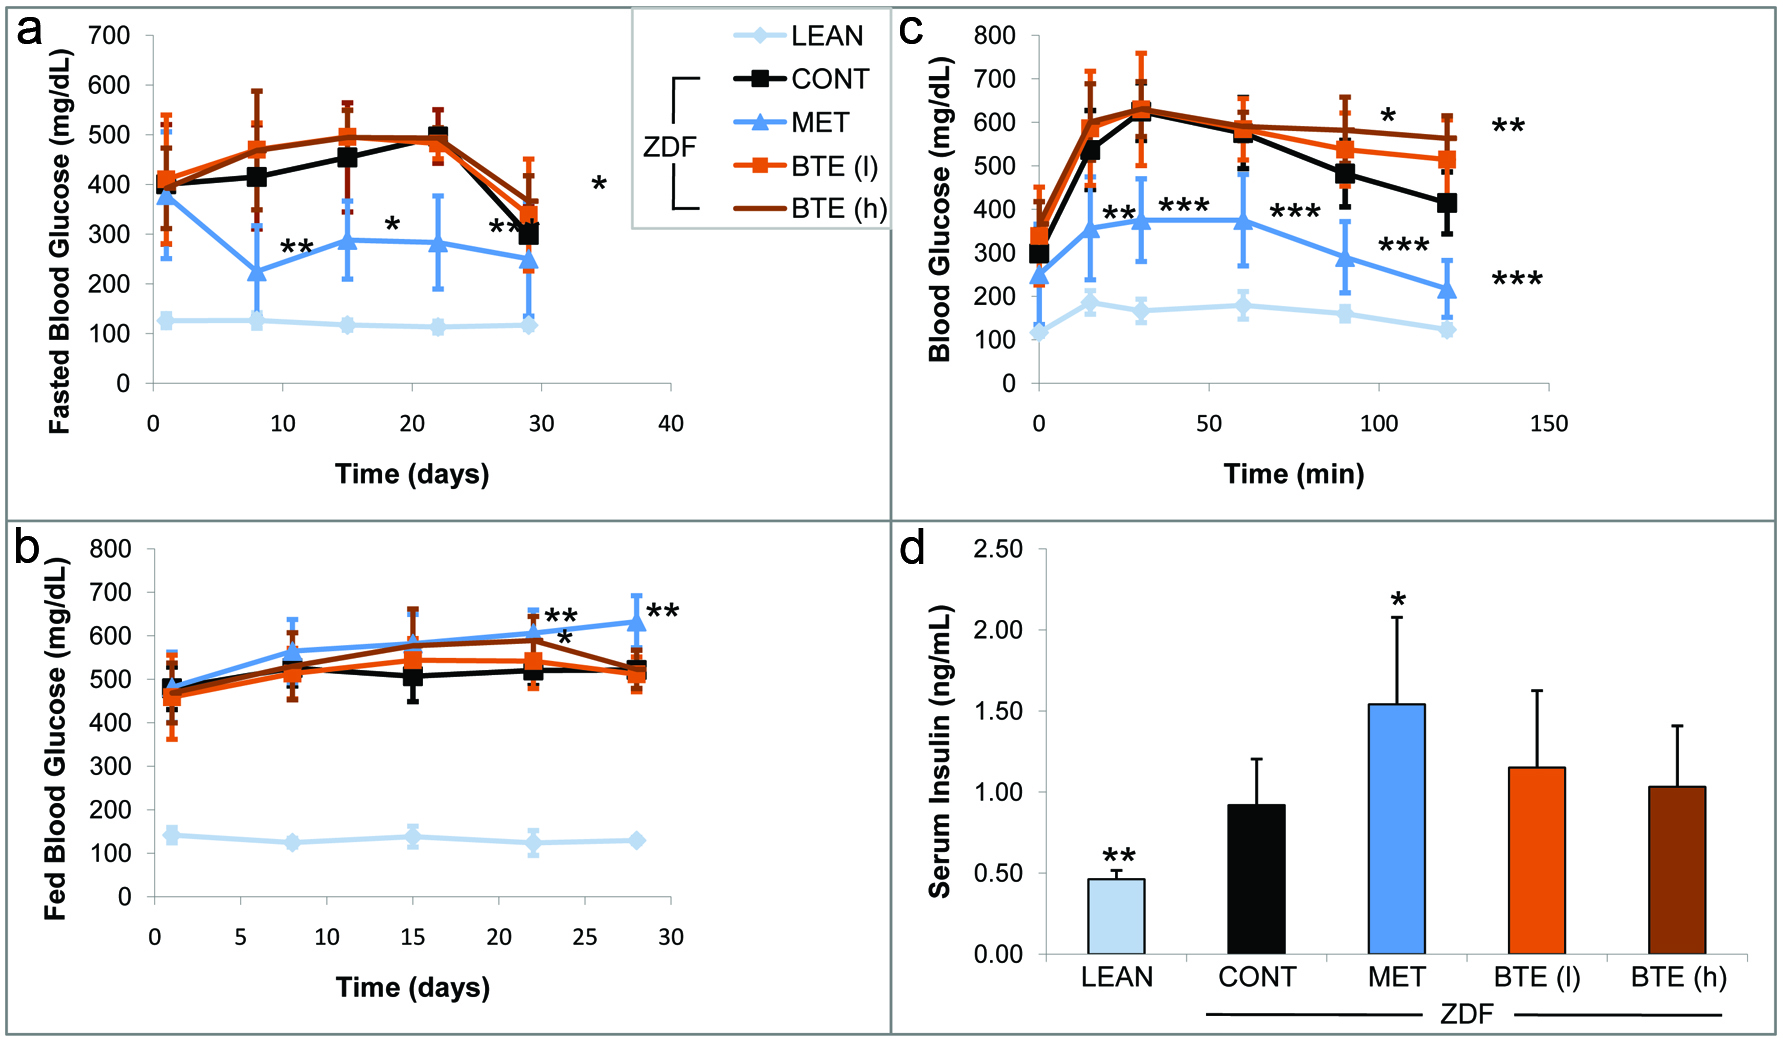
Journal of Food Bioactives, ISSN 2637-8752 print, 2637-8779 online
Journal website www.isnff-jfb.com

Original Research

Volume 3, Number , September 2018, pages 151-160


Anti-diabetic effects of a theaflavin-enriched black tea extract in the obese ZDF rat model

Figures

Figure 1.
Figure 1.

Effects of BTE and metformin on glucose-related parameters.

The effects of chronic treatment by BTE in low (l; light brown square) or high (h; dark brown line) concentrations and metformin (MET; blue triangle) were compared with the ZDF vehicle control group (CONT; black square) and lean controls (LEAN; light blue rhombus). (a) Animals were fasted for 5 hours and blood glucose levels were analyzed on day 1, 8, 15, 22 and 29 and expressed as mg/dL. (b) Normal fed blood glucose levels were analyzed and expressed as mg/dL. (c) On day 29 an oral glucose tolerance test (OGGT) was performed. All groups were treated with glucose (2 g/kg). After 15, 30, 60, 90 and 120 min blood glucose levels were determined as mg/dL. (d) Insulin levels were analyzed on day 30 and expressed as ng/mL. Mean values + standard deviation for the different treatment groups. *, **, and *** indicate significant differences from the ZDF vehicle control group with P < 0.05, 0.01 or 0.001, respectively.
Figure 2.
Figure 2.

Effects of BTE and metformin on levels of lipid-related mediators.

The effects of chronic treatment by BTE in low (l; light brown) or high (h; dark brown) concentrations, and metformin (MET; blue) were compared with the ZDF vehicle control group (CONT; black) after 30 days. Lean controls (LEAN) are indicated in light blue. (a) Levels of adiponectin were analyzed and expressed as ug/mL. (b) Levels of triglycerides were analyzed and expressed as mg/dL. (c) Levels of free fatty acids (FFA) were analyzed and expressed as mg/dL. (d) Levels of cholesterol were analyzed and expressed as mg/dL. (e) Levels of low density lipoproteins (LDL) were analyzed and expressed as mg/dL. (f) Levels of high density lipoproteins (HDL) were analyzed and expressed as mg/dL. Mean values + standard deviation for the different treatment groups. *, **, and *** indicate significant differences from the ZDF vehicle control group with P < 0.05, 0.01 or 0.001, respectively.
Figure 3.
Figure 3.

Effects of BTE and ibuprofen on levels of inflammatory cytokines.

The effects of chronic treatment by BTE in low (l; light brown) or high (h; dark brown) concentrations and ibuprofen (IBU; blue) were compared with the ZDF vehicle control group (CONT; black) after 30 days in whole blood by ELISA analysis. Lean controls (LEAN) are indicated in light blue. Levels of (a) interleukin-4 (IL-4), (b) interleukin-6 (IL-6), (c) interleukin-10 (IL-10), (d) interleukin-13 (IL-13), (e) interferon-γ (IFN-γ) and (f) tumor necrosis factor-α (TNF-α) were analyzed and expressed as pg/mL. Mean values + standard deviation for the different treatment groups. *, **, and *** indicate significant differences from the ZDF vehicle control group with P < 0.05, 0.01 or 0.001, respectively.
Figure 4.
Figure 4.

Effects of BTE and ibuprofen on the expression of inflammatory genes.

The effects of chronic treatment by BTE (brown) and IBU (blue) were compared with the ZDF vehicle control group (CONT; black) after 30 days in whole blood (a) or epididymal adipose tissue (b). Lean controls (LEAN) are indicated in light blue. After RNA isolation and reverse transcription, expression of either COX-2, ICAM-1, IL-1β, IL-1 and TNF-α was analyzed by TaqMan qPCR and expressed either according to the delta CT method (I) using GAPDH as internal control or the delta-delta CT method (II) compared to the ZDF vehicle controls as described in “Materials and Methods”. Mean values + standard deviation for the different treatment groups. *, **, and *** indicate significant differences from the ZDF vehicle control group with P < 0.05, 0.01 or 0.001, respectively.

Table

Table 1. Effects of BTE on weight and food intake
 
Body Weight_Day148111519222629
The effects of chronic treatment by BTE in low (l) or high (h) concentrations, respectively were compared with the ZDF vehicle control group (ZDF) and lean controls (LEAN). A) Effects on body weight were analyzed on day 1, 4, 8, 11, 15, 19, 22, 26 and 29 and expressed as means and SD in grams. B) Effects on food intake are expressed as means and SD in grams. C) Body mass index (BMI) was calculated by ratio of weight and square of length and expressed as means and SD. *, **, and *** indicate significant differences from the ZDF vehicle control group with P < 0.05, 0.01 or 0.001, respectively as analyzed by the students t-test.
LEAN_MEAN288.8295.3307.5313.3315.1322.8331.4337.5325.5
LEAN_SD15.014.616.817.016.216.118.219.016.5
ZDF_MEAN388.6384.0400.1400.5392.3399.4402.9408.4377.5
ZDF_SD19.525.522.723.327.223.326.125.128.4
BTE (L)_MEAN386.3378.3387.9389.8387.5385.5390.5393.8370.1
BTE (L)_SD16.926.324.924.530.133.732.332.430.5
BTE (H)_MEAN378.9374.0377.3 *380.9382.5387.3388.6387.3 *367.1
BTE (H)_SD13.817.516.517.218.216.518.114.415.8
Food Intake_Day8152228BMI_DAY18152229
The effects of chronic treatment by BTE in low (l) or high (h) concentrations, respectively were compared with the ZDF vehicle control group (ZDF) and lean controls (LEAN). A) Effects on body weight were analyzed on day 1, 4, 8, 11, 15, 19, 22, 26 and 29 and expressed as means and SD in grams. B) Effects on food intake are expressed as means and SD in grams. C) Body mass index (BMI) was calculated by ratio of weight and square of length and expressed as means and SD. *, **, and *** indicate significant differences from the ZDF vehicle control group with P < 0.05, 0.01 or 0.001, respectively as analyzed by the students t-test.
LEAN_MEAN169.1170.6145.9151.5LEAN_MEAN1.952.051.982.061.95
LEAN_SD11.746.66.316.4LEAN_SD0.080.110.100.120.10
ZDF_MEAN277.4292.4305.6289.4ZDF_MEAN2.612.632.462.522.37
ZDF_SD18.519.721.910.4ZDF_SD0.070.080.120.140.13
BTE (L)_MEAN276.8301.4296.3290.8BTE (L)_MEAN2.652.552.422.442.30
BTE (L)_SD29.513.935.625.5BTE (L)_SD0.090.160.090.110.12
BTE (H)_MEAN263.3317.0297.1288.1BTE (H)_MEAN2.642.502.472.492.34
BTE (H)_SD17.829.934.931.1BTE (H)_SD0.070.160.110.120.12