| Journal of Food Bioactives, ISSN 2637-8752 print, 2637-8779 online |
| Journal website www.isnff-jfb.com |
Original Research
Volume 3, September 2018, pages 111-123
Phytochemical characterization of Tabernanthe iboga root bark and its effects on dysfunctional metabolism and cognitive performance in high-fat-fed C57BL/6J mice
Bayissi Bading-Taikaa, b, Tunde Akinyekec, Armando Alcazar Maganad, e, Jaewoo Choie, Michael Ouanesisouke, Eileen Ruth Samson Torresc, Lisa A. Lionea, Claudia S. Maierd, Gerd Bobef, Jacob Raberc, g, h, Cristobal L. Mirandae, g, Jan F. Stevense, g, *
aDepartment of Clinical and Pharmaceutical Sciences, School of Life and Medical Sciences, University of Hertfordshire, UK
bInstitute of Pharmacopoeia and Traditional Medicine (IPHAMETRA), Libreville, Gabon
cDepartment of Behavioral Neuroscience, Oregon Health & Science University, Portland, OR 97239, USA
dDepartment of Chemistry, Oregon State University, Corvallis, OR 97331, USA
eLinus Pauling Institute, Oregon State University, Corvallis, OR 97331, USA
fDepartment of Animal & Rangeland Sciences, Oregon State University, Corvallis, OR 97331, USA
gDepartment of Pharmaceutical Sciences, Oregon State University, Corvallis, OR 97331, USA
hDepartments of Neurology and Radiation Medicine, Division of Neuroscience, ONPRC, Oregon Health & Science University, Portland, OR 97239, USA
*Corresponding author: Jan F. Stevens, Linus Pauling Institute, Oregon State University, Corvallis, OR 97331, USA
DOI: 10.31665/JFB.2018.3154
Received: May 14, 2018; Revised received & accepted: August 17, 2018
| Abstract | ▴Top |
Preparations of the root bark of Tabernanthe iboga have long been used in Central and West African traditional medicine to combat fatigue, as a neuro-stimulant in rituals, and for treatment of diabetes. The principal alkaloid of T. iboga, ibogaine, has attracted attention in many countries around the world for providing relief for opioid craving in drug addicts. Using a plant metabolomics approach, we detected five phenolic compounds, including 3-O-caffeoylquinic acid, and 30 alkaloids, seven of which were previously reported from T. iboga root bark. Following a report that iboga extracts contain insulinotropic agents, we aimed to determine the potential alleviating effects of the water extract of iboga root bark on high-fat diet (HFD)-induced hyperglycemia as well as its effects on cognitive function in male C57BL/6J mice. Feeding a HFD to mice for 10 weeks produced manifestations of metabolic syndrome such as increased body weight and increased plasma levels of glucose, triacylglycerols, total cholesterol, LDL-cholesterol, insulin, leptin, and pro-inflammatory mediators (IL-6, MCP-1, ICAM-1), as compared to mice fed a low-fat diet (LFD). Supplementation of HFD with iboga extract at ibogaine doses of 0.83 (low) and 2.07 (high) mg/kg/day did not improve these HFD-induced metabolic effects except for a reduction of plasma MCP-1 in the low dose group, indicative of an anti-inflammatory effect. When the HFD mice were tested in the water maze, the high-dose iboga extract caused hippocampus-dependent impairments in spatial learning and memory, as compared to mice receiving only a HFD.
Keywords: Alkaloids; 3-O-caffeoylquinic acid; Cognitive function; Diabetes; Ibogaine
| 1. Introduction | ▴Top |
In traditional medicine practiced in Central and West Africa, including Gabon, preparations of the root bark of Tabernanthe iboga (Apocynaceae) have been used for their hallucinogenic, neuro-stimulant and anti-fatigue properties (Goutarel et al., 1993). Traditional healers in the province of Estuaire (Gabon) use the air-dried root bark or its maceration for treatment of diabetes (Souza et al., 2011). Mechanistic studies of iboga extracts suggest a potential use for management of diabetes mellitus (Souza et al., 2011; Bading-Taika et al., 2018), which represents one of the most prevalent metabolic disorders resulting from defects in insulin secretion, insulin action, or both. This metabolic disorder leads to microvascular (retinopathy, neuropathy and nephropathy) and macrovascular (heart attack, stroke and peripheral vascular disease) complications (Umar et al., 2010). Worldwide, the number of individuals with diabetes is increasing due to population growth, and it is expected that about 366 million people are likely to have developed diabetes by the year 2030 (Wild et al., 2004). Diabetes mellitus is classified into two major types. Type 1 diabetes (previously known as insulin-dependent, juvenile or childhood-onset) is characterized by deficient insulin production that is not preventable and requires insulin injection. Type 2 diabetes (formerly called non-insulin-dependent or adult-onset) results from the body’s ineffective use of insulin and is largely the result of excess body weight and physical inactivity. Type 2 diabetes is the more prevalent form and is manageable by anti-diabetic drugs and by changes in life style such as exercise, diet, and maintaining a healthy body weight. However, many of the various drugs prescribed for type 2 diabetes have significant risks of adverse effects. For instance, the anti-diabetic thiazolidinediones (glitazones) promote de novo lipogenesis and can exert long-term adverse side effects including increased body weight and cardiovascular toxicity (Zito, 2013). A meta-analysis of 42 trials linked rosiglitazone (Avandia®) to a 43% increased risk of heart attack (p = 0.03) (Nissen and Wolski, 2007; Nissen, 2010). These findings strongly underscore the need for safer alternative intervention agents. Several bioactives of plant origin exhibit anti-diabetic activity or insulin mimetic activity. They include polyphenols, tannins, alkaloids, carbohydrates, terpenoids, coumarins, steroids and flavonoids (Atta Ur and Zaman, 1989; Firdous, 2014; Patel et al, 2012; Bading-Taika et al., 2018).
The root bark of T. iboga and its preparations are used in Gabonese traditional medicine combating fatigue, hunger, and AIDS in Central and West Africa (Goutarel et al., 1993; Souza et al., 2011) but their active principles are not fully identified or characterized. Aqueous extracts of T. iboga contain insulinotropic compounds that stimulate insulin secretion in rat pancreatic islets of Langerhans by blocking the ATP-sensitive K+ channels, thereby causing calcium influx through voltage-sensitive Ca2+ channels (Souza et al., 2011), similar to the actions of sulfonylureas, a class of mainstream type 2 diabetic drugs. Moreover, ibogaine, the principal alkaloid of T. iboga, acutely increases respiratory activity and energy (ATP) expenditure and it induces an antioxidant stress response in rats (Paškulin et al., 2012), all of which would be beneficial in the prevention or treatment of type 2 diabetes. Ibogaine is a psychoactive alkaloid used worldwide in the treatment of drug and alcohol addiction despite its neurotoxic and cardiotoxic properties (Litjens and Brunt, 2016), raising concerns about its use in other applications. The oral LD50 of ibogaine in mice is 263 mg/kg of body weight (Kubiliene et al., 2008). Various non-alkaloid phytochemicals present in T. iboga may exert hypoglycemic activities. In addition, iboga phytochemicals may ameliorate type 2 diabetes by non-pancreatic mechanisms, such as preventing weight gain, the most important risk factor of the disease, and improving muscle-dependent insulin resistance (Gonzalez-Castejon et al., 2011). To date, there is insufficient scientific information regarding the appropriate range of doses for iboga extract as a remedy for diabetes, metabolic syndrome, or even for treatment of opioid drug dependence (Schep et al., 2016).
In traditional medicine, T. iboga, has long been used in the form of air-dried root bark or macerated root bark (Goutarel et al., 1993). Indigenous people in Gabon ingest preparations of the root bark of this plant during religious rituals for its psychoactive properties. Iboga preparations or the main alkaloid, ibogaine, are currently also used for treating addiction to drugs (morphine, heroin, methadone and oxycontin) and opiate withdrawal symptoms (Alper et al., 1999). The major mechanism of action of ibogaine appears to be its ability to bind to multiple binding sites within the central nervous system (CNS), such as N-methyl-D-aspartate (NMDA), receptor coupled ion channels, κ-opioid (κ1 and κ2), μ-opioid and σ2, serotonin (5-HT2 and 5-HT3), muscarinic (M1 and M2) receptors, monoamine oxidase receptors, and nicotinic acetylcholine receptors (Maciulaitis et al., 2008). Ibogaine activates the glial cell line—derived neurotrophic factor (GDNF) pathway in the ventral segmental area of the brain (Maciulaitis et al., 2008).
The overall objective of this study was to determine whether dietary administration of T. iboga extracts can mitigate hyperglycemia in male C57BL/6J mice, a mouse model that develops obesity, hyperglycemia, and glucose intolerance/insulin resistance when fed a HFD (Miranda et al., 2016). Using this HFD-induced obese mouse model, we have previously shown that oral treatment with xanthohumol, a hop flavonoid, for 12 weeks attenuates weight gain and decreases fasting plasma levels of glucose, total triglycerides, insulin, leptin, IL-6, and low-density lipoprotein cholesterol (LDL-C) in a dose-dependent manner (Miranda et al., 2016). We also investigated the effects of iboga extract feeding on cognitive performance in the water maze.
| 2. Experimental design and methods | ▴Top |
2.1. Preparation of iboga extract
Root bark of T. iboga was provided by the Institute of Pharmacopoeia and Traditional Medicine (IPHAMETRA) in Libreville, Gabon. Iboga extract for the mouse feeding study was prepared by the method of Sadoon et al. (2014). In short, root bark chips were ground using a coffee grinder to obtain a fine powder. The powder (50 g) was macerated in water with magnetic stirring for 24 h at room temperature. The slurry was filtered and the residue rinsed twice with water. The water extract was adjusted to pH 9 with ammonium hydroxide and then extracted five times with chloroform in the fume hood. Anhydrous sodium sulfate was added to the combined chloroform extracts and the chloroform layer was filtered before drying under vacuum using a rotary evaporator to obtain 4 g of a dry residue. The residue (iboga extract) was characterized by liquid chromatography in combination with mass spectrometry (LC-MS/MS), using the facilities of the Mass Spectrometry Center at Oregon State University, and used for preparing the iboga-fortified diet.
2.2. Measurement of ibogaine concentration in iboga bark by liquid chromatography-tandem mass spectrometry (LC-MS/MS)
A Shimadzu Prominence HPLC system (Shimadzu, Columbia, MD, USA), consisting of two LC-20AD pumps, a DQU-20A degasser, and an SIL-HTC autosampler, was used for chromatography of the iboga extract. The autosampler and column oven temperature were maintained at 10 and 40 °C. Chromatographic separation of ibogaine was achieved on an Agilent Poroshell 120 EC-C8 column (2.1 × 50 mm, 2.7 µm) eluted with solvent A (water with 0.1% formic acid) and B (acetonitrile with 0.1% formic acid). The solvent gradient started at 10% B at 0–0.5 min, changed to 24% B at 5.5 min, and then to 100% B at 6 min, to 10% B at 6.1 min, and then the column was equilibrated with 10% B until 9.1 min. The injection volume was 5 µL and the mobile phase flow was 200 µL/min. The column effluent was introduced into the electrospray ionization source of an Applied Biosystems 4000 QTRAP hybrid linear ion trap-triple quadrupole instrument (Sciex, Concord, ON, Canada) operated at a source temperature of 400 °C with a needle voltage of 5 kV in the positive ion mode. Nitrogen was used as the source gas (40 psi) and curtain gas (30 psi). Multiple reaction monitoring (MRM) experiments were conducted with the collision energy set at 50 V, the collision cell exit at 9 psi, and the de-clustering potential set at 60 V. Ibogaine was detected using multiple reaction monitoring, using m/z 311.4 > 174.1 as the qualifier transition and m/z 311.4 > 122.1 as the quantifier transition. The concentration of ibogaine in the bark extract was determined by the external calibration method using a standard of ibogaine obtained from Cambridge Chemicals (Woburn, Massachusetts, U.S.A.).
2.3. LC-MS detection of other phytochemicals in T. iboga root bark
Pieces of iboga root bark were ground to a fine powder by using a coffee grinder. Ten milligrams of bark powder were extracted with 10 mL of 70% aqueous methanol (v/v) by sonication for 30 min at 25 °C. After sonication, the extract was centrifuged at 15,000 rpm for 10 min. Chromatographic separation was conducted using a Shimadzu Nexera UPLC system equipped with an Inertsil Phenyl-3 column (150 × 4.6 mm, 5 µm). The injection volume was 10 µl. Mobile phase A was water with 0.1% formic acid, and mobile phase B was methanol with 0.1% formic acid. The gradient started with 5% B and was held for 1 min at 5% B, followed by a 10-min linear gradient from 5% to 30% B. The gradient was increased linearly to 100% B at 20 min, held for 10 min at 100% B and, finally, stepped back to 5% B to equilibrate the column. The flow rate was 0.4 mL min−1, with the auto-sampler set at 10 °C, and the column temperature was maintained at 50 °C. The column effluent was introduced into a QToF mass spectrometer (AB Sciex Triple TOF 5600) equipped with a TurboSpray electrospray ionization source operated in the negative and positive ionization modes. The instrument was operated in the information-dependent acquisition (IDA) mode using a collision energy of 35 V. For analysis of phenolic compounds, compound identification was based on accurate mass, isotopic similarity, retention time and MS/MS spectral comparison with authentic compounds. A targeted analysis was performed for 1,3-di-O-caffeoylquinic acid, 1,5-di-O-caffeoylquinic acid, 3,4-di-O-caffeoylquinic acid, 3,5-di-O-caffeoylquinic acid, 3-O-caffeoylquinic acid, 4,5-di-O-caffeoylquinic acid, 4-O-caffeoylquinic acid, 5-O-caffeoylquinic acid, caffeic acid, catechin, dihydrocaffeic acid, dihydroferulic acid, dihydroisoferulic acid, epicatechin, epigallocatechin, ferulic acid, isoferulic acid, kaempferol, naringin, quercetin and rutin. An external calibration curve was prepared for all precursor ions (Calibration points: 0.05, 0.1, 0.5, 1.0, 5.0 mg L−1, R values >0.995).
2.4. Qualitative analysis of iboga extract
For qualitative (untargeted) analysis, LC-MS/MS data were acquired on the AB Sciex Triple TOF 5600 system using the same chromatographic separation. In order to detect alkaloids as protonated molecular species, MS acquisition was performed in the positive ionization mode. Raw data were processed by using Progenesis QI software (NonLinear Dynamics, Newcastle upon Tyne, UK). Progenesis QI is a bioinformatics tool for small molecule discovery and analysis. Over 6,300 raw mass spectra were collected. Metabolites were assigned by extensive querying and comparison of molecular features, namely accurate mass (m/z), MS/MS fragmentation pattern, and isotopic similarity, against MetlinTM MS/MS, HMDB (Wishart et al., 2018), KEGG and KnapSack databases. In the Progenesis QI workflow, we considered a confidence score higher than 50 sufficient for assignment of constituents in the iboga extract. A score higher than 50 for a putative compound is reached when the deviation of the accurate mass from the exact mass is lower than 5 ppm combined with an isotopic pattern similarity >90%.
2.5. Animal studies
The animal studies were conducted with the approval from the Institutional Animal Care and Use Committee of Oregon State University, Corvallis, Oregon, USA. Animal experiments were carried out in accordance with the relevant guidelines and regulations. The HFD contained 60%, 20% and 20% total calories from fat, carbohydrate and protein, respectively. This HFD diet has been shown to induce obesity and metabolic syndrome in male C57BL/6J mice (Miranda et al., 2016). The LFD contained 10%, 70% and 20% total calories from fat, carbohydrate and protein, respectively. Both diets were obtained from Dyets Inc., Bethlehem, PA, USA. The HFD was fortified with iboga extract on a weekly basis by dissolving a calculated amount of extract in a small volume of ethanol for incorporation into the diet, so that it would provide an ibogaine dose of 0.83 (low dose) or 2.08 mg/kg body weight per day. To obtain a daily dose of 2.08 mg ibogaine/kg body weight, a mouse weighing 23.8 g was provided a total dose of 49.5 µg of ibogaine. The amount of iboga extract containing 49.5 µg ibogaine was dissolved in ethanol and mixed with 2.5 g of diet that the mouse would consume per day. The ethanol in the pellets of diet was allowed to evaporate in a fume hood. The fortified amount of iboga extract was adjusted each week based on the previous week’s body weight and food intake.
Male C57BL/6J mice, 8 weeks of age, were purchased from The Jackson Laboratory, Bar Harbor, ME, USA, and maintained on a 12 h dark/light cycle and fed a regular mouse chow diet. After 1 week of acclimation, the mice were randomly assigned into 4 groups of 12 animals, namely: Group 1, LFD normal control; Group 2, HFD control; Group 3, HFD + low-dose iboga (0.83 mg ibogaine/kg body weight/day); and Group 4, HFD + high-dose iboga (2.07 mg ibogaine/kg body weight/day). Each mouse was housed individually in labeled plastic cages with bottled tap water in plastic containers and fed their respective diets ad libitum. Body weights were recorded weekly. Food intake was monitored daily during the 10-week feeding study.
During the 4th and 9th week of the study, a glucose tolerance test (GTT) was performed. Five C57BL/6J mice in each treatment group were fasted for 4 h and given an intraperitoneal (i.p.) injection of D-glucose (2 g/kg body weight). A drop of blood was collected from a tail prick at 0, 30, 60, 90 and 120 min after the glucose bolus injection for measuring glucose using a Johnson and Johnson One Touch® Ultra Blood Glucose Monitoring System. An insulin tolerance test (ITT) was also conducted at 9 weeks of the feeding study. Another set of five mice in each treatment group were fasted for 4 h before giving them an i.p. dose of insulin (0.75 U/kg body weight). Blood glucose was determined using the same protocol as the glucose tolerance test.
At the end of the 10th-week feeding period, all mice, after an overnight fast, were euthanized via CO2 inhalation and blood was collected for endpoint biomarkers of metabolic syndrome, including diabetes. Blood plasma was analyzed for insulin, leptin, and inflammatory markers (MCP-1, IL-6, MMP-9 and I-CAM-1) using ELISA kits. Total plasma cholesterol and triglycerides were analyzed using InfinityTM Cholesterol Reagent and InfinityTM Triglyceride Reagent kits, respectively (ThermoDMA, Louisville, CO). Plasma glucose was analyzed by the Autokit Glucose (Wako Chemicals USA, Inc., Richmond, VA). Plasma low-density lipoprotein cholesterol (LDL-C), high-density lipoprotein cholesterol (HDL-C), AST and ALT were estimated by commercially available kits (Bioo Scientific Corporation, Austin, TX).
2.6. Cognitive function
HFD mice were tested three days before sacrifice for cognitive performance using the water maze as previously described (Miranda et al., 2018). Briefly, the water maze consisted of a large circular pool filled with water made opaque with white chalk and surrounded by spatial cues. Mice were trained to locate a clear platform (12 cm diameter) submerged 1 cm below the water surface. During visible trials, this target platform was marked with a visible flag. Each trial consisted of the animal being placed at the edge of the pool and allowed to explore the maze. Drop locations were rotated and the platform location was moved to different quadrants of the maze after trials 2 and 8 so that procedural memory would not be used to find the platform. Trials lasted 60 s or until the mouse located the platform and remained on it for 3s. If an animal did not locate the platform within 60 s, it was led to the platform by the experimenter. During visible trial days, mice underwent 2 trials, and during hidden trial days, mice underwent 3 trials. Same-day trials were separated by a 10-minute interval.
After hidden training, mice were tested for spatial memory retention in a probe trial, during which the platform was removed from the maze completely. To ensure that mice learned the task, they were tested in two additional trials to locate a platform containing a visible flag following the probe trial.
Trials were recorded using Ethovision XT 7 software (Noldus Information Technologies, Wageningen, The Netherlands). To assess spatial learning and memory, latency to the platform and cumulative distance to the target was analyzed for training. Cumulative distance to the target was also assessed during the probe trials. To ensure differences in cognitive performance were not based on differences in swim speed, mean swim speed during each trial type was analyzed.
2.7. Statistical analysis
Data were analyzed using SAS 9.2 software (SAS Institute Inc., Cary, NC) and GraphPad Prism 5.0 (San Diego, CA). Body weight, food intake, GTT, and ITT data were analyzed using a repeated-measures-in-time design ANOVA in PROC MIXED. Repeated measures within animals were modeled using a first-order autoregressive variance-covariance structure (body weight and food intake) or an unstructured variance-covariance structure (GTT and ITT data. Baseline values were used as linear covariate for body weight and feed intake data. The AUC data presented in Figure 1 were analyzed using a one-way ANOVA and a post-hoc Tukey’s multiple comparison test. A p-value <0.05 was considered statistically significant. For the water maze learning curve, the data were analyzed using repeated measures ANOVA with SPSS software (v.25, Chicago, IL). If Mauchly’s test of Sphericity was significant (p < 0.05) and sphericity therefore violated, the Greenhouse-Geisser correction was used. GraphPad Prism was used for data visualization.
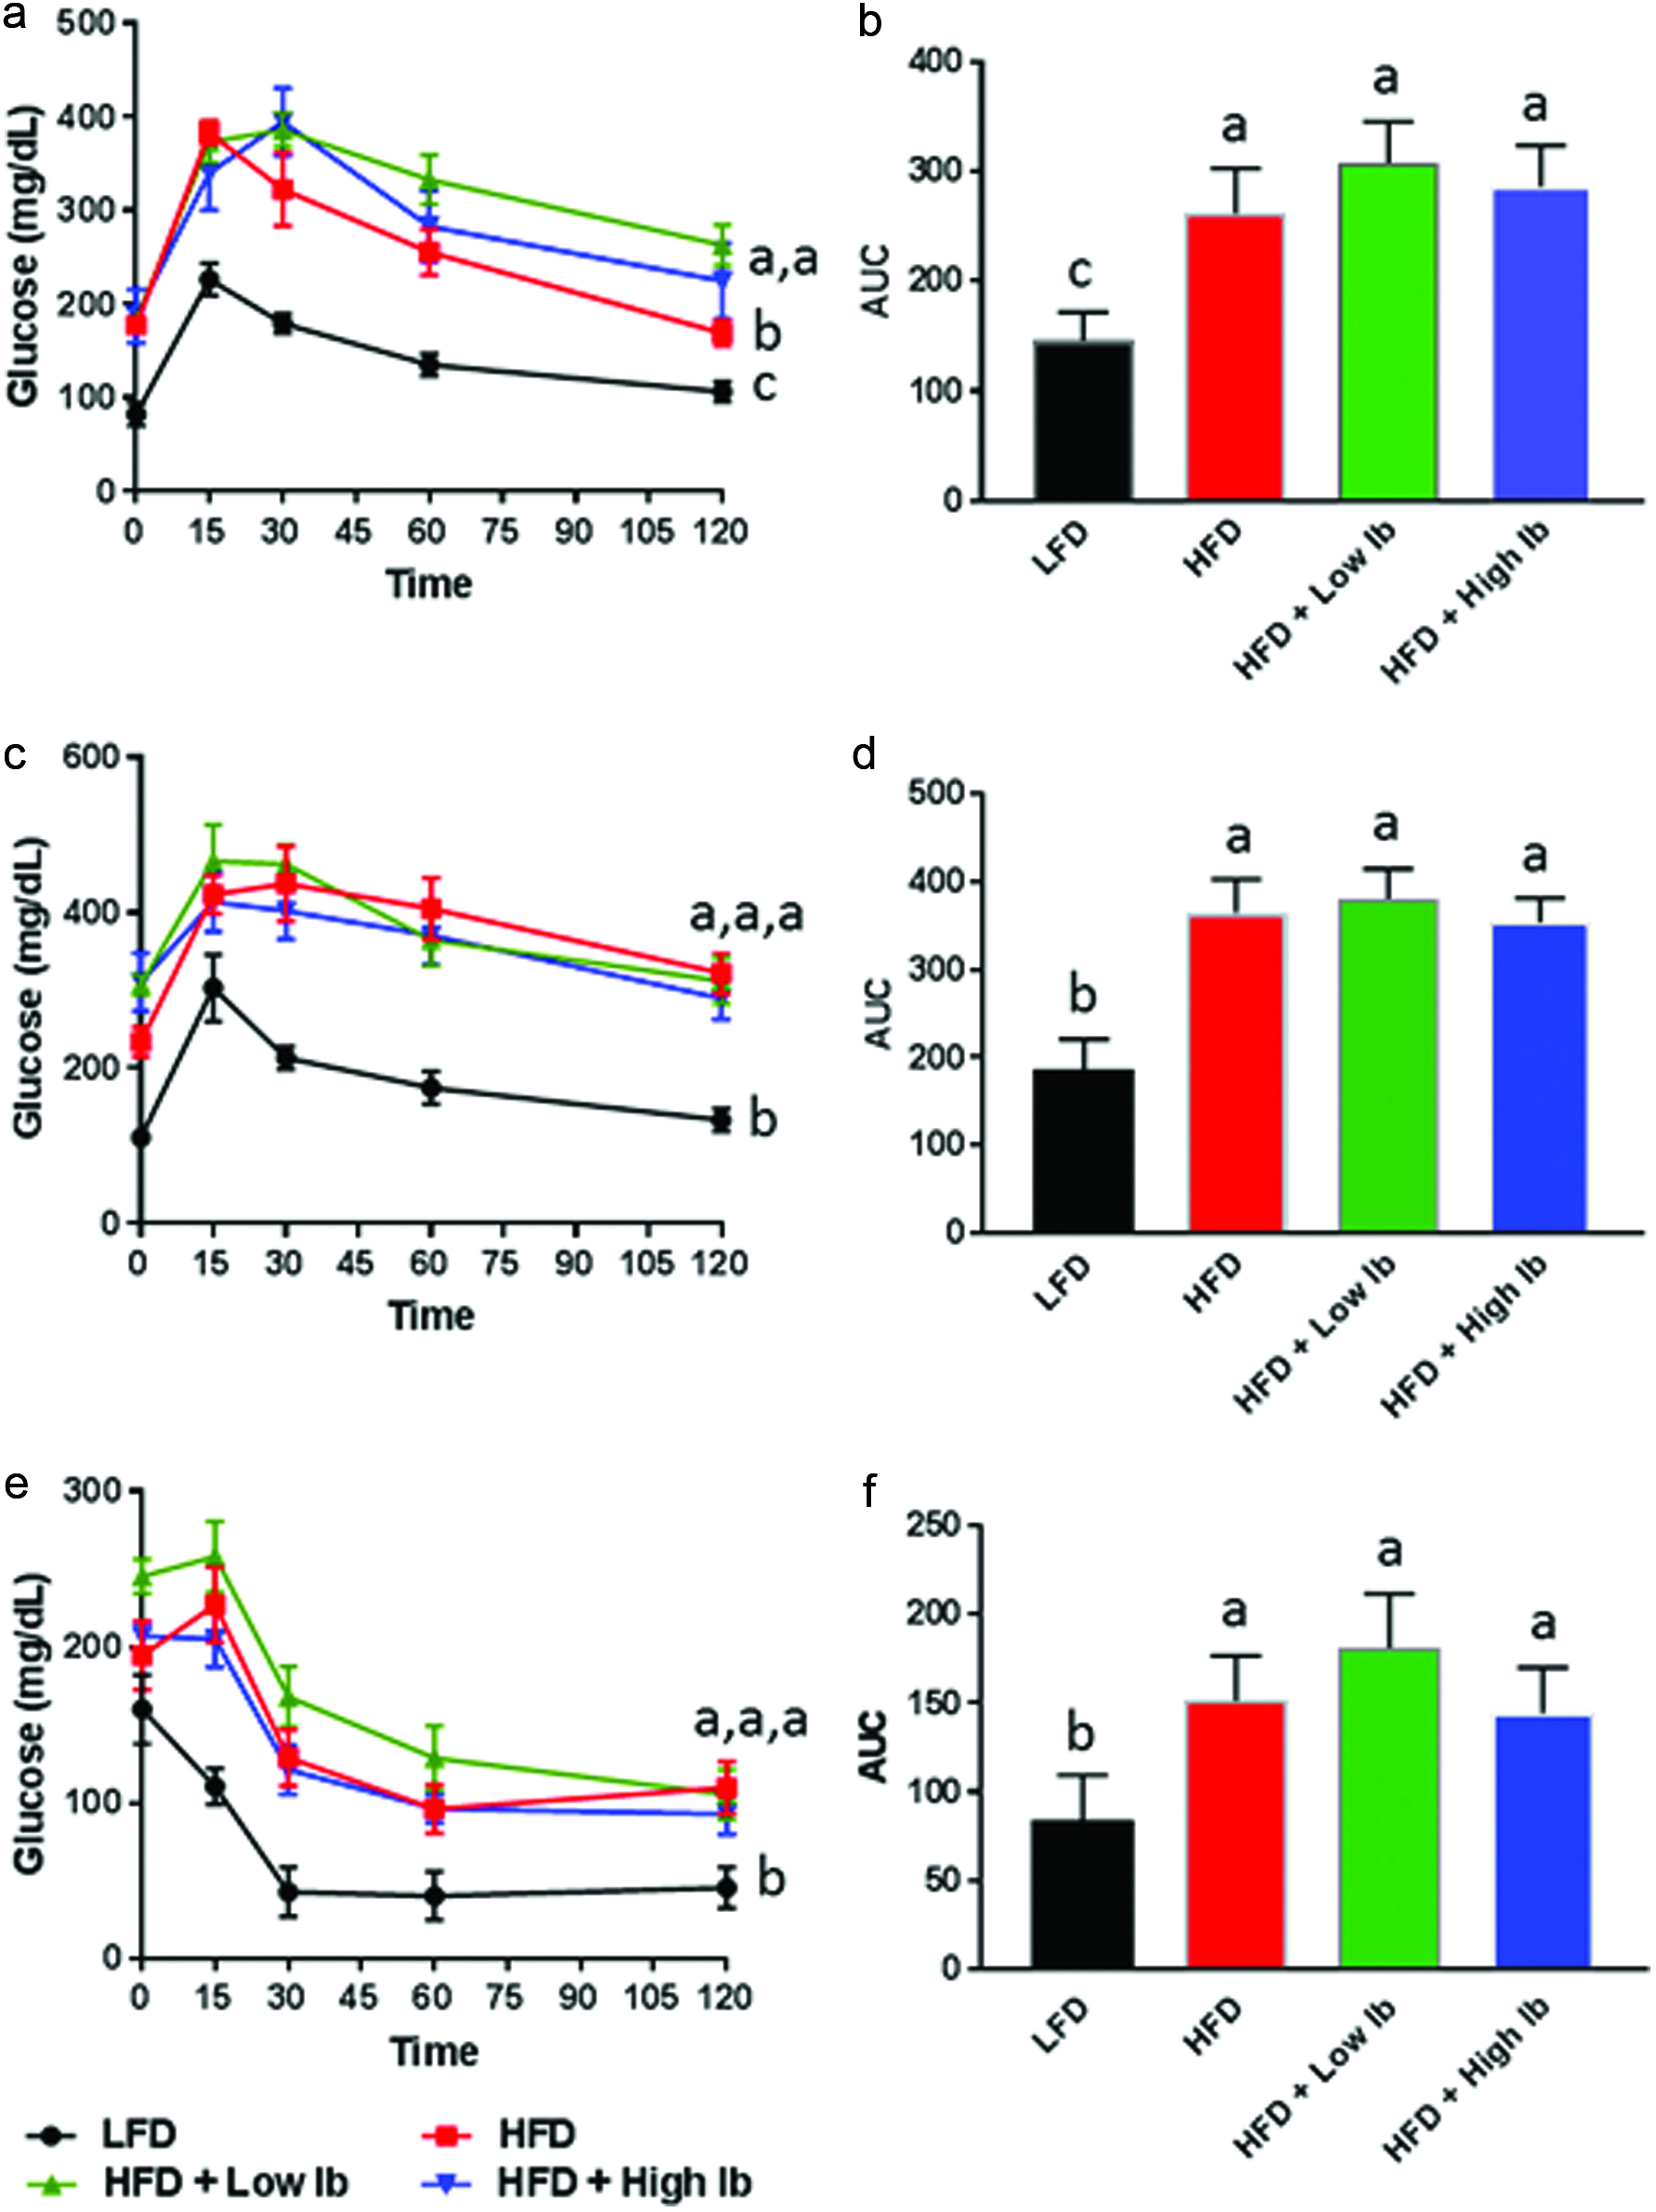 Click for large image | Figure 1. Influence of diet and iboga extract on glucose tolerance in mice at 4 weeks (a, b) and 9 weeks (c, d) and on insulin tolerance at 9 weeks (e, f) of the feeding study. |
| 3. Results and discussion | ▴Top |
3.1. Estimation of ibogaine and total alkaloid concentration in iboga extract
Figure 2 shows the chromatograms of the ibogaine standard and ibogaine in the bark extract. The powdered root bark of iboga contained 1.93% ibogaine (w/w). The chromatographic peak area of ibogaine comprised 24.6% of the total area of chromatographic peaks assigned to known and unknown alkaloids based on their common mass defect. Therefore, we estimated that the total alkaloid content of the bark amounts to 7.8%. This number is higher than the 5–6% indole alkaloids in the root bark reported by Delourme-Houdé (1946), Marion (1952) and Dewick (2002) but lower than the alkaloid content of powdered iboga root (7.2% ibogaine, 0.6% ibogamine) reported by Mazoyer et al. (2013). Only seven alkaloids have been reported for T. iboga previously (Table 1), all of which we identified by our plant metabolomics approach. In addition, we tentatively assigned 23 other alkaloids reported for other plant species, including taxa belonging to the Apocynaceae (Table 1).
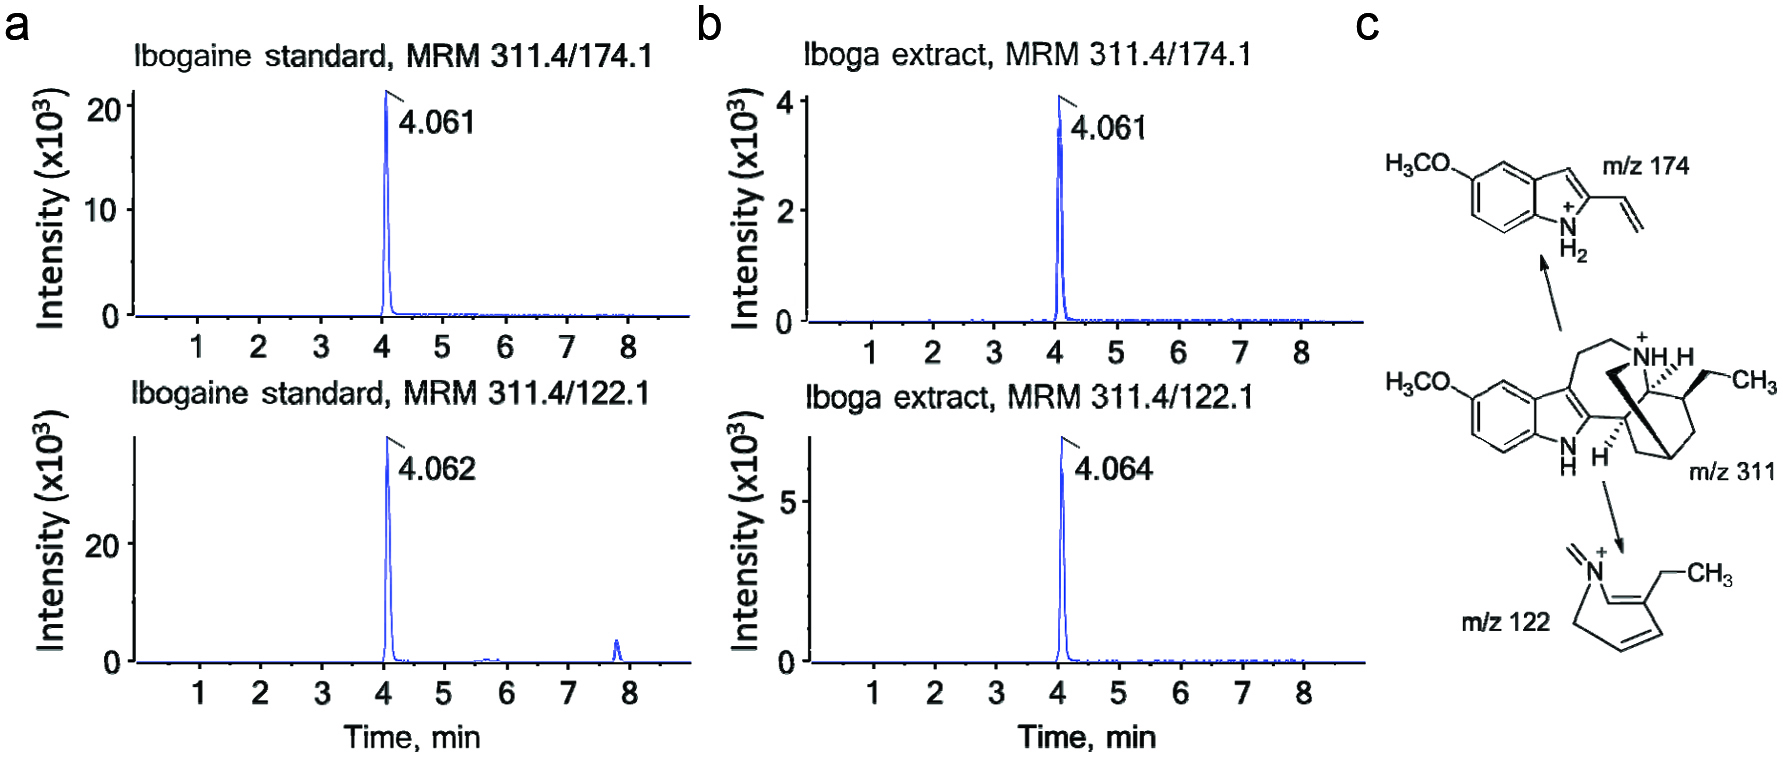 Click for large image | Figure 2. LC-MS/MS chromatograms of ibogaine. |
 Click to view | Table 1. Phytochemicals detected in T. iboga root bark Compounds detected in the positive electrospray ionization (ESI) mode were assigned using Progenesis QI (score >50). For compounds detected by negative ESI-MS, identity was assigned based on comparison of m/z, retention time and MS/MS spectra comparison with authentic standards |
3.2. Rationale for the selection of the dose
We used the calculated ibogaine content of 1.93% in the bark to fortify the diets with iboga extract. The fortified diets delivered a daily ibogaine dose of 0.83 and 2.07 mg/kg body weight. The mouse doses of 0.83 and 2.07 mg/kg body weight are equivalent to human doses of 4.7 mg/day and 12 mg/day for a 70-kg person by allometric scaling of dose (Sharma and McNeill, 2009). Assuming that the total alkaloid content of the root bark is 7.8% (see previous paragraph), the human equivalent dose of 12 mg ibogaine per day would represent a total alkaloid dose of 49 mg per day (0.70 mg/kg/day for a 70-kg person) when given in the form of iboga bark extract. The selected high dose in our study approaches the recently recommended human dose of 0.87 mg ibogaine/kg that is considered safe and appropriate for treatment of opioid addiction in humans (Schep et al., 2016). Forsyth et al. (2016) investigated the effects of a single oral dose of 20 mg ibogaine in humans on a number of psychological variables. A pharmaceutical preparation of T. manii (Lambarène), containing 8 mg ibogaine per tablet, was marketed in France as a neuromuscular stimulant, promotor of cell combustion, and anti-fatigue agent. The recommended dose was 16–32 mg ibogaine per day (2–4 tablets daily) (Goutarel et al., 1993). Assuming other iboga alkaloids exert pharmacological activity, these doses are comparable to our low dose in mice (human equivalent dose for a 70-kg person: 20 mg total iboga alkaloids). As this is the first study designed to investigate the effects of iboga phytochemicals in an in vivo model of glucose intolerance, we were unable to predict efficacious dose levels for ameliorating glucose intolerance.
3.3. Analysis of iboga extract by mass spectrometry
Analysis of over 6,300 mass spectra recorded in the positive ionization mode revealed 38 compound identifications with high confidence using Progenesis QI (score >50, Table 1). Among them, 30 compounds are alkaloids previously reported in plants (Afendi et al., 2012; Kanehisa et al., 2017; Smith et al., 2005) (MetlinTM, HMDB, KEGG or KnapSack, Table 1), with ibogaine as the major alkaloid (Figure 3a–c). Further analysis of a 70% aqueous methanol extract by negative ion mass spectrometry using several standards showed the presence of five phenolic compounds, including 3-O-caffeoylquinic acid (Table 1, Figure 4). The calculated amount of this compound was 0.97 mg/g of the root bark.
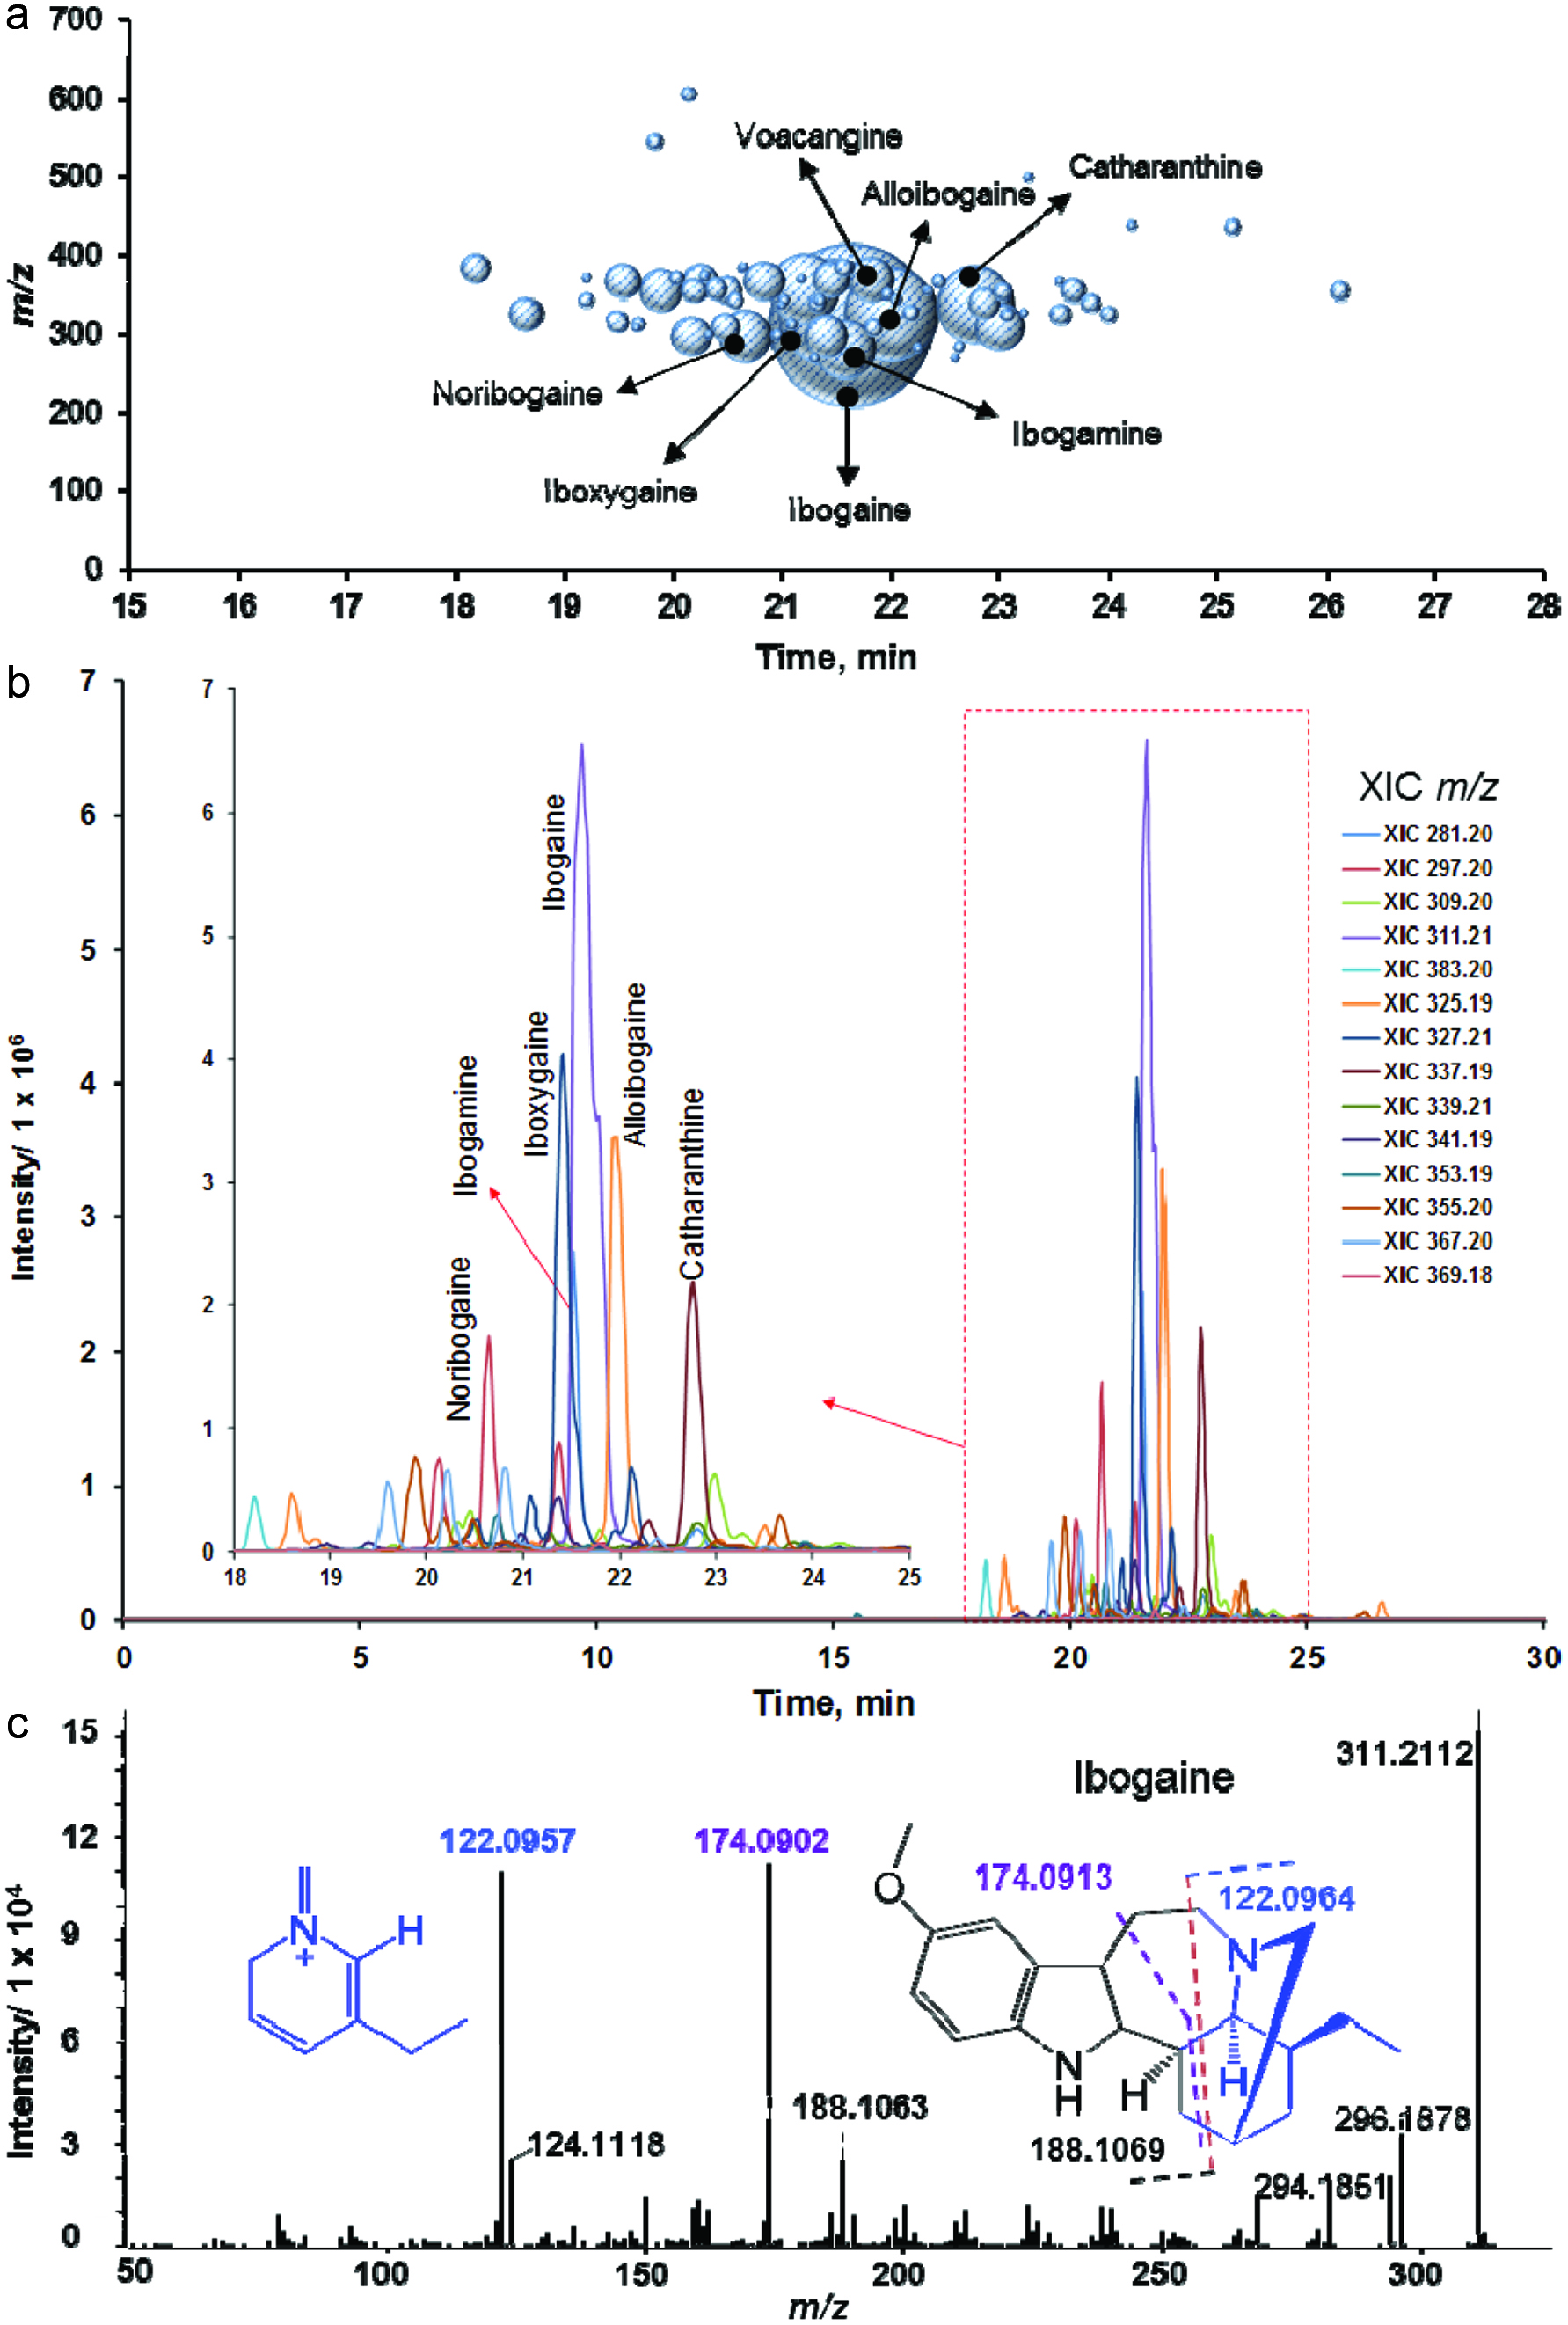 Click for large image | Figure 3. LC-HRMS/MS analysis of iboga extract in positive ionization mode (1 mg mL−1 of dry mass resuspended in 70% aqueous methanol). |
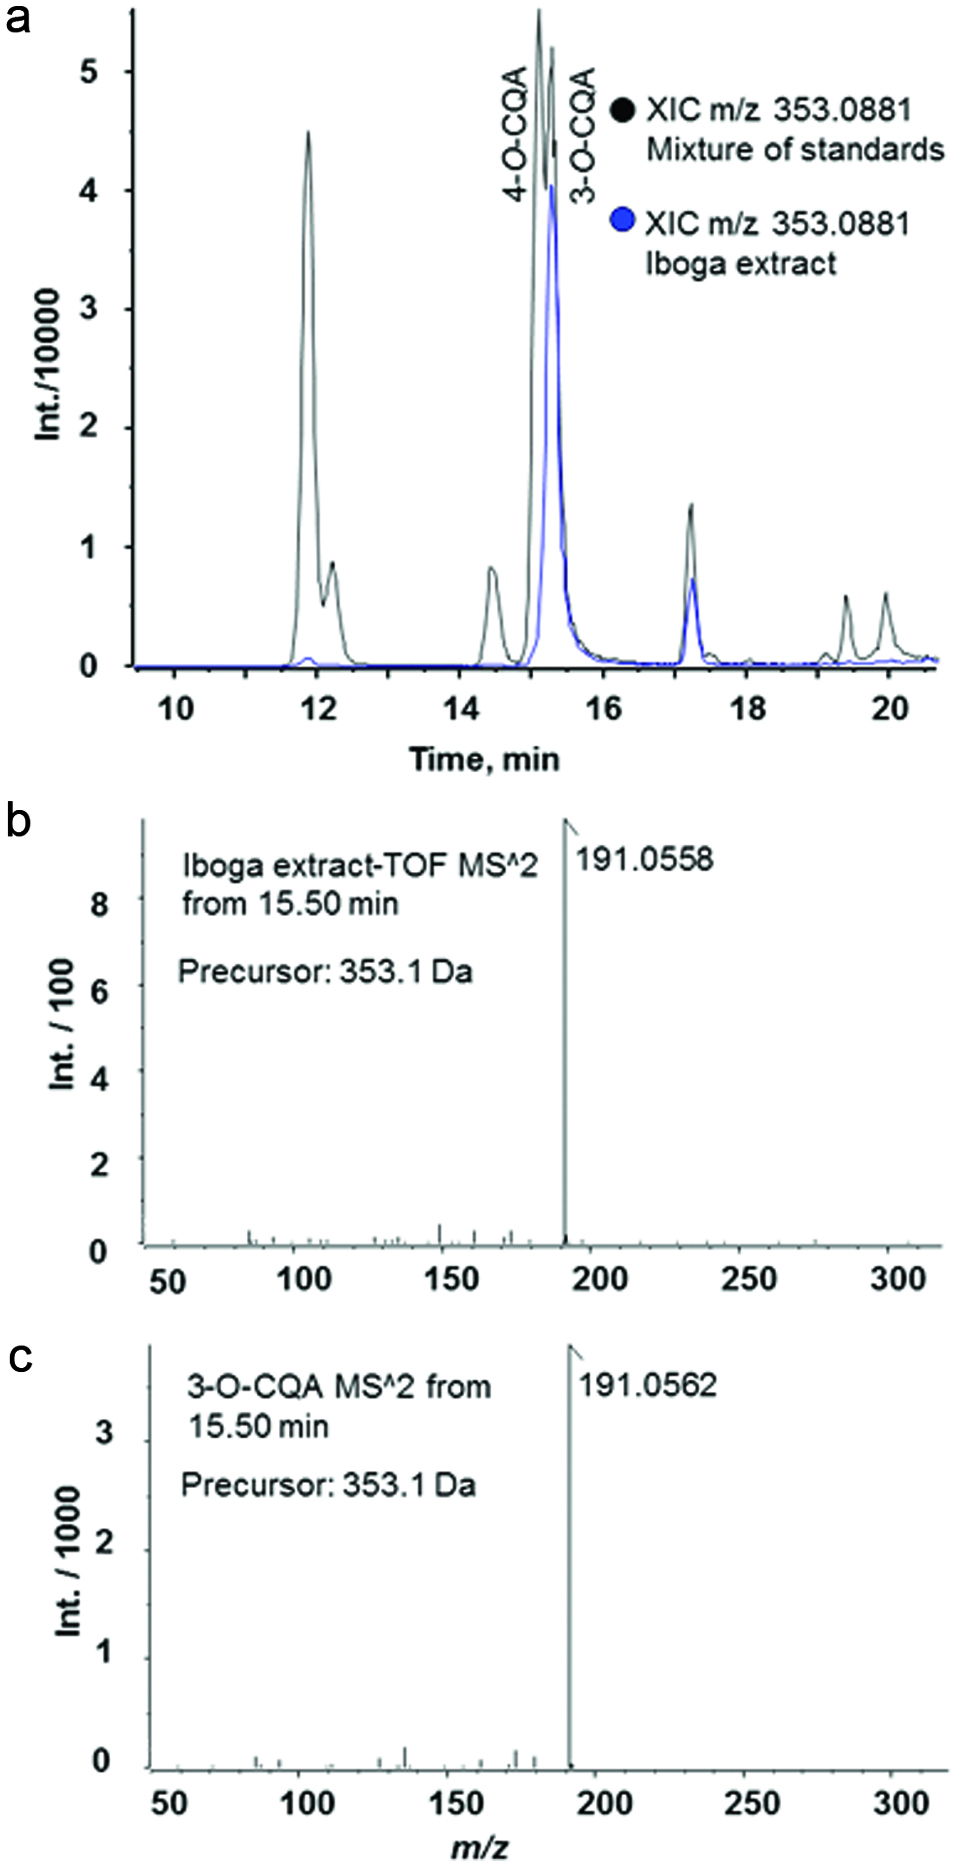 Click for large image | Figure 4. LC-HRMS/MS analysis of T. iboga root bark extract. |
3.4. Mass defect analysis
T. iboga root bark is rich in indole alkaloids (Bartlett et al., 1958). Alkaloids are particularly suitable for LC-MS analysis in positive ionization mode due to the presence of nitrogen atoms with high proton affinity. Filtering of data based on mass defect, defined as the difference between the nominal mass and the monoisotopic mass of a molecule, referred to as mass defect filtering, is a useful post-acquisition data processing technique to detect groups of molecules with similar elemental compositions, such as indole alkaloids (Xie et al., 2012). To screen for T. iboga alkaloids, we used as reference the mass defect range obtained from the monoisotopic neutral mass of reported alkaloids in T. iboga (Afendi et al., 2012; Bartlett et al., 1958; Harborne et al., 1999). The absolute mass defect (i.e., mass excess) varied from 0.1939 to 0.2100. The accurate mass achieved in this experiment was 5 ppm or better, therefore, we used a screening range from 0.1900 to 0.2190 (Figure 3a). Using this approach, 30 known alkaloids and 48 unknown alkaloids were detected (Table 1).
3.5. Effect of diet and iboga extract on body weight, food intake and liver weight
The LFD-fed mice gained significantly less weight than the mice fed the HFD with or without iboga extract (Figure 5a). The LFD mice lost weight during the first week on the LFD and then slowly gained weight until the end of the study. The LFD mice actually were eating more food than the mice fed the HFD (Figure 5b) but their feed efficiency was lower compared to the mice on the HFD (Table 2). The HFD mice treated with the low dose of iboga extract gained slightly more weight than the HFD mice and the HFD mice treated with the high iboga dose. Liver weights were much higher in the HFD-fed mice than the LFD-fed mice (Table 2).
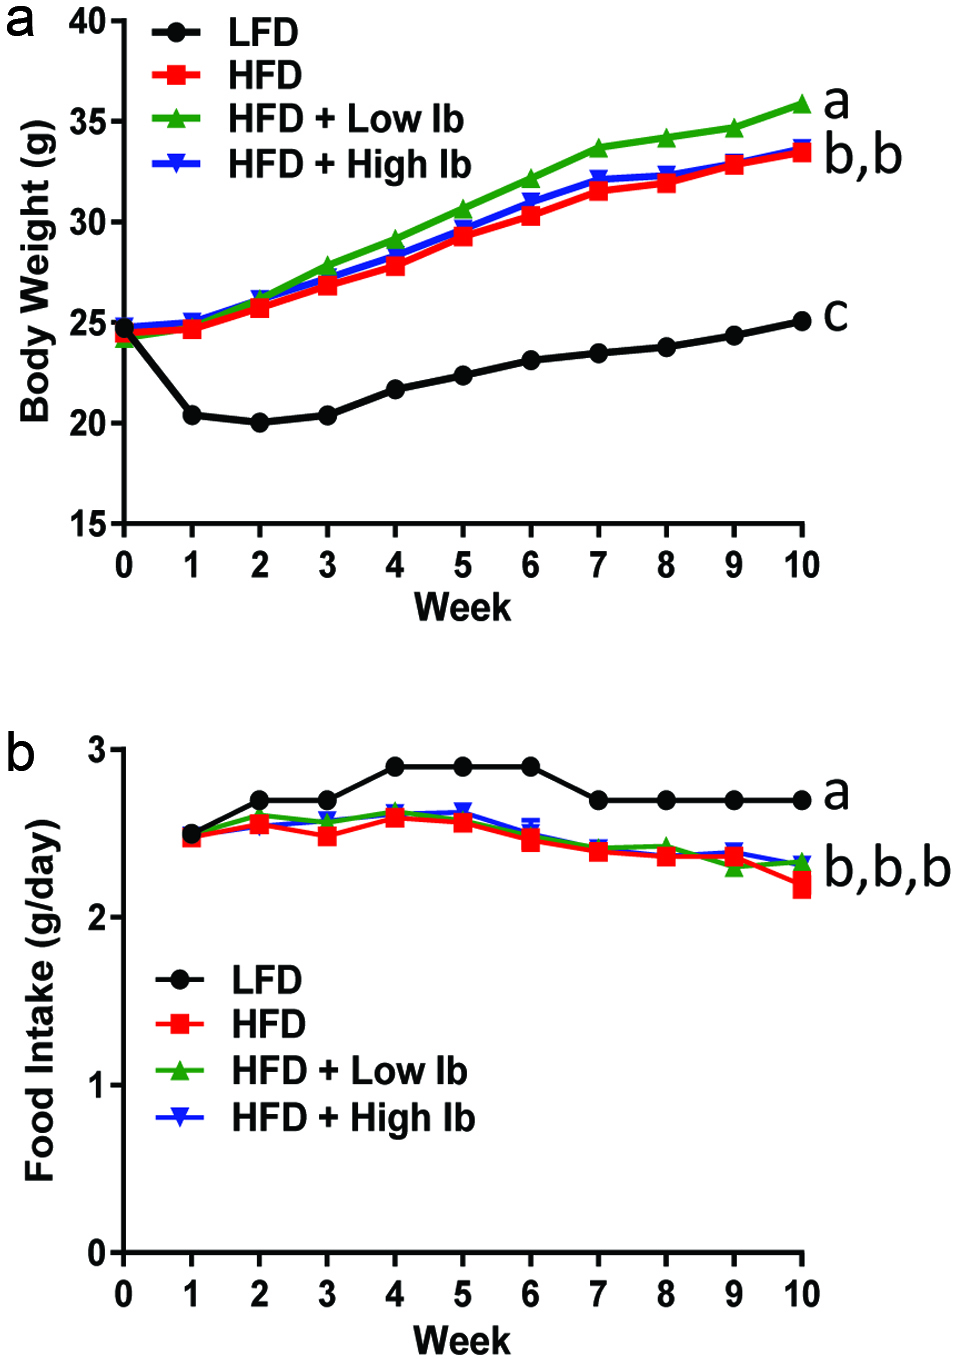 Click for large image | Figure 5. Effect of the HFD and iboga extract feeding on body weight (a) and food intake (b) of mice. |
Click to view | Table 2. Body weight gain, food intake, liver weight and metabolic parameters of mice fed experimental diets |
3.6. Effect of diet and iboga extract on glucose tolerance and insulin sensitivity
One of the major aims of this study was to determine whether ingestion of iboga extract has any beneficial effect on type 2 diabetes induced by feeding a HFD. The results of the glucose tolerance tests conducted at 4 and 9 weeks of feeding showed that mice fed the HFD cleared glucose slower after the glucose bolus dose compared to the LFD group (Figure 1). Oral iboga administration did not improve the glucose tolerance of the HFD mice. In fact, the HFD mice treated with the low or high iboga dose were slightly less glucose tolerant than the HFD controls at 4 weeks of treatment (Figure 1a). Similar results were obtained in the insulin tolerance test (Figure 1e, f) in that the HFD-fed mice had higher blood glucose levels after insulin injection while iboga exposure did not improve the insulin sensitivity of the mice fed a HFD. Therefore, our data do not support the conclusions reached by Souza et al. (2011) that aqueous extracts of iboga root bark contains anti-hyperglycemic natural products for treatment of type 2 diabetes. Using isolated islets of Langerhans from the pancreas of non-fasting female Wistar rats, these authors found that bioactives in the aqueous extract of iboga exerted an insulinotropic effect ex vivo, similar but not identical in mechanism compared to tolbutamide, a representative of the sulfonylurea class of type 2 diabetic drugs. With chronic administration of sulfonylureas, insulin levels do not change with treatment, consistent with our observations, but fasting plasma glucose levels decrease due to lowering of insulin resistance (Davis, 2006), which we did not observe with iboga treatment. One explanation for the discrepancy is that the doses used in our study were not optimal. In addition, we cannot exclude the possibility that iboga bioactives are converted into inactive metabolites by gut microbial or hepatic metabolism. For instance, ibogaine undergoes O-demethylation by the hepatic cytochrome P450 enzyme CYP2D9 (Obach et al., 1998). It is possible that the metabolite, 12-hydroxyibogamine (syn. noribogaine), lacks insulinotropic activity.
The amount of 3-O-caffeoylquinic acid in iboga root bark, extracted with 70% aqueous methanol, was determined to be 0.97 mg/g. 3-O-caffeoylquinic acid is a commonly found food bioactive with anti-tumor, antioxidant and anti-inflammatory activities (Jabeur et al., 2016). Oral administration of 3-O-caffeoylquinic acid (syn. chlorogenic acid) to HFD-fed C57BL/6J mice at 100 mg/kg body weight per day resulted in increased insulin resistance and hepatic lipid accumulation compared to the HFD control mice (Mubarak et al., 2013). By contrast, when HFD-fed ICR mice were treated orally with chlorogenic acid at a dose of 20 mg/kg body weight per day, their insulin levels decreased indicative of improvement of insulin sensitivity (Cho et al., 2010). In our study, the high iboga dose corresponded to an intake of about 107 mg bark/kg body weight per day, which would have provided a 3-O-caffeoylquinic acid dose of 0.10 mg/kg body weight per day if the extraction yield were quantitative. Therefore, a 70% aqueous methanol extract of iboga root bark at a daily dose of 107 mg bark/kg body weight would not have affected the HFD-induced insulin resistance due to the low dose of 3-O-caffeoylquinic acid. To test the hypothesis that the alkaloids in iboga root bark, and not 3-O-caffeoylquinic acid, are in fact responsible for the reported biological effects, we prepared an alkaloid extract devoid of phenolic acids for testing in the mice in this study.
3.7. Effect of diet and iboga extract on other metabolic parameters
One major concern of the use of herbal or dietary supplements such as kava-kava (Stickel and Shouval, 2015) is liver damage. Plasma levels of alanine aminotransferase (ALT) and aspartate aminotransferase (AST) are generally used as indicators of liver injury (Ozer et al., 2008). As shown in Table 2, no significant difference was observed in ALT and AST between LFD-fed mice and HFD-fed mice. Supplementation of the HFD with iboga extract did not cause a significant increase in ALT or AST suggesting that the extract is not hepatotoxic.
The results listed in Table 2 showed that mice fed a HFD had significantly higher plasma levels of glucose, triglycerides, LDL-cholesterol, HDL-cholesterol, leptin IL-6, ICAM-1, and MCP-1 compared to the group fed LFD. The addition of iboga extract to the HFD did not have a significant effect on any of these metabolic parameters, except for the reduction of plasma levels of MCP-1 by low-dose iboga treatment (Table 2). MCP-1 or CCL2 is a chemokine that may contribute to low-grade inflammation in obesity by recruiting monocytes to adipose tissues (O’Connor et al., 2015). Therefore, iboga bioactives may be beneficial in ameliorating low-grade inflammation in obesity.
3.8. Cognitive performance
We tested HFD mice in the water maze to assess the effects of iboga on spatial learning and memory (Figure 6). Mice were first trained with a visual flag for 1 day followed by 2 days of hidden training. On the 4th day, mice were tested for spatial memory retention during a probe trial, which was followed by 2 additional visual trials.
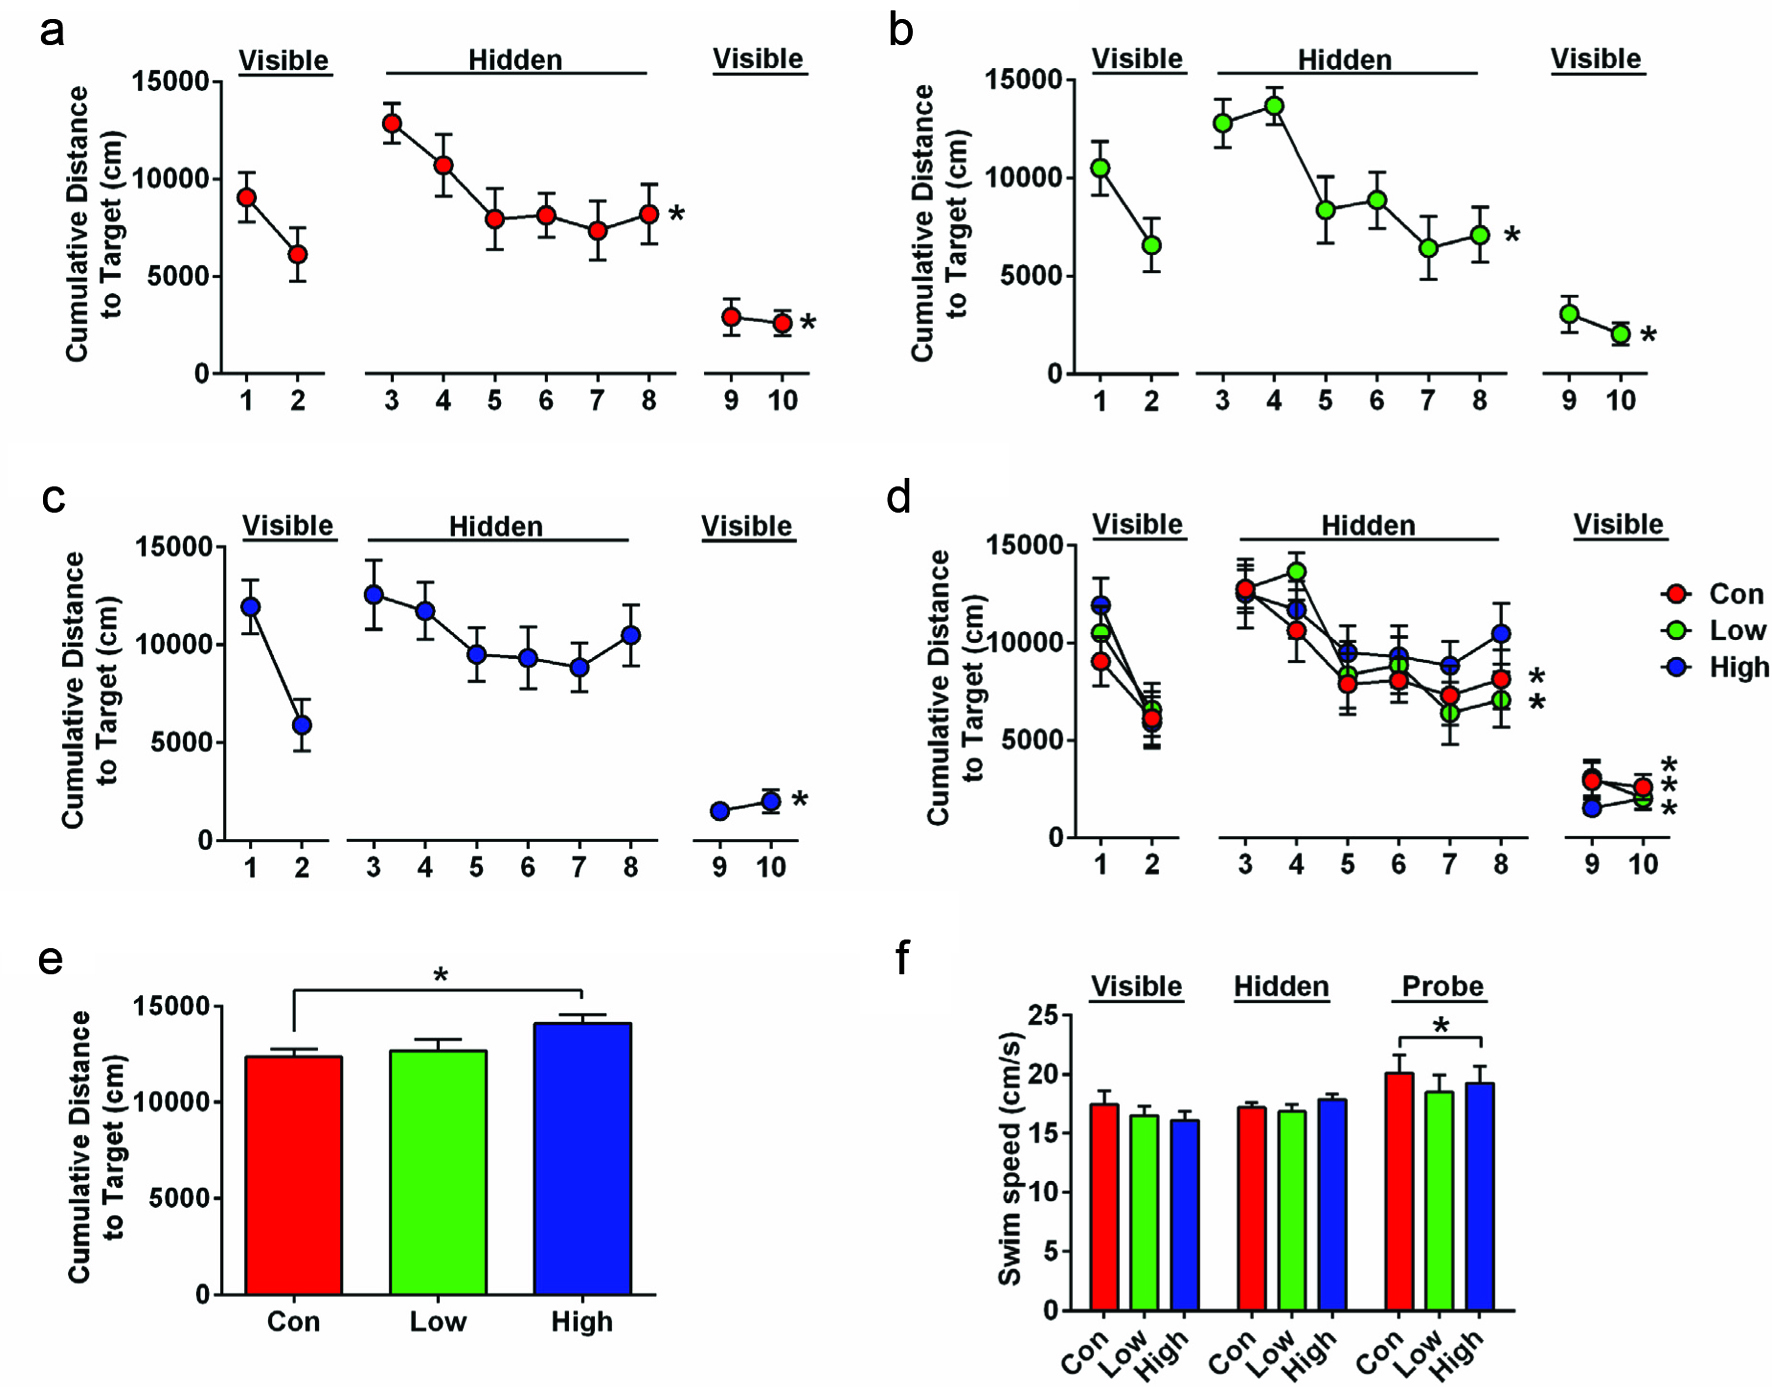 Click for large image | Figure 6. Cognitive performance of HFD mice in the water maze. |
Analysis of visual trials showed that mice learned the task and swam closer to the target with additional trials (Figure 6a–d. Mauchly’s sphericity test: p = 0.005; One-Way RM ANOVA with Greenhouse-Geisser correction: F(3, 76.55) = 40.473, p < 0.001). There were no significant differences due to group treatment. Hidden trials analysis shows that there was an overall improvement (One-Way RM ANOVA: F(5, 160) = 6.75, p < 0.001). Interestingly, this effect was absent in the high dose iboga group (Figure 6c. p = 0.55), but the control and low dose iboga group showed significant improvement (Figure 6a and b. F(5, 55) = 5.2, p = 0.001; F(5, 55) = 2.51, p = 0.040).
Probe trial analysis showed significant differences due to iboga treatment (Figure 6e. One-Way ANOVA: F(2, 33) = 3.346, p = 0.048). This was driven by a difference between the control mice and high dose iboga group indicating that the mice in the high dose iboga group swam on average further away from the location where the hidden platform was located during training (Dunnett’s post hoc test: p = 0.039), indicating a memory retention impairment.
Although HFD mice weighed more, water maze differences were not due to group differences in the swim speed. Mice did, however, generally swim faster during the probe trial than during visible and hidden platform trials (Figure 6f. One-Way RM ANOVA: F(2, 66) = 5.37, p = 0.007).
As a whole, the results of the water maze trial indicate that high dose iboga treatment may be harmful and impair spatial learning and memory. These data are consistent with the lack of beneficial effects of iboga on psychological performance beyond perhaps improving selective attention (Forsyth et al., 2016).
| 4. Conclusion | ▴Top |
By using high-resolution accurate mass spectrometry in combination with database searching, we tentatively identified 30 indole alkaloids in the bark extract of T. iboga, seven of which have been reported previously as constituents of T. iboga. Feeding a HFD to male mice for 10 weeks resulted in obesity and high plasma levels of circulating glucose and insulin, which were not attenuated by treatment with iboga extract at dose levels of 0.83 and 2.07 mg/kg/day. However, plasma levels of MCP-1, a chemokine involved in inflammation in obesity, was significantly attenuated by low-dose iboga extract (0.83 mg/kg/day) suggesting an anti-inflammatory effect of the extract. The results of the water maze study indicate that bioactives found in Iboga extract may impair spatial learning and memory.
Acknowledgments
This work was supported by the Gabon-Oregon Center (B.B.-T., C.L.M. and J.F.S.), the Linus Pauling Institute (J.C.), the OSU Foundation Buhler-Wang Research Fund (C.L.M., J.F.S.), the National Institutes of Health (Grants S10RR027878, T32-ES07060, and T32-HL094294), National Science Foundation grant SMA-1408653, the Collins Medical Trust, an OHSU Tartar Award, the Oregon Tax Check-off Program for Alzheimer’s Research administered by the Layton Aging & Alzheimer’s Disease Center, and an OHSU development account (J.R.).
| References | ▴Top |