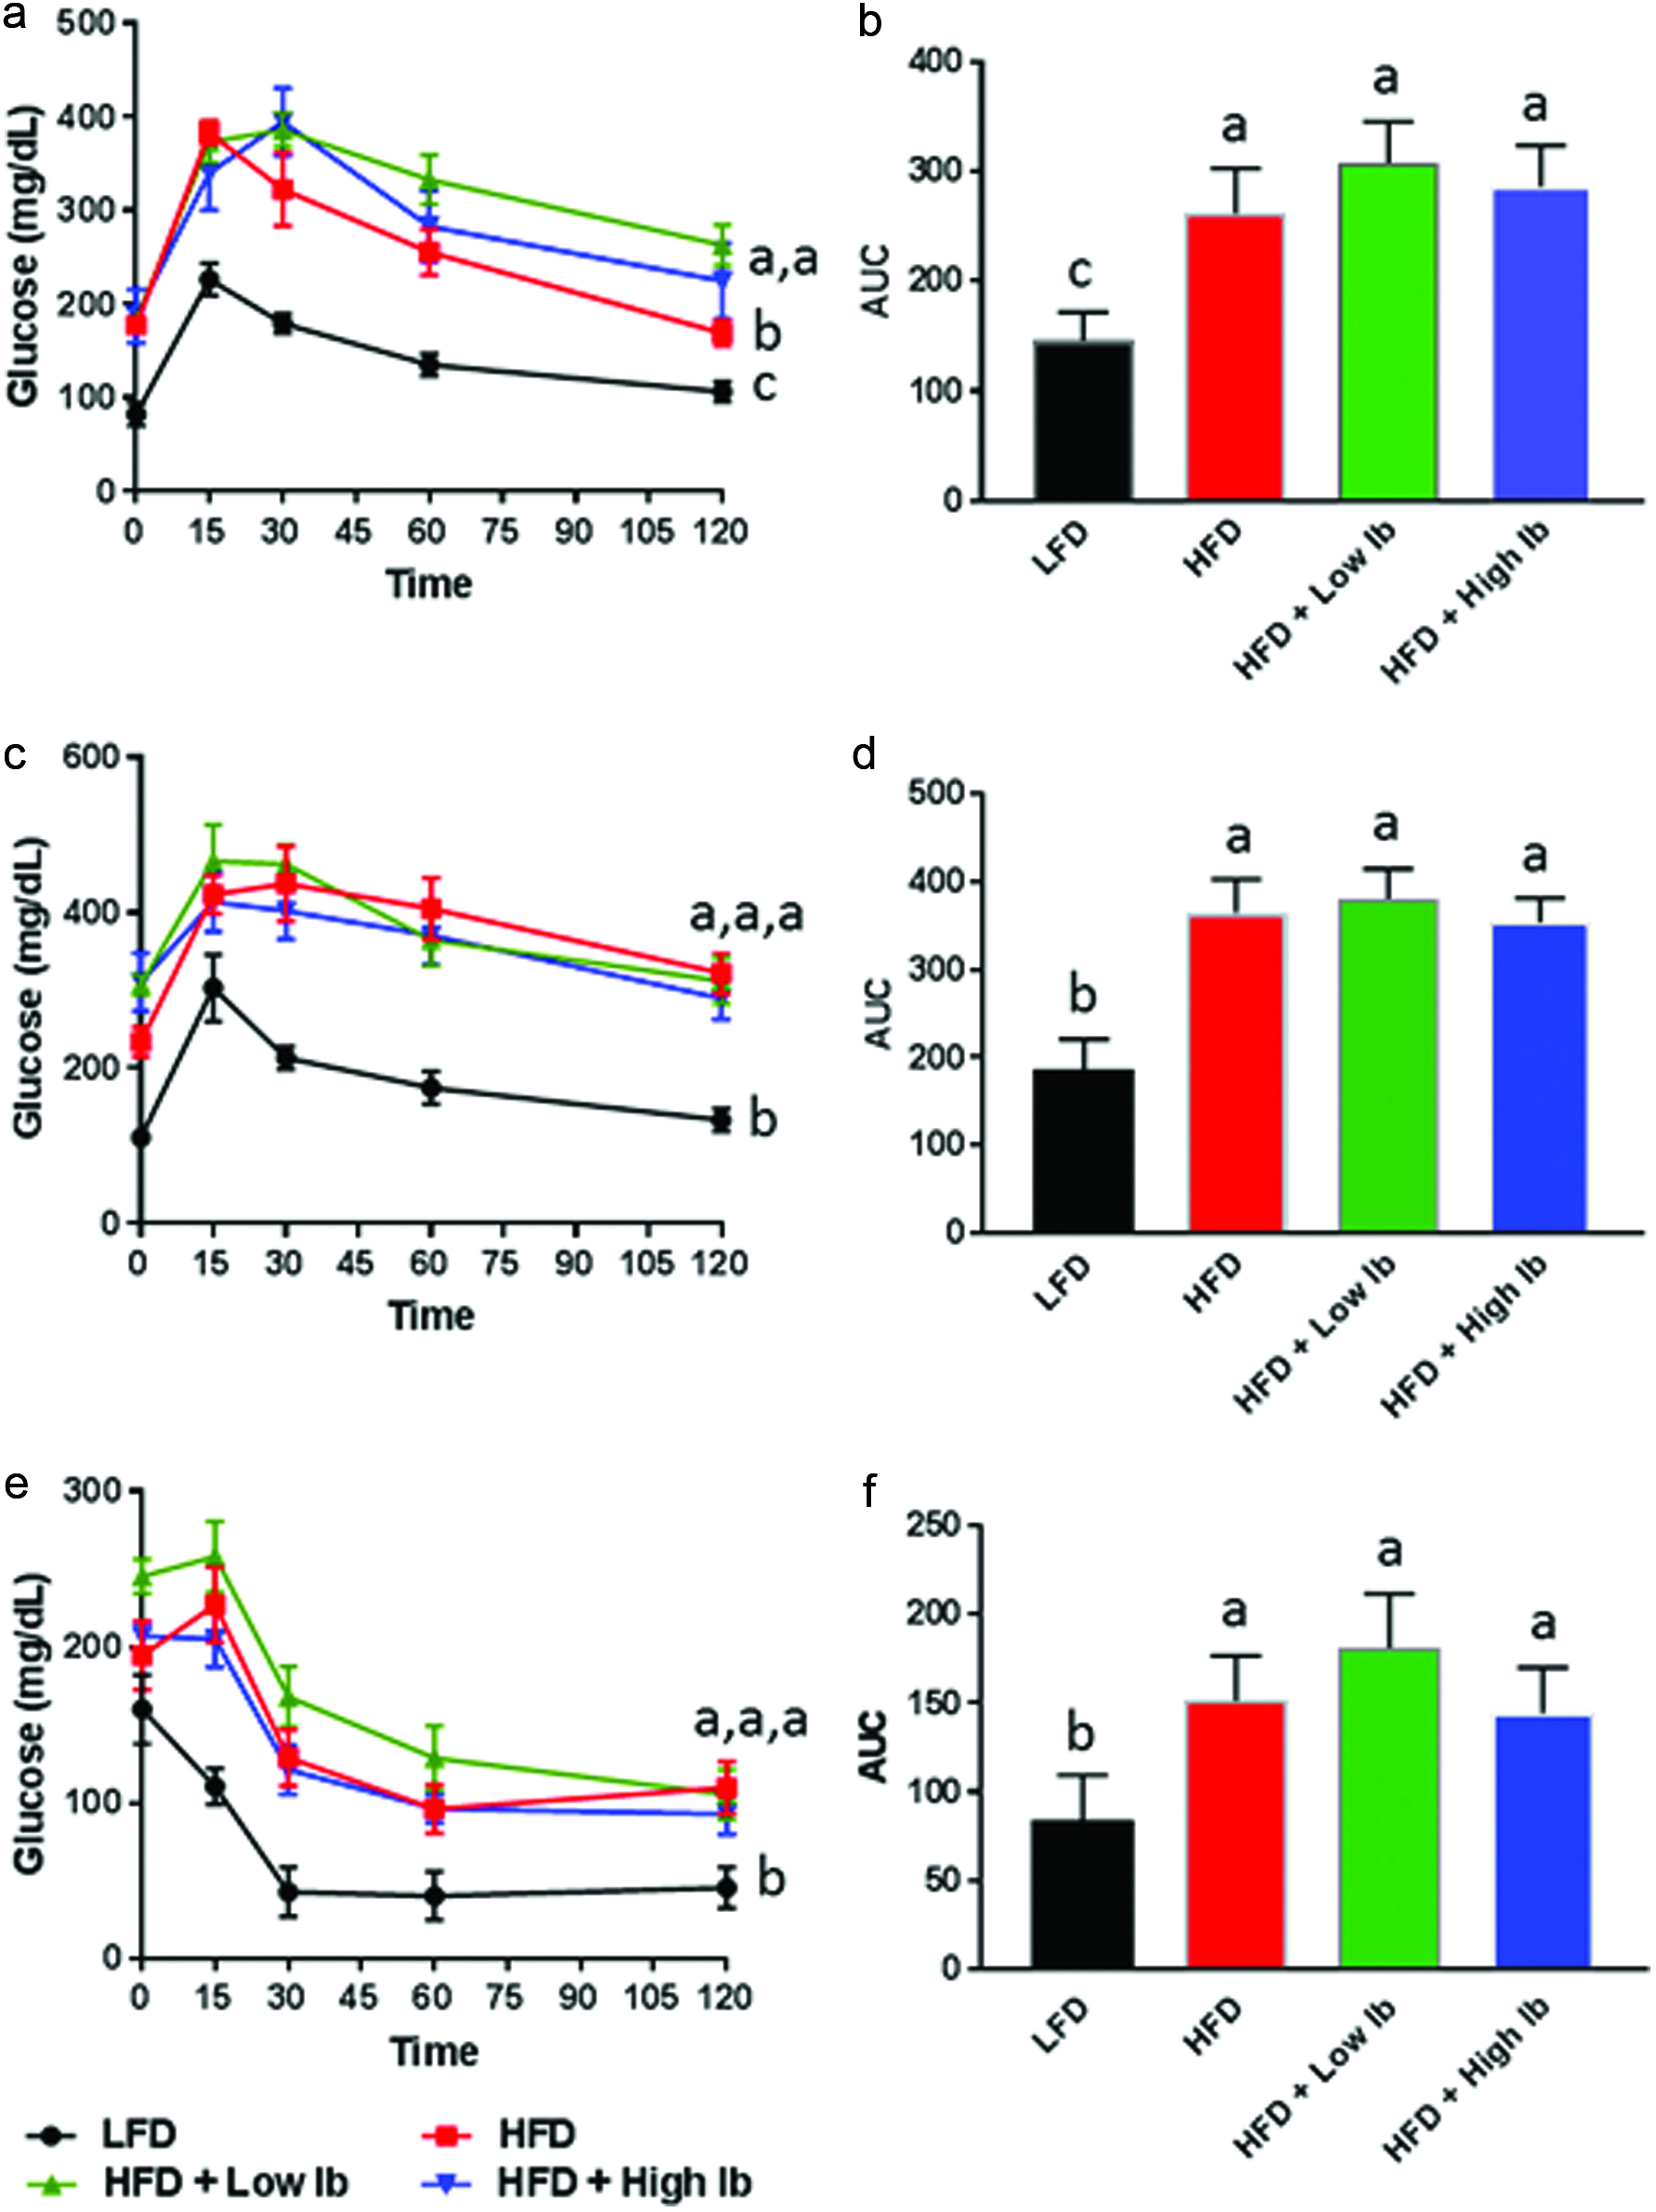
Journal of Food Bioactives, ISSN 2637-8752 print, 2637-8779 online
Journal website www.isnff-jfb.com

Original Research

Volume 3, Number , September 2018, pages 111-123


Phytochemical characterization of Tabernanthe iboga root bark and its effects on dysfunctional metabolism and cognitive performance in high-fat-fed C57BL/6J mice

Figures

Figure 1.
Figure 1.

Influence of diet and iboga extract on glucose tolerance in mice at 4 weeks (a, b) and 9 weeks (c, d) and on insulin tolerance at 9 weeks (e, f) of the feeding study.

The mice were fasted for 6 h before i.p. injection of glucose, 2 g/kg body weight, or of insulin, 0.75 U/kg body weight, before blood glucose was analyzed at designated times. LFD, low-fat diet; HFD, high-fat diet; Ib, ibogaine. Data presented in panels A, C, and E were analyzed using a repeated-measures-in-time design ANOVA in PROC MIXED for repeated measures within animals (n = 5 per group). Data presented in panels B, D, and F were analyzed using a one-way ANOVA and a post-hoc Tukey’s multiple comparison test. Statistical differences between groups are indicated with different letters (a, b, c; p < 0.05).
Figure 2.
Figure 2.

LC-MS/MS chromatograms of ibogaine. (a) 10 nM Ibogaine standard. (b) Ibogaine in root bark extract. Multiple reaction monitoring (MRM) transitions: m/z 311.4 > 174.1 (qualifier MRM, c), m/z 311.4 > 122.1 (quantifier MRM, c).

Figure 3.
Figure 3.

LC-HRMS/MS analysis of iboga extract in positive ionization mode (1 mg mL−1 of dry mass resuspended in 70% aqueous methanol). (a) Molecular features detected in iboga extract with a mass defect in a range from 0.1900 to 0.2190. The size of the circles corresponds to the magnitude of the chromatographic peak area of a particular feature; the largest circle represents ibogaine. (b) [M+H]+ extracted ion chromatograms (XIC) of indole alkaloids. (c) Fragmentation spectrum and proposed dissociation of ibogaine. Data are in accord with those reported by Kontrimaviciute et al. (2006).

Figure 4.
Figure 4.

LC-HRMS/MS analysis of T. iboga root bark extract. (a) Extracted ion chromatogram [M–H] m/z 353.09, 10 µL injection. Black line- 1 mg L−1 of standards 3-O-caffeoylquinic acid (3-O-CQA) and 4-O-caffeoylquinic acid (4-O-CQA). Blue line- 1 mg ml−1 of bark extract, both resuspended in 70% aqueous methanol. (b) Fragmentation spectrum of 3-O-CQA detected in iboga extract. C. Fragmentation spectrum of 3-O-CQA standard (1mg L−1).

Figure 5.
Figure 5.

Effect of the HFD and iboga extract feeding on body weight (a) and food intake (b) of mice.

LFD, low-fat diet; HFD, high-fat diet; Ib, Ibogaine. Data were analyzed using a repeated-measures-in-time design ANOVA in PROC MIXED for repeated measures within animals (n = 12 per group). Statistical differences between groups are indicated with different letters (a, b, c; p < 0.05).
Figure 6.
Figure 6.

Cognitive performance of HFD mice in the water maze.

High dose iboga-treated mice show impaired spatial learning and memory. (a) HFD control mice show improved performance during both the hidden and visible sessions demonstrated by decreasing cumulative distance to the target (One-Way ANOVA, F(5,55) = 5.20, p = 0.001). (b) HFD low dose iboga mice show improved performance during both the hidden and visible sessions demonstrated by decreasing cumulative distance to the target (one-way ANOVA, F(5,55) = 2.51, p = 0.040). (c) HFD high dose iboga mice fail to show improved performance during the hidden sessions (One-Way ANOVA, p = 0.55). (d) Cumulative distance to the target during training sessions shown for all high fat diet groups. (e) During the probe trial (occurring prior to trial 9), HFD high dose iboga mice did more poorly and swam further away from the target location than HFD mice not receiving iboga (Dunnett’s post hoc test: p = 0.039). (f) There were no differences in swim speed between the groups. Mice generally swam faster during the probe trial. (One-Way RM ANOVA, F(2, 66) = 5.37, p = 0.007).

Tables

Table 1. Phytochemicals detected in T. iboga root bark Compounds detected in the positive electrospray ionization (ESI) mode were assigned using Progenesis QI (score >50). For compounds detected by negative ESI-MS, identity was assigned based on comparison of m/z, retention time and MS/MS spectra comparison with authentic standards
 
Alkaloids, positive ESIm/zR.T (min)Detected AdductsFormulaComposition %a
aAssuming comparable detector responses for detected alkaloids, all which contain two nitrogen atoms indicative of indole alkaloids. bCompounds with a mass defect ranging from 0.1939 to 0.2100. cLOQ Calibration quantification limit evaluated as S/N ratio 10:1; LOQ > 3.3 µg L−1. dLOD- Calibration detection limit evaluated as S/N ratio 3:1; LOD > 1.0 µg L−1. <LOD not detected; <LOQ detected below LOQ. References: 1Afendi et al., 2012; 2Bartlett et al., 1958; 3Harborne et al., 1999; 4Taylor et al., 1968.
Ibogaine1–3311.211521.63[M+H]+C20H26N2O24.60
Iboxygaine4327.206321.46[M+H]+C20H26N2O211.00
Ibogaline4341.222021.39[M+H]+C21H28N2O210.77
Alloibogaine325.190822.01[M+H]+C20H24N2O28.21
Catharanthine4337.191222.77[M+H]+C21H24N2O25.69
Ibogamine1–3281.201021.58[M+H]+C19H24N23.37
Noribogaine297.195820.66[M+H]+C19H24N2O2.76
Voacangine1–3369.216721.82[M+H]+C22H28N2O31.87
Yohimbine355.201319.89[M+H]+C21H26N2O31.81
Hydroxyibogamine
(isomer of noribogaine)
297.195821.41[M+H]+C19H24N2O1.79
Quinidine325.191218.64[M+H]+C20H24N2O21.01
Coronaridine1–3339.205422.86[M+H]+C21H26N2O20.97
11-O-Demethyl-17-O-deacetylvindoline383.196518.18[M+H-H2O]+C22H28N2O50.86
Affinisine309.195920.47[M+H]+C20H24N2O0.84
17-O-Acetylnorajmaline355.201523.68[M+H]+C21H26N2O30.55
Affinine325.190823.55[M+H]+C20H24N2O20.43
Rhazidigenine N-oxide315.206319.49[M+H]+C19H26N2O20.40
1,2-Dihydrovomilenine353.185823.95[M+H]+C21H24N2O30.23
11-Hydroxyyohimbine371.195820.03[M+H]+C21H26N2O40.20
16-Methoxytabersonine367.201022.43[M+H]+C22H26N2O30.19
N4-Demethylechitamine371.195921.72[M+H]+C21H26N2O40.19
Quinine-N-Oxide341.185519.42[M+H]+C20H24N2O30.18
Iboluteine327.205223.21[M+H]+C20H26N2O20.08
Strictosidine aglycone369.180822.68[M+H]+C21H24N2O40.08
Aspidodasycarpine353.185923.54[M+H-H2O]+C21H26N2O40.05
Reserpic acid401.206920.48[M+H]+C22H28N2O50.03
Ajmaline327.206129.40[M+H]+C20H26N2O20.02
Jerantinine B399.190919.11[M+H]+C22H26N2O50.02
Vinervine321.159624.46[M+H-H2O]+C20H22N2O30.01
Ellipticine247.122225.46[M+H]+C17H14N20.01
Unknown alkaloids (48)bN/AN/A[M+H]+N/A21.77
Polyphenols and other compounds, positive ESI
4-Guanidinobutanoic acid146.09186.13[M+H]+C5H11N3O2N/A
Betaine118.08594.52[M+H]+C5H11NO2N/A
Catechin291.085913.76[M+H]+, M+Na]+C15H14O6N/A
Choline104.10716.48[M]+C5H14NO+N/A
Epicatechin291.086115.97[M+H]+, [M+Na]+C15H14O6N/A
Glutamate148.05994.59[M+H]+C5H9NO4N/A
Indoleacetaldehyde177.101510.27[M+H]C10H9NON/A
Phosphocholine184.07285.29[M+H]+C5H14NO4PN/A
Phenolic compounds, negative ESI
5-O-Caffeoylquinic acid353.046111.86[M-H]C16H18O9<LOQc
1,3-Di-O-caffeoylquinic acid515.1217N/A[M-H]C25H24O12<LODd
1,5-Di-O-caffeoylquinic acid515.1210N/A[M-H]C25H24O12<LOD
3,4-Di-O-caffeoylquinic acid515.1207N/A[M-H]C25H24O12<LOD
3,5-Di-O-caffeoylquinic acid515.1208N/A[M-H]C25H24O12<LOD
3-O-Caffeoylquinic acid353.040915.28[M-H]C16H18O90.97±.015 mg/g bark
4,5-Di-O-caffeoylquinic acid515.1210N/A[M-H]C25H24O12<LOD
4-O-Caffeoylquinic acid353.0508N/A[M-H]C16H18O9<LOD
Caffeic acid179.0346N/A[M-H]C9H8O4<LOD
Catechin289.0729N/A[M-H]C15H14O6<LOD
Dihydrocaffeic acid181.0497N/A[M-H]C9H10O4<LOD
Dihydroferulic acid195.0651N/A[M-H]C27H30O16<LOD
Epicatechin289.0707N/A[M-H]C15H14O6<LOD
Epigallocatechin305.0668N/A[M-H]C15H14O7<LOD
Ferulic acid193.049719.6[M-H]C10H10O4<LOQ
Isoferulic acid193.0499N/A[M-H]C10H10O4<LOD
Kaempferol285.040521.95[M-H]C15H10O6<LOQ
Naringin579.1718N/A[M-H]C27H32O14<LOD
Quercetin301.034521.08[M-H]C15H10O7<LOQ
Rutin609.150219.01[M-H]C27H30O16<LOQ


Table 2. Body weight gain, food intake, liver weight and metabolic parameters of mice fed experimental diets
 
ParameterLFDHFDHFD + Low IbHFD + High Ib
All values are means ± SE of 11–12 animals. * p < 0.05 versus LFD. ** p < 0.05 versus HFD.
Body weight gain (g)0.33 ± 0.008.96 ± 0.72*11.6 ± 0.71*8.86 ± 0.67*
Food intake (g/day)2.74 ± 0.042.45 ± 0.04*2.48 ± 0.04*2.48 ± 0.04*
Feed efficiency (g weight gain/g food intake)0.002 ± 0.0000.052 ± 0.003*0.067 ± 0.003*0.051 ± 0.003*
Liver weight (g)0.834 ± 0.0421.31 ± 0.196*1.23 ± 0.044*1.09 ± 0.042*
Plasma glucose (mg/dL)243 ± 24.9310 ± 24.4*343 ± 12.4*284 ± 24.1*
Plasma triglycerides (mg/dL)48.8 ± 1.8960.6 ± 4.56*64.9 ± 4.57*66.6 ± 5.17*
Plasma cholesterol (mg/dL)170 ± 8.96256 ± 8.18*258 ± 8.96*231 ± 14.0*
Plasma LDL-C (mg/dL)43.9 ± 6.9588.7 ± 13.6*80.8 ± 7.82*80.6 ± 7.17*
Plasma HDL-C (mg/dL)54.7 ± 7.2972.4 ± 3.36*72.9 ± 1.99*74.1 ± 3.37*
Plasma insulin (ng/mL)ND1.35 ± 0.231.21 ± 0.161.33 ± 0.33
Plasma leptin (ng/mL)6.18 ± 1.6726.1 ± 2.26*30.8 ± 1.31*26.8 ± 1.81*
Plasma IL-6 (pg/mL)6.98 ± 0.469.96 ± 1.17*8.55 ± 0.65*8.75 ± 0.05*
Plasma ICAM-1(ng/mL)17.7 ± 3.4834.3 ± 2.34*33.8 ± 1.87*34.1 ± 1.97*
Plasma MCP-1 (pg/mL)134 ± 8.09810 ± 284.2*81.5 ± 23.6**337 ± 119
Plasma MMP-9 (ng/mL)30.9 ± 8.0945.6 ± 13.857.8 ± 14.330.6 ± 5.72
Plasma ALT (U/L)50.2 ± 3.9248.2 ± 1.9254.7 ± 7.045.2 ± 3.79
Plasma AST (U/L)156 ± 12.9147 ± 8.81118 ± 13.8131 ± 21.2