| Journal of Food Bioactives, ISSN 2637-8752 print, 2637-8779 online |
| Journal website www.isnff-jfb.com |
Original Research
Volume 2, June 2018, pages 119-128
Wheat gliadin deamidated by cation-exchange resins induces oral tolerance in a mouse model of wheat allergy
Ryosuke Abea, Narumi Matsukazea, Yusuke Yamaguchia, Makoto Akaoa, Hitoshi Kumagaib, Hitomi Kumagaia, *
aDepartment of Chemistry and Life Science, Nihon University, 1866 Kameino, Fujisawa-shi 252-0880, Japan
bDepartment of Food Science and Nutrition, Kyoritsu Women’s University, 2-2-1 Hitotsubashi, Chiyoda-ku, Tokyo 101-8347, Japan
*Corresponding author: Hitomi Kumagai, Department of Chemistry and Life Science, Nihon University, 1866 Kameino, Fujisawa-shi 252-0880, Japan
DOI: 10.31665/JFB.2018.2147
Received: March 7, 2018
Revised received & accepted: June 20, 2018
| Abstract | ▴Top |
Wheat allergy is a serious disease because it is difficult to be outgrown and sometimes induces anaphylaxis. Gliadin, a major allergen in wheat, deamideted by cation-exchange resins (DG) had low allergenicity not only in vitro but also in vivo. As the allergen-specific immunotherapy, a treatment for allergies, hold a risk of severe allergic reaction, the deamidated gliadin that has low allergenicity would provide an effective tool for treatment of wheat allergy. Thus, we examined if DG would induce oral tolerance using a mouse model of wheat allergy. Mice sensitized with untreated gliadin (UG) by intraperitoneal injection were orally administered with DG every other day for four weeks, and then UG was orally challenged to induce systemic anaphylaxis. Repeated oral administration of DG suppressed allergic reaction induced by UG challenge, and dramatically increased the number of regulatory T cells indicating deamidated gliadin induced oral tolerance.
Keywords: Wheat gliadin; Deamidation; Wheat allergy; Oral tolerance; Cation-exchange resin
| 1. Introduction | ▴Top |
The number of patients suffering from food allergy such as milk, egg, peanuts and wheat has been continuously increasing since several decades ago (Moneret and Morisset, 2005; Hischenhuber et al., 2006; Scibilia et al., 2006). However, cow’s milk and egg allergies are often outgrown as the patients get older though they are common in babies and infants. On the other hand, wheat allergy is less likely to be outgrown and can be a lifelong disease. Wheat is widely consumed as a staple food in many countries and the main component of various foods such as bread, noodles, and cakes. In addition, people with wheat allergy sometimes have cross reactivity to other cereals such as rice, corn, and barley. Therefore, patients need to heavily restrict their diets throughout their lives, and wheat allergy is still considered as a serious problem.
Oral allergen-specific immunotherapy (oral-SIT) proposed as a possible method of desensitization and induction of tolerance is now increasingly used to treat food allergies (Rupa and Mine, 2012; Chen et al., 1994). Several studies on this therapy have shown successful examples for specific food allergens such as wheat (Troncone and Ferduson., 1988), milk (Hachimura et al., 1993; Ueno et al. 2016), egg (Chen et al., 1994; Rupa and Mine, 2012; Yamada et al., 2014), peanut (Strid et al., 2004), and beef (Tanabe et al., 2004). The currently understood mechanism of the oral-SIT is thought to be associated with the modification of cellular and humoral response to allergens. The ratio of T helper 1 (Th1) cytokines to T helper 2 (Th2) cytokines increases following this therapy, and functional regulatory T (Treg) cells are induced. The production of interleukin-10 (IL-10) by monocytes, macrophages, B cells and T cells as well as the expression of transforming growth factor-β (TGF-β) are increased. TGF-β, together with IL-10, might contribute to Treg-cell function and immunoglobulin class switching from IgM to IgA and IgG2a. These immunoglobulins compete with IgE for allergen binding, decreasing the allergen capture and presentation that is facilitated by IgE in complex with the high-affinity receptor for IgE (FcεRI). In addition, this therapy reduces the number of mast cells and impairs the ability of mast cells to release mediators. The recruitment of eosinophils to sites of allergen exposure is also reduced. However, the provocation of possibly life-threatening anaphylactic reaction occasionally occurs with this therapy, due to the multivalent B-cell epitopes crosslinked with IgE present on the surface of mast cells and basophils.
This serious disadvantage can be bypassed if peptides from allergens contain an immune-dominant T-cell determinant without any B-cell epitope sequences. Several researchers have recently reported that administration of T-cell epitopes of egg-white allergens, ovomucoid and ovalbumin, and a pollen allergen, Cryj2, reduced the reactions to the allergen probably by inducing anergy, T-cell deletion, and active cellular suppression mediated by Treg cells (Rupa and Mine, 2012; Murasugi et al., 2005; Yang and Mine, 2009). In addition, some other researchers have succeeded in reducing the allergenicity of gluten and casein by an enzymatic treatment (Watanabe et al., 1995; Hachimura et al., 1993; Ueno et al., 2016), suggesting that partially modified wheat flour and cow’s milk may induce oral tolerance.
Gliadin and glutenin, the major proteins of wheat, are the principal allergens of wheat-dependent exercise-induced anaphylaxis (WDEIA). Gliadin has many similar IgE binding epitopes with the sequences of the glutamine residues tandem (Matsuo et al., 2004; Watanabe et al., 1995; Tanabe et al. 1996). Thus, deamidation, which converts glutamine residues to glutamic-acid residues, could be an effective approach to reduce the allergenicity of wheat proteins. We have developed a technique for effective deamidation of proteins by using cation exchange resins of the carboxylate type. Different from the common deamidation method by acid, this method does not cause any detectable peptide-bond hydrolysis and prevents the production of bitter-tasting peptides during deamidation. Although enzymatic deamidation is also popular, enzymes are easily inactivated in organic solvents and cannot be used for the deamidation of ethanol-soluble proteins like gliadin. In addition, it is difficult to separate enzymes from deamidated proteins. On the other hand, deamidation by cation-exchange resins can be performed even in an ethanol solution, and cation-exchange resins can be easily separated by simple filtration after the reaction. Thus, deamidation by cation-exchange resins have advantages over that by acid and enzymes.
In our previous studies, deamidated gliadin obtained by the cation-exchange treatment displayed decreased reactivity with both IgE and IgG in the sera from patients who were RAST-positive to wheat (Kumagai et al., 2007) and low allergenicity in a mouse model of wheat-gliadin allergy (Abe et al., 2014). It was recently reported that spleen cells from mice sensitized with undeamidated or deamidated gliadin secreted significantly higher level of IL-4 than those from mice without sensitization (Gourbeyer et al., 2012). The activation with deamidated gliadin had the same impact on IL-4 production as that with undeamidated one. These results indicate that deamidated gliadin has T-cell receptor binding epitopes. As deamidated gliadin has lower IgE antibody binding activity but has T-cell receptor binding epitopes, it may induce oral tolerance without serious anaphylaxis.
In this study, we examined if the gliadin deamidated without causing peptide-bond hydrolysis by cation-exchange resins would induce oral tolerance in a mouse model of wheat gliadin allergy.
| 2. Materials and methods | ▴Top |
2.1. Deamidation of wheat gliadin
Wheat gliadin was extracted from gluten (Nakarai Tesque, Kyoto, Japan) with 60% ethanol. After being concentrated under vacuum, the extract was lyophilized and the obtained powder was termed undeamidated gliadin (UG). Cation-exchange resins of the carboxylate type (WK-11, Mitsubishi Chemical Corporation, Tokyo, Japan) were washed with 1 M NaOH and then packed into a glass column (575 × 50 mm, Nippon Flex Co., Aichi, Japan) being equilibrated with 60% (v/v) ethanol. Then, 30 mL of 10 mg/mL UG in 60% (v/v) ethanol were loaded onto the column, and eluted with 60% (v/v) ethanol at 5 mL/min. Fractions were collected over 220 min. Deamidated gliadin (DG) obtained as the eluate was concentrated under vacuum and lyophilized.
2.2. Degree of deamidation
The degree of deamidation was obtained as the ratio of the amount of removed acid amide of DG to the total acid amide of UG as described previously (Kumagai et al., 2004; Abe et al., 2014). UG and DG were both completely deamidated by heating in a 4 M HCl solution, and the amount of ammonia produced was measured by Conway’s micro-diffusion method (Conway and Byrne, 1933) and the indophenol method (Akamatsu, 1952). The amount of removed acid amide was calculated by subtracting the amount of ammonia produced from DG from that produced from UG.
2.3. Animals
Male BALB/c mice of 5 weeks of age (18–22 g body weight) were purchased from Japan SLC Inc. (Shizuoka, Japan). All mouse experiments were performed in accordance with the Guidelines for Animal Experiments of the College of Bioresource Sciences of Nihon University (approval number: AP16B006). Water was made available from bottles, and a commercial mouse diet (CLEA Rodent Diet CE-2: CLEA Japan Inc. Tokyo, Japan) was provided ad libitum.
2.4. Sensitization and intragastric administration
As illustrated in Figure 1, mice in the Control (n = 7), UG (n = 7) and DG (n = 7) groups were sensitized twice, 2 weeks apart, with 50 μg of UG in 200 μL of aluminum-hydroxide solution (Imject Alum; Thermo Scientific, Kanagawa, Japan) as an adjuvant by intraperitoneal injection. Unsensitized group (n = 7) was injected twice with 200 μL of aluminum-hydroxide solution. Then, 2 weeks after the second sensitization, mice in the UG and DG groups were administered 20 mg/mouse of UG or DG in distilled water three times a week for a period of 4 weeks by intragastric administration. Unsensitized and Control groups were administered distilled water three times a week for a period of 4 weeks by intragastric administration. Before each intragastric administration, the mice were deprived of their diet for 4 h. A week after the final administration, 20 mg/mouse of UG was orally challenged. Then, 40 min after the oral challenge, the mice were anesthetized by injection of 3% pentobarbital solution into the abdominal cavity (10 μL/g body weight) and the blood from the postcaval vein and the lower part of the small intestine were collected from the mice under anesthesia. The sera were separated from the blood samples by centrifugation at 1,300 ×g and 20 °C for 15 min after clotting and stored at −80 °C until assayed. For the measurement of Treg cells, the blood was collected in 0.5 mL heparinized tubes from individual mouse and peripheral blood mononuclear cells (PBMCs) containing mainly lymphocytes were isolated by gradient centrifugation (Lymphoprep; COSMO Bio Co., LTD. Tokyo, Japan). The intestine excised was rinsed with PBS.
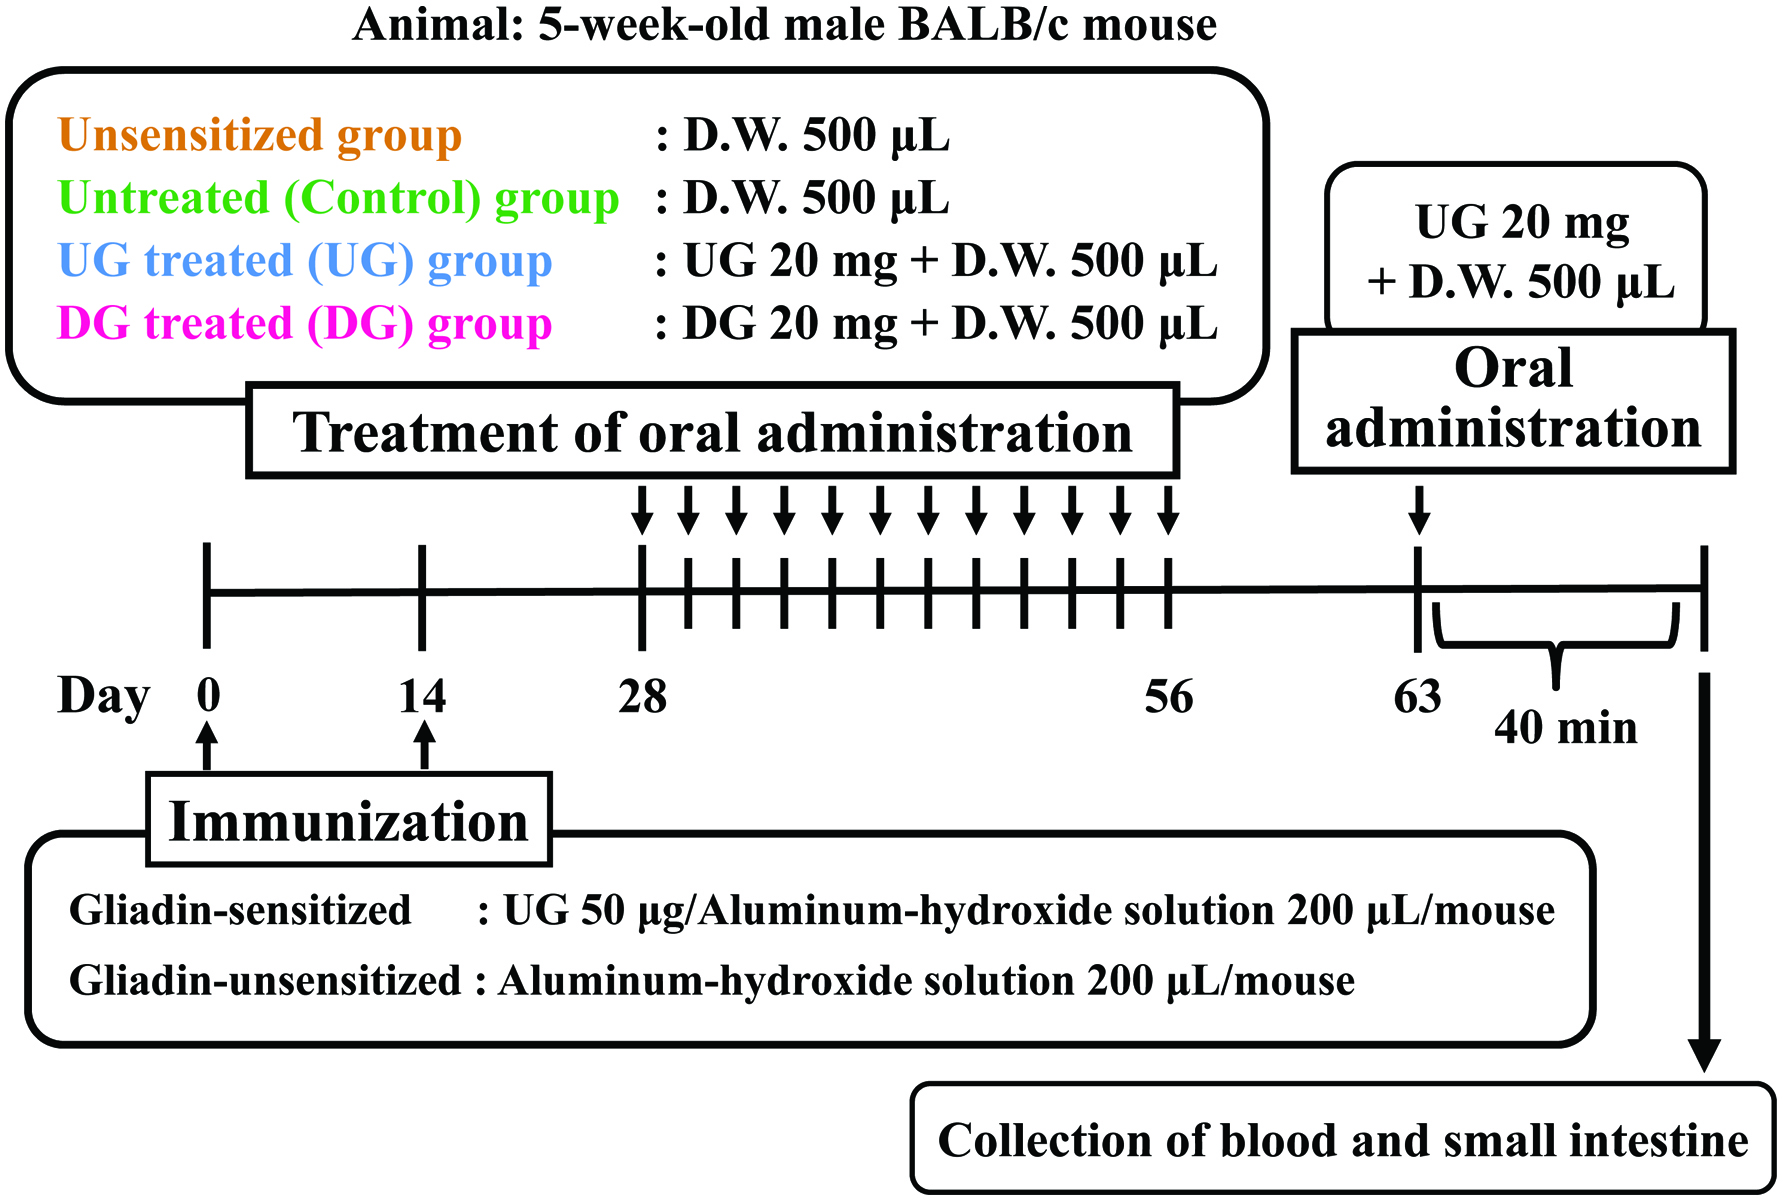 Click for large image | Figure 1. Experimental design for evaluation of induction of oral tolerance by deamidated gliadin. |
2.5. Intestinal permeability
The intestinal permeability of large molecules enhanced by inflammation was evaluated by the amount of horseradish peroxidase (HRP) (molecular mass 40 kDa; Wako Pure Chemical Industries, Osaka, Japan) that passed through the wall of the small intestine as described previously (Abe et al., 2014). Briefly, 0.1 mL of 0.1 mg/mL HRP in PBS was injected into the lumen of a closed loop of a 5-cm length of the intestine, and the loop was then placed in 5 mL of PBS at 37 °C. After incubation from 5 to 60 min, 50 μL of the outside solution were collected into the well of a microtiter plate. The concentration of HRP that had permeated from the lumen through the intestinal wall was measured by adding 100 μL of 0.04% o-phenylendiamine with H2O2 to each well. The HRP reaction was proceeded for 20 min at room temperature and then stopped by adding 100 μL of 1 M H2SO4. The optical density of the formazan produced by the reaction was measured at 490 nm with a microtiter plate reader (Model 550 Reader, Bio-rad Laboratories, Tokyo, Japan).
2.6. Gliadin-specific immunoglobulin level
To determine the levels of gliadin-specific IgE, IgG, IgG1, IgG2A and IgA in the sera, 100 μL of 10 μg/mL gliadin in 60% ethanol were added to the wells of a microtiter plate, and allowed to stand at 4 °C overnight. Non-specific binding was blocked with the addition of 200 μL of 2% BSA/PBST and incubation at 37 °C for 1 h. Then, 100-μL aliquots of serum diluted 10 times with 0.3% BSA/PBST were added to the wells, and incubated at 37 °C for another 2 h. To detect each immunoglobulin in the sera, 100 μL of biotinylated anti-mouse immunoglobulin antibodies diluted 1,000 times with 0.3% BSA/PBST, were added to the wells followed by incubation for 2 h at 37 °C. Then, 100-μL aliquots of HRP-conjugated streptavidin (Funakoshi Co., Tokyo, Japan) diluted 3,000 times with 0.3% BSA/PBST were added to each well, and incubation was continued at 37 °C for another 1 h. The wells were washed 5 times with PBST at every step. As a substrate for HRP, 100 μL of 0.04% o-phenylendiamine containing H2O2 were added to the wells and reacted for 20 min at room temperature. The reaction was stopped by adding 100 μL of 1 M H2SO4 and the optical density was measured at 490 nm with a microtiter plate reader.
2.7. Detection of regulatory T cells
Extracellular staining of PBMCs with FITC-conjugated anti-mouse-CD4 and PE-conjugated anti-mouse-CD25 (e-Bioscience; San Diego, CA, USA) and intracellular staining with anti-mouse-FoxP3 (e-Bioscience) were performed as described by the manufacturer (e-Bioscience). Cells were acquired using a LSRII flow cytometer (BD Biosciences, San Jose, CA, USA), and the data were analyzed with FlowJo 6.4.2 software (Tree Star Inc., Ashland, OR, USA).
2.8. Free histamine level
The histamine level was measured by fluorometric analysis as described by Abe et al. (2014). Briefly, 500 µL of the sera were mixed with the same amount of 1 M perchloric acid, and centrifuged at 13,000 ×g for 10 min. The supernatant was collected, and stored at −20 °C until further analysis. For the analysis, 1 mL of the supernatant was mixed with 0.135 mL of 1 M NaOH containing 0.75 mg of NaCl, and then 1.75 mL of a 3:2 (v/v) mixture of 1-butanol and chloroform was added. After stirring for 5 min and centrifugation at 500 ×g for 5 min, 1.5 mL of the organic solvent layer was recovered and mixed with 1.5 mL of 1-heptane and 0.6 mL of 0.1 M HCl. After further stirring for 5 min and centrifugation at 500 ×g for 5 min, 1.5 mL of the HCl layer recovered was mixed with 0.12 mL of 1 M NaOH and 0.1 mL of 0.2% o-phthalaldehyde (Wako Pure Chemical Industries, Osaka, Japan). The reaction was allowed to proceed at 4 °C for 40 min and terminated by adding 0.05 mL of 0.25 M H2SO4. The fluorescence intensity (excitation at 360 nm and emission at 440 nm) was measured with a microtiter plate reader.
2.9. Cytokine analysis
Each cytokine concentration was measured using ELISA kits for IL-4, IL-12, IFN-γ, IL-17, IL-10 and TGF-β (e-Bioscience).
2.10. Statistical analysis
All data were expressed as the mean ± SEM, and the significance of the differences (p values) between groups was evaluated by using Tukey-Kramer test.
| 3. Results | ▴Top |
3.1. Degree of deamidation
Wheat gliadin was effectively deamidated with the cation exchange resins of the carboxylate type. The acid amide removed through deamidation amounted to 421.3 μmol/g of protein. As the amount of acid amide in UG was about 1,784.8 μmol/g of protein, the degree of deamidation was 23.6%.
3.2. Intestinal permeability and serum histamine level
Allergic inflammation may enhance intestinal permeability, permitting large molecules such as proteins to be absorbed from the small intestine. Figure 2a presents the intestinal permeability of the UG, DG, Control, and unsensitized groups. The intestinal permeability of HRP at 60 min after incubation was enhanced in the UG and Control groups. On the other hand, the intestinal permeability of DG-treated mice was almost the same level as that of unsensitized mice.
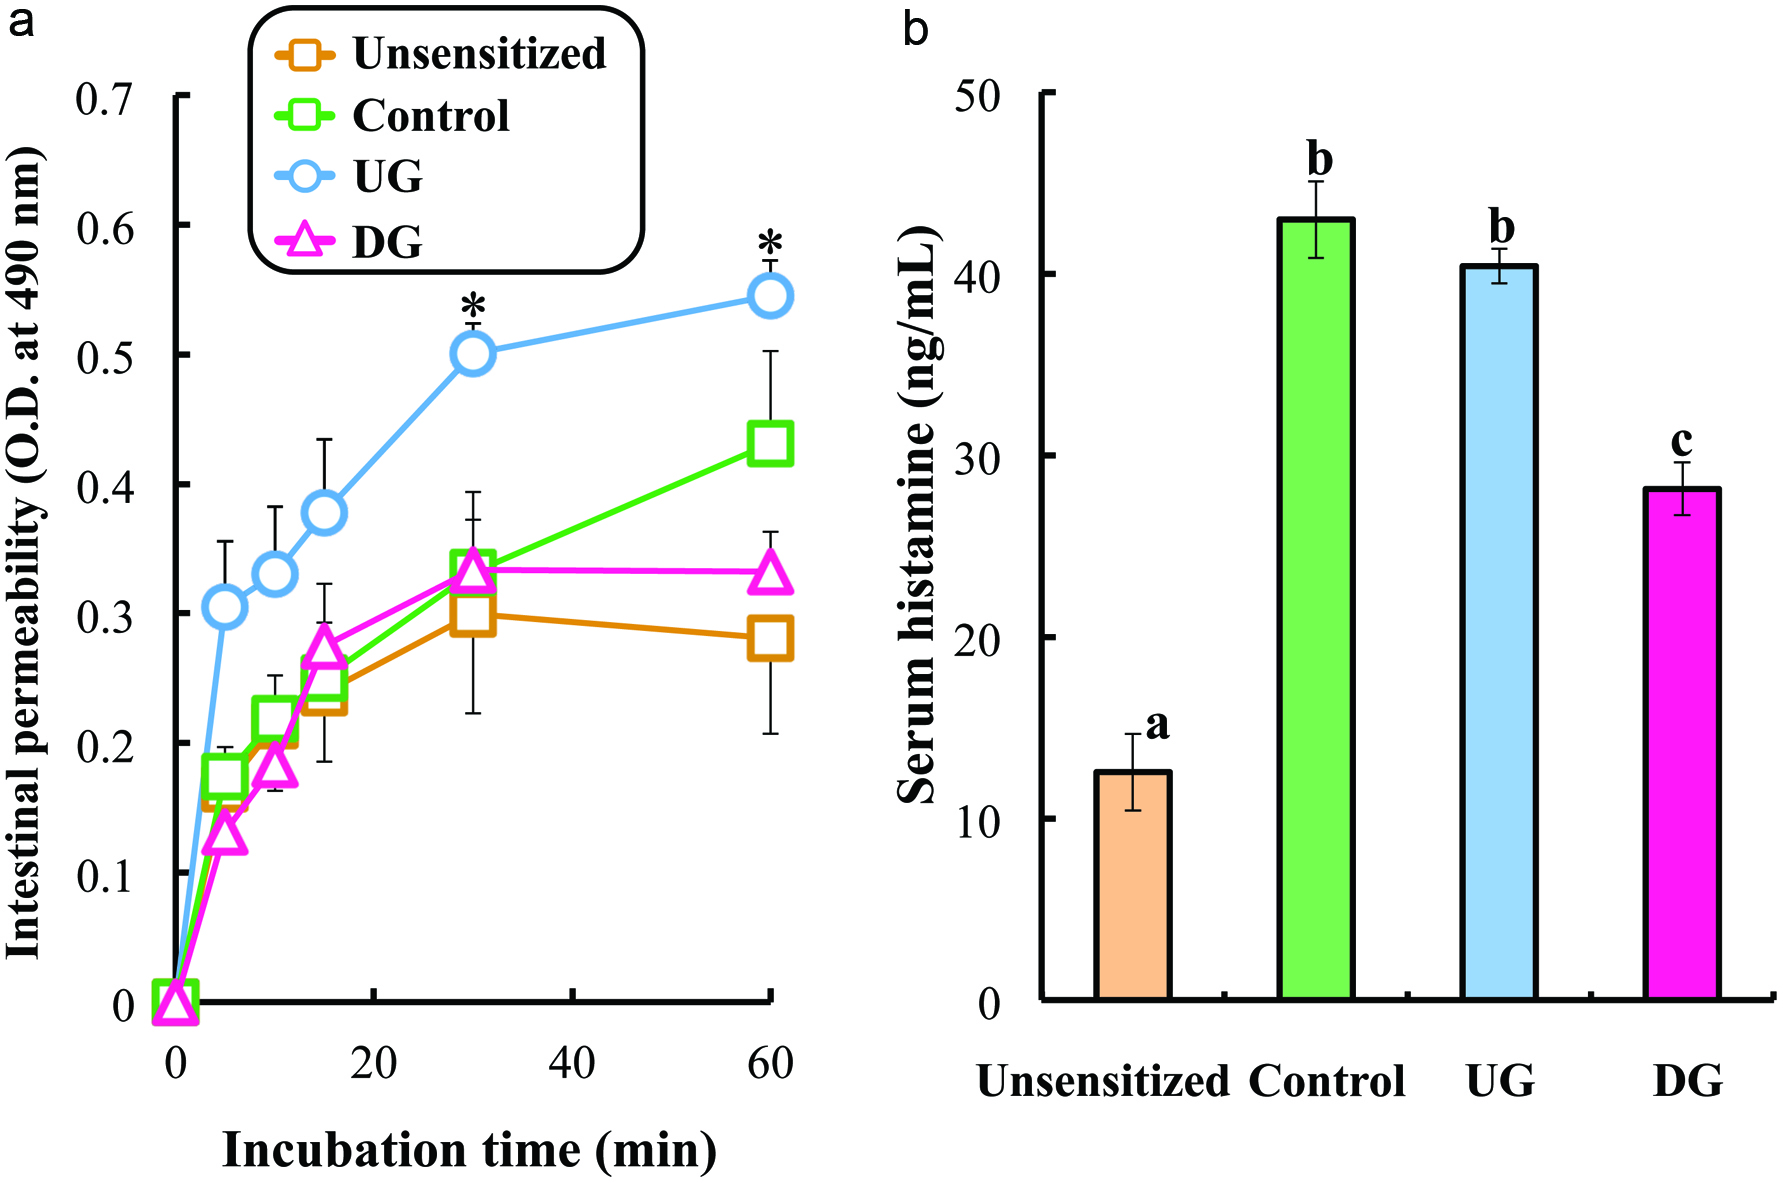 Click for large image | Figure 2. Intestinal permeability (a) and serum histamine level (b) of gliadin-sensitized mice after repeated sample administration and gliadin challenge. |
Figure 2b shows the level of serum histamine. The histamine level was enhanced in UG-treated and untreated mice. The significant reduction in histamine concentration was observed in DG treated mice (p < 0.01).
3.3. Gliadin-specific immunoglobulin level
Figures 3 and 4 show the levels of IgE, IgG, IgG1 IgGA2 and IgA specific for gliadin in the sera of the UG, DG, Control, and unsensitized groups. The level of gliadin-specific IgE in the sera was significantly enhanced in the Control and UG groups, whereas the enhancement of IgE production was significantly suppressed in the DG group. No significant deference in gliadin-specific IgG level was observed between the DG and UG groups. The IgG1 level of the DG group was significantly lower than that of the UG and Control groups, whereas the IgG2a level of the DG group was significantly higher than that of the UG and Control groups (p < 0.01). The IgA level of the DG group was significantly higher than that of the other groups (p < 0.01).
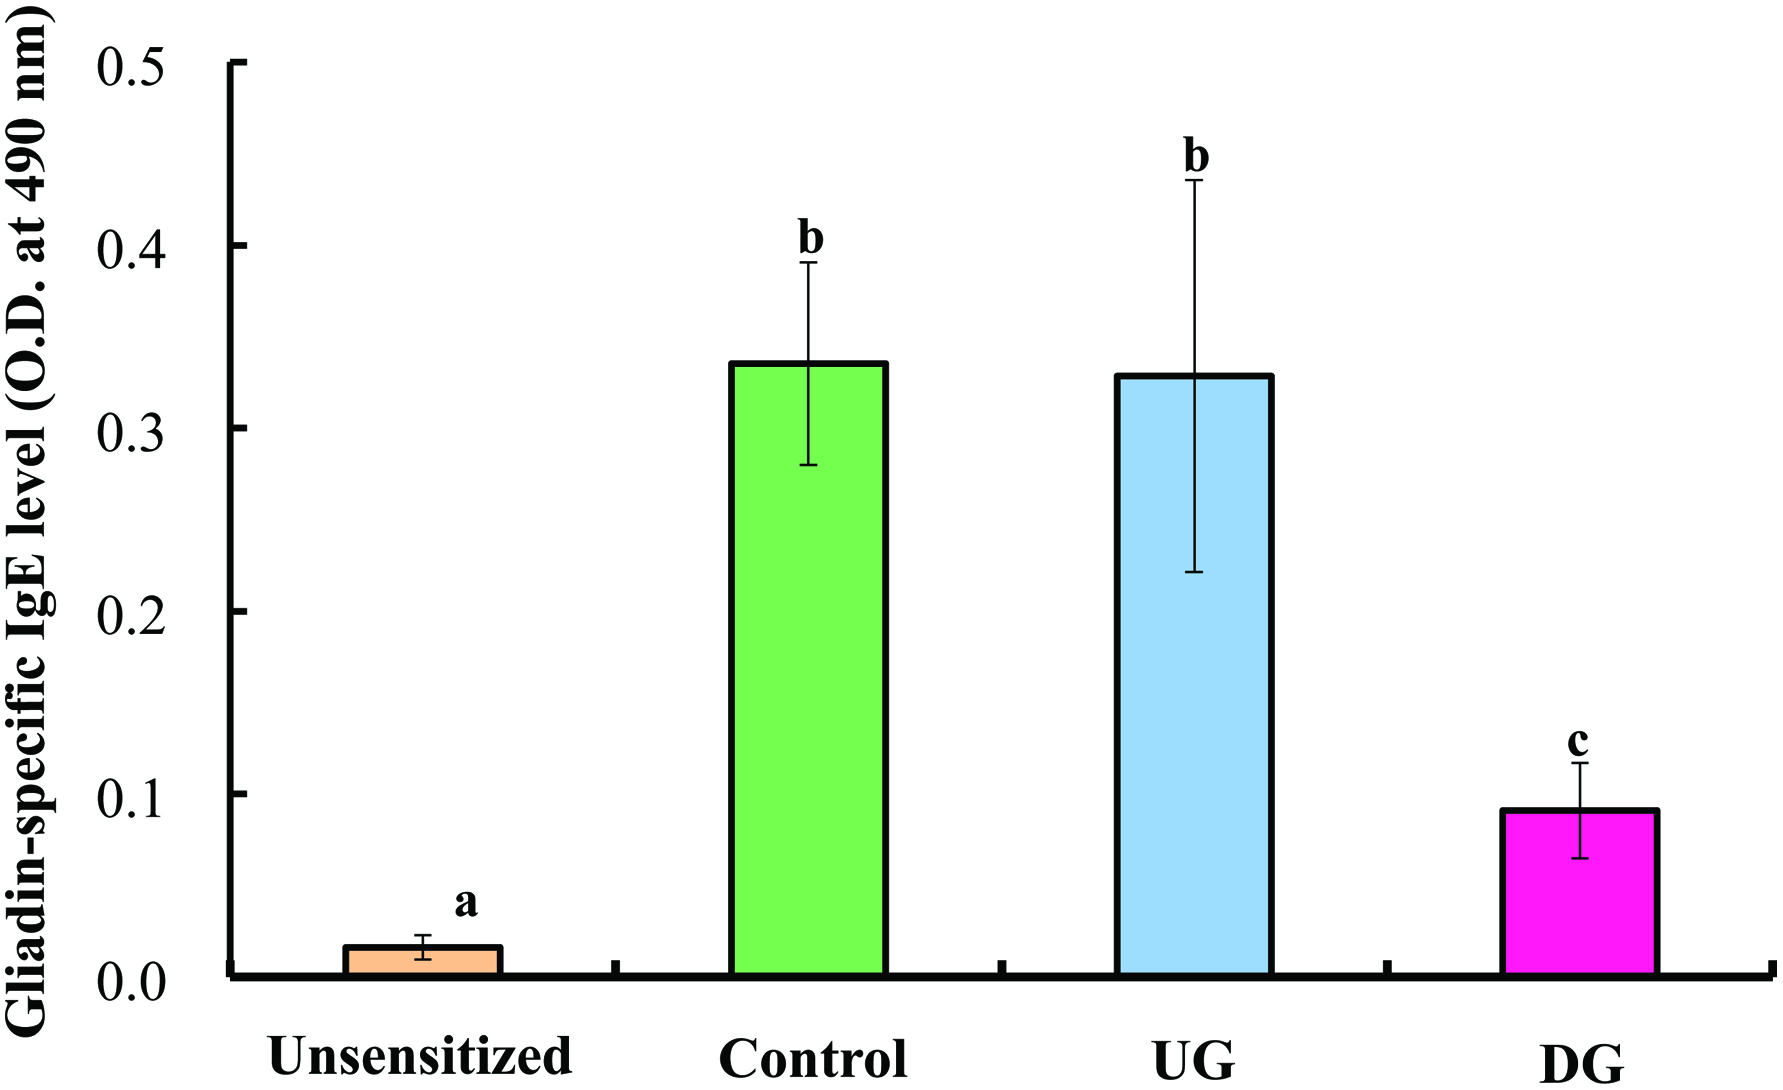 Click for large image | Figure 3. Serum gliadin-specific IgE level of gliadin-sensitized mice after repeated sample administration and gliadin challenge. |
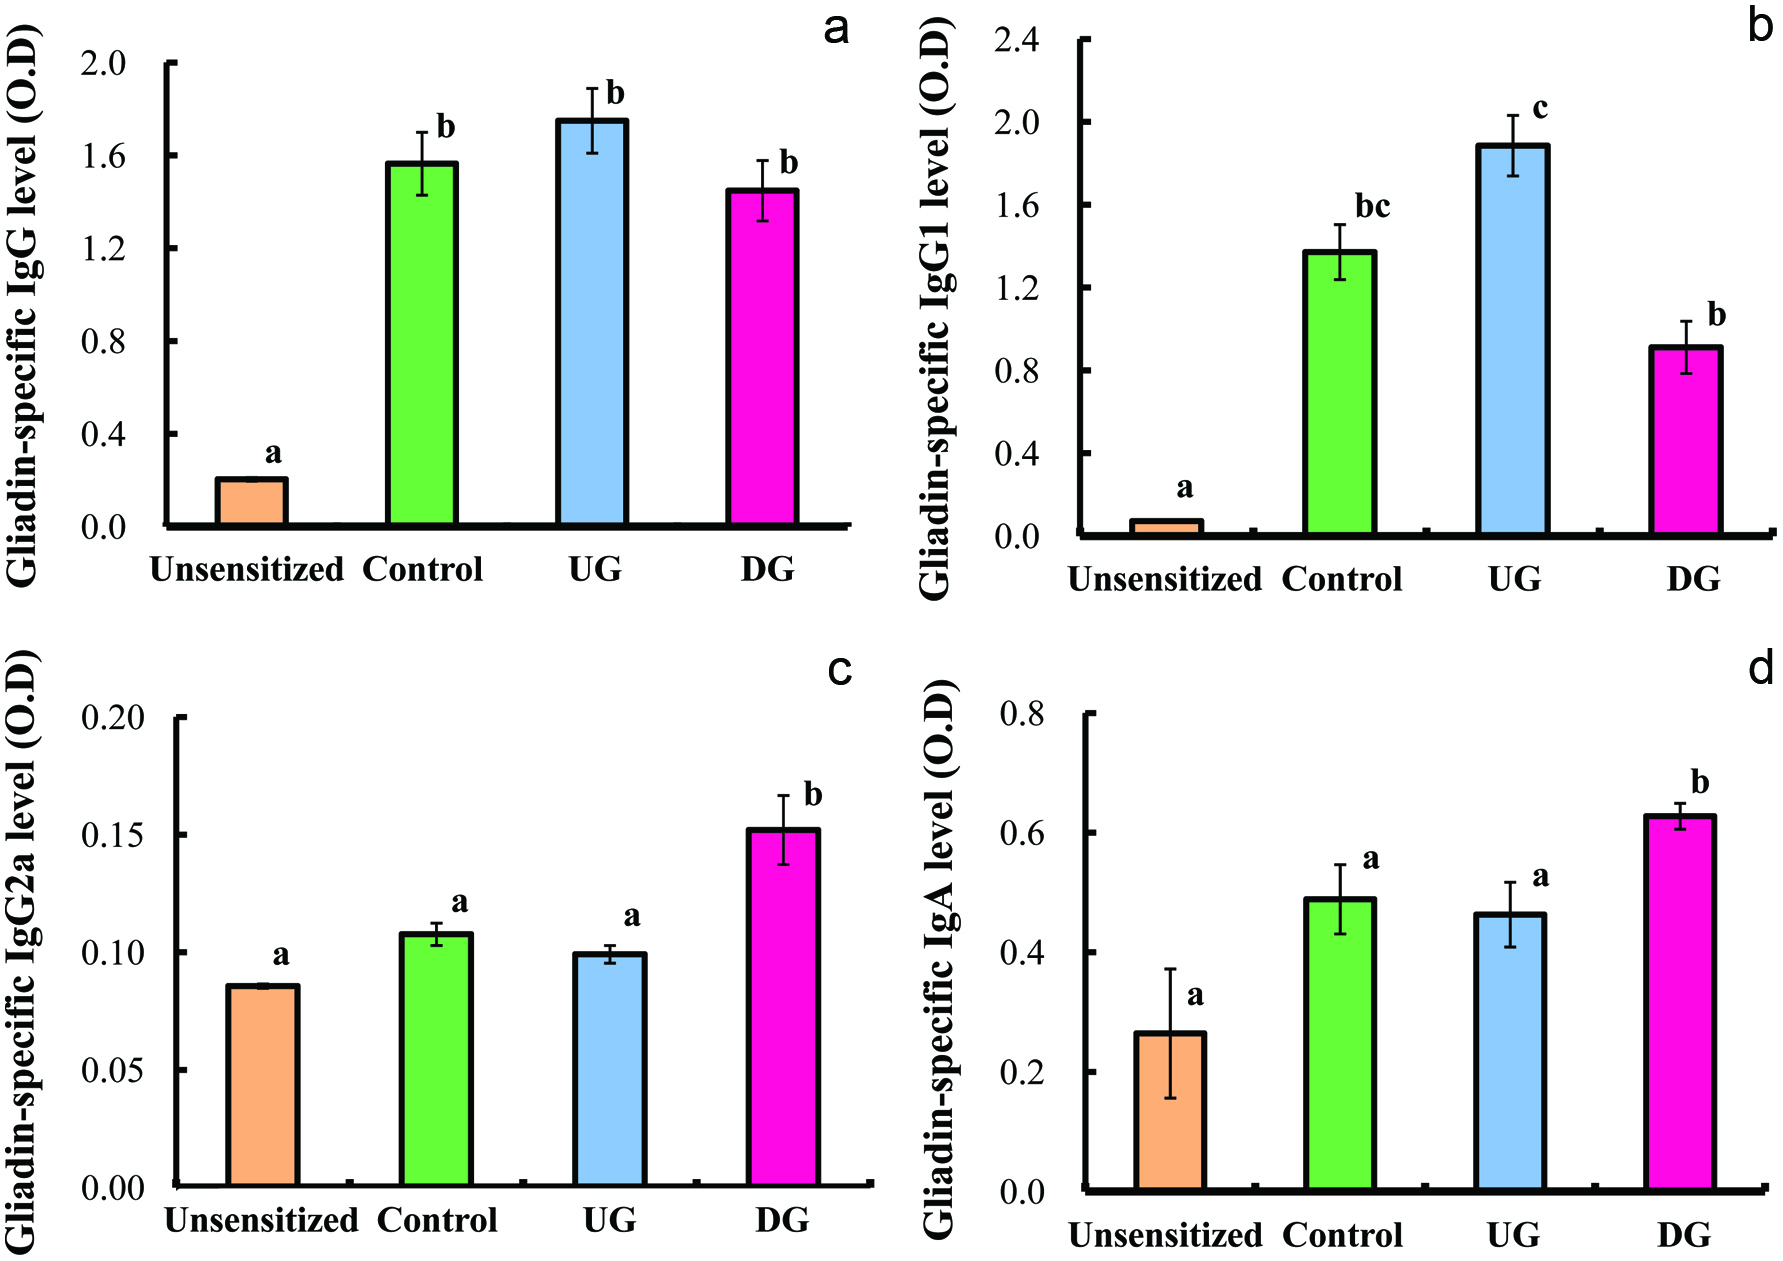 Click for large image | Figure 4. Serum gliadin-specific IgG (a), IgG1 (b), IgG2a (c) and IgA (d) levels of gliadin-sensitized mice after repeated sample administration and gliadin challenge. |
3.4. Cytokine level
Figures 5 and 6 show the levels of IL-4, IF-γ, IL-12, IL-10, TGF-β and IL-17 in the sera of the UG, DG, Control, and unsensitized groups. The level of IL-4 cytokine (Th2 cytokine) of the DG group was significantly lower than that of the UG and Control groups. No significant differences in the levels of IFN-γ, IL-12 (T helper 1 cytokine), IL-17 (T helper 17 cytokine), and IL-10 (regulatory T cytokine) were observed among the UG, DG and Control groups (p < 0.01). The TGF-β production of the DG group was significantly higher than that of the other groups (p < 0.01).
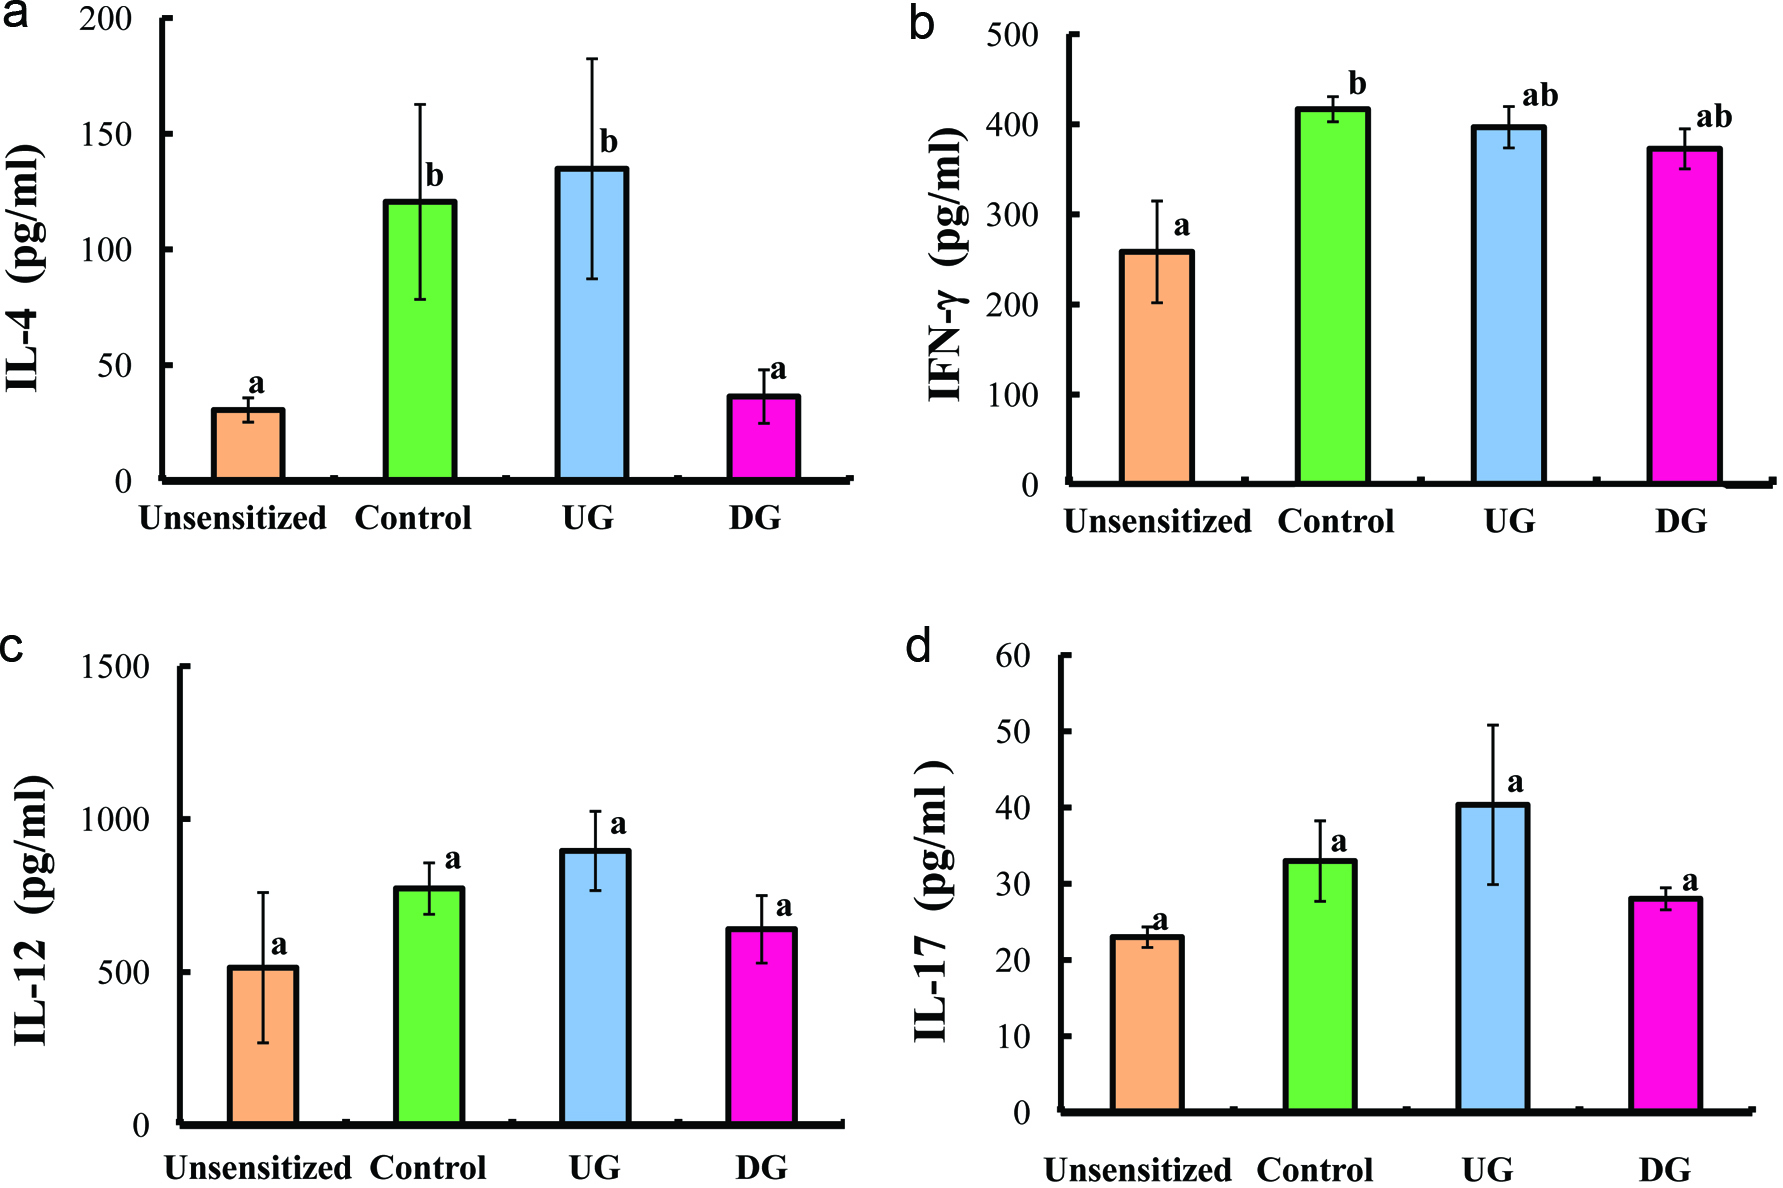 Click for large image | Figure 5. Serum IL-4 (a), IFN-γ (b), IL-12 (c), and IL-17 (d) levels of gliadin-sensitized mice after repeated sample administration and gliadin challenge. |
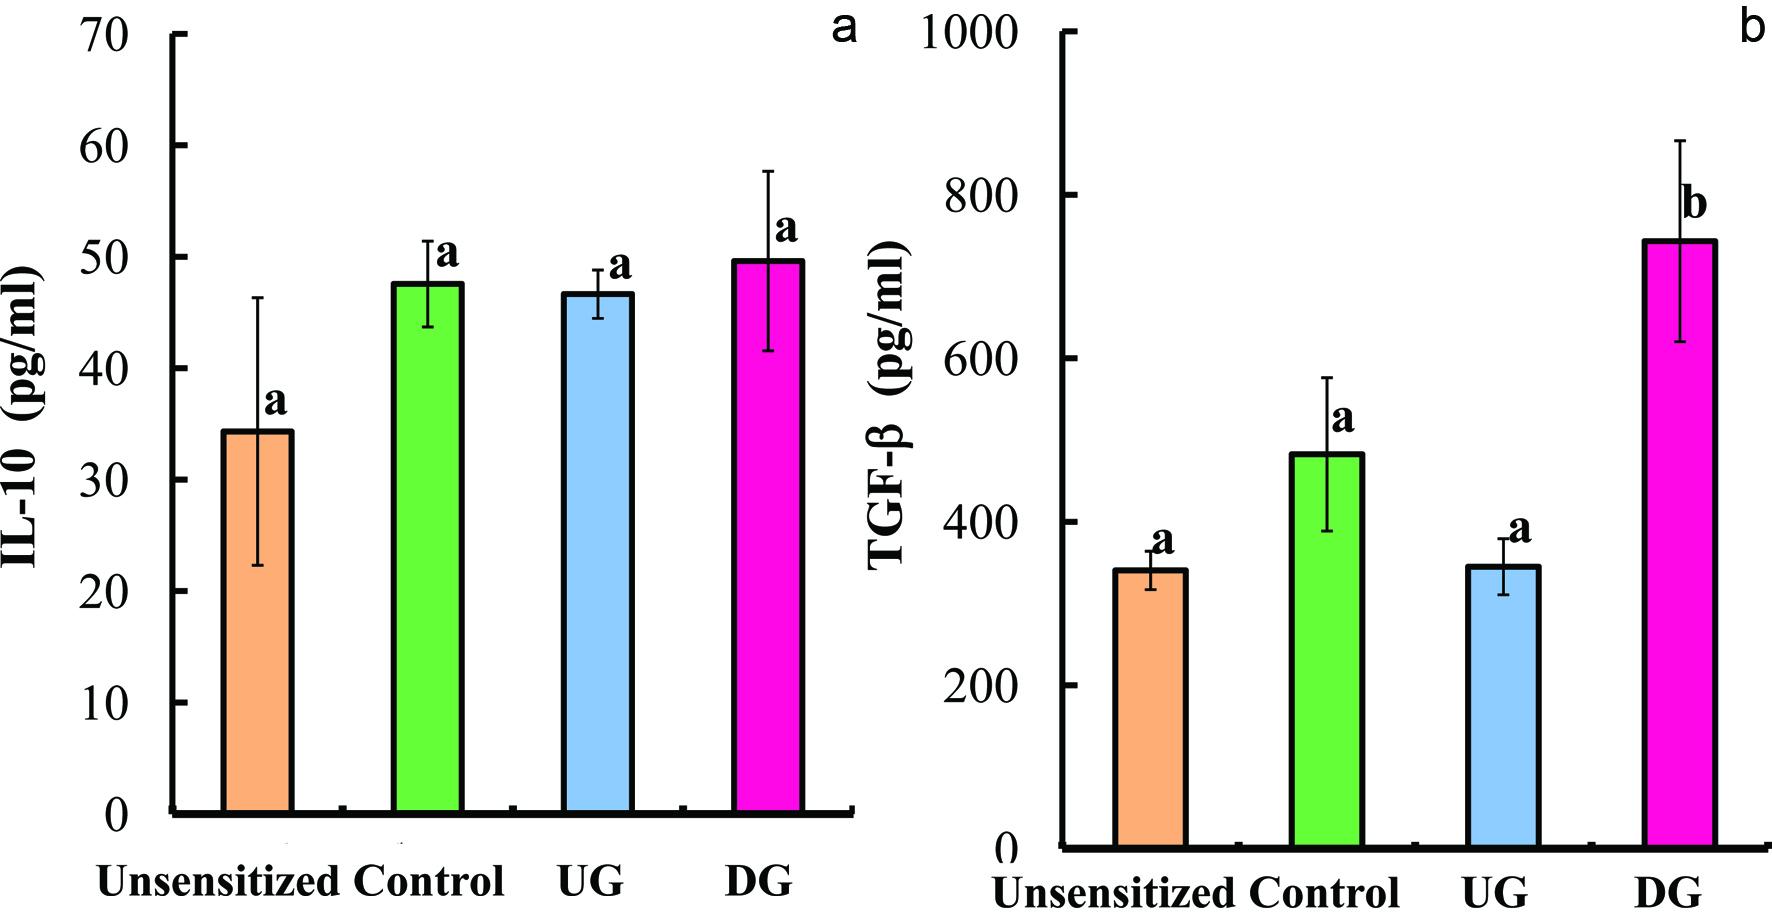 Click for large image | Figure 6. Serum IL-10 (a) and TGF-β (b) levels of gliadin-sensitized mice after repeated sample administration and gliadin challenge. |
3.5. Regulatory T cells
Figure 7 presents flow cytometric dot plots of FITC-conjugated CD4+ and PE-conjugated FoxP3 cells for all the group, and Figure 8 shows the percentage of CD4+CD25+ and CD4+FoxP3+ cells. The percentage of CD4+CD25+ and CD4+FoxP3+ cells of the DG group were higher than that of the other groups.
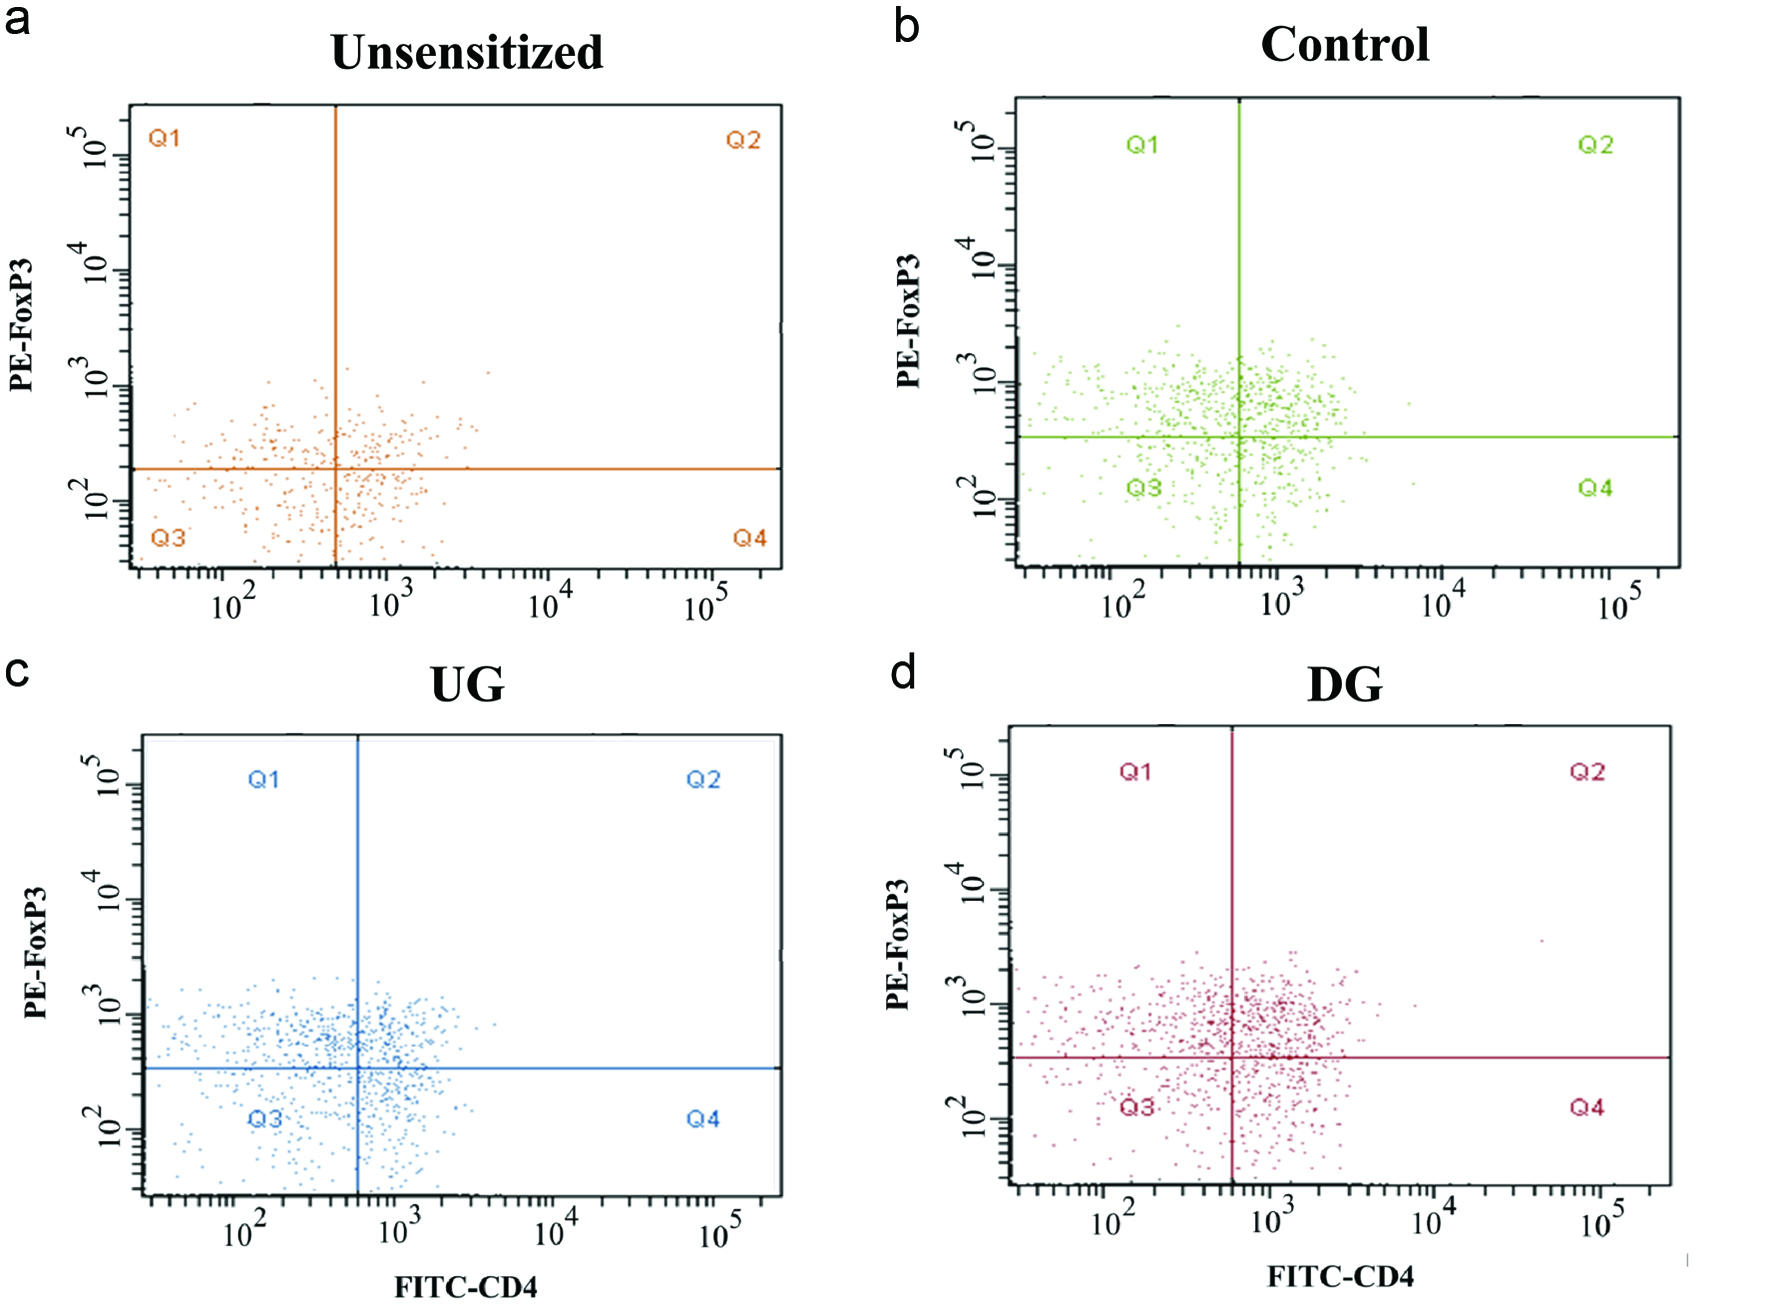 Click for large image | Figure 7. Flow cytometric dot plots of Treg (CD4+FoxP3+) cells of Unsesitized (a), Control (b), UG (c), and DG (d) groups. |
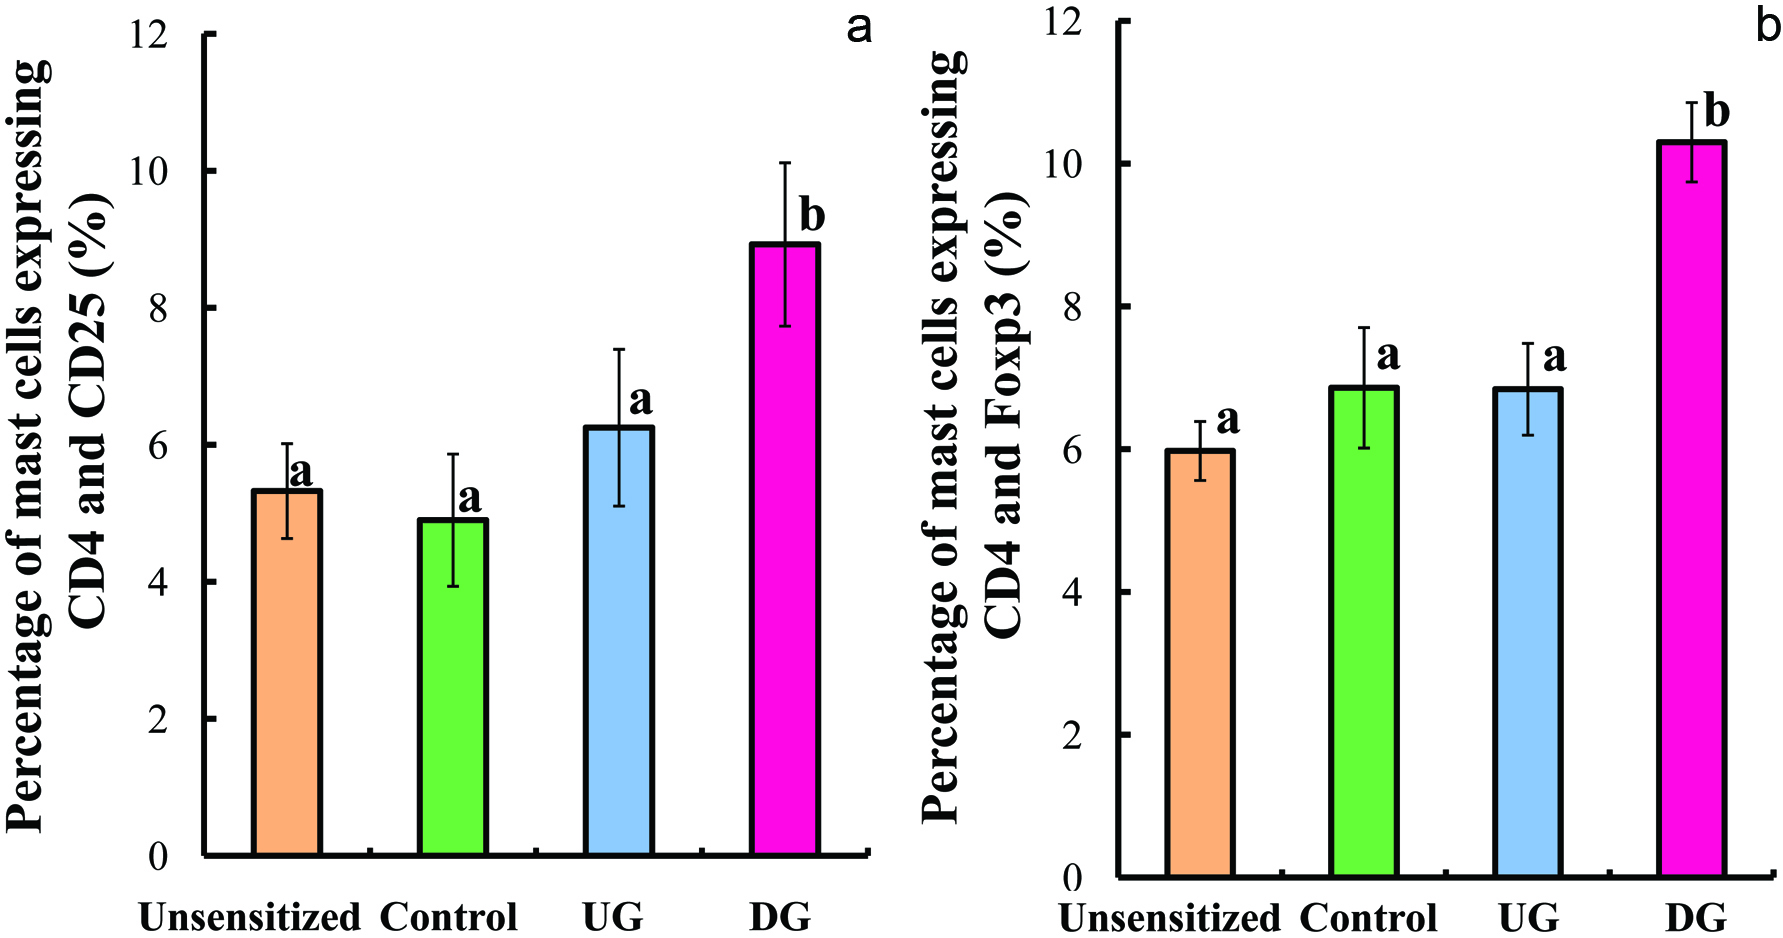 Click for large image | Figure 8. Percentage of lymphocyte cells expressing CD4+CD25+ (a) and CD4+FoxP3+ (b). |
| 4. Discussion | ▴Top |
Wheat allergy is one of the common food hypersensitivities that lead to various clinical symptoms including atopic dermatitis (eczema), urticarial (hives), diarrhea, asthma, rhinitis, and nausea. Wheat allergy is mainly classified into three types which are baker’s asthma, coeliac disease, and wheat-dependent exercise-induced anaphylaxis (WDEIA). Baker’s asthma is a respiratory disorder caused by inhalation of wheat flour. Coeliac disease is a common intestinal disorder caused by ingestion of wheat gluten and related cereal proteins. WDEIA is an immediate hypersensitive reaction, displaying life-threatening symptoms such as hypotension, dyspnea, and generalized urticarial. WDEIA is caused by an IgE response after the intake of a wheat allergen and physical exercise. Allergen-specific immunotherapy (SIT), the repeated administration of small amount of a native allergen for a long period, has been used to treat allergies (Rolland et al., 2009). However, SIT has a risk of adverse side effects like severe allergic reactions. To avoid this risk, modified allergens that have less response than native allergens would be useful. Native allergens have B-cell epitopes, the IgE binding sites related to allergic reaction, and T-cell epitopes which activate T cells. Desirable allergens for SIT are those that delete B-cell epitopes and remain T-cell epitopes.
Gliadin and glutenin are involved in the development to wheat allergy (Matsuo et al., 2005). In particular, wheat ω-5 gliadin is a major allergen in WDEIA (Palosuo et al., 2001). Some tandem sequences including glutamine residues in ω-5 gliadin constitute are the primary structure of IgE-binding epitopes such as QQIPQQQ, QQSPQQQ, and QQFPQQQ (Matsuo et al., 2004). Therefore, deamidation which converts glutamine residues to glutamic-acid residues could be an effective approach to reduce the allergenicity of wheat gliadin. Deamidation of gluten or gliadin reduced the reactivity with sera of patient allergic to wheat (Maruyama et al., 1999; Kumagai et al., 2007). Furthermore, the deamidated gliadin by cation-exchange resins had low allergenicity in allergy-model mice (Abe et al., 2014). Although the use of HCl is the most common means for deamidation of proteins, it causes unfavorable peptide-bond hydrolysis and the amide group in the side chain is deamidated excessively. On the other hand, deamidation by cation-exchange resins does not causes any detectable peptide-bond hydrolysis and the degree of deamidation is much lower (about 20 to 30%) than that by HCl (Kumagai et al., 2007; Abe et al., 2014). Therefore, deamidation by cation-exchange resins would be effective for retaining T-cell epitopes because the reaction is moderate. Although the sequences of T-cell epitopes in wheat gliadin has yet to be determined, Gourbeyre et al. (2012) found that the addition of gliadin deamidated by HCl to T cells from UG-sensitized mice activated T cells and increased the production of IL-4. As for other food allergens, oral administration of T-cell epitopes of ovomucoid and ovalbumin in egg white induced the oral tolerance (Rupa and Mine, 2012; Yang et al., 2010). These findings encouraged us to examine that oral administration of gliadin deamidated by cation-exchange resins would reduce the allergic reaction and induce immune tolerance in wheat-allergy mice.
When an allergen is orally administered to allergen-sensitized human or mice, the allergic reaction occurs in the following manner. Allergic inflammation in the small intestine enhances intestinal permeability (Yamamoto et al., 2009; Brandt et al., 2003) leading to the considerable rise in the serum allergen level after its administration because of probable absorption of large molecules of antigen protein from the small intestine. The increase in allergen level results in a dominance of Th2 (McMenamin and Holt, 1993) that produces predominantly IL-4. IL-4 induces the production of allergen-specific IgE and IgG1 (Mosmann and Coffman, 1987; Rupa and Mine, 2012) and inhibits the production of Th1 cytokines like interferon-γ (IFN-γ) (Snapper et al., 1987). The cross-linking of allergens with IgE antibodies on the surface of mast cells triggers the release of bioactive chemical mediators such as histamine (Spreeuwel et al., 1984; Yamamto et al., 2009).
On the other hand, SIT desensitizes the intrinsic reactivity to allergens modulating T- and B-cell responses and related antibody isotypes and inhibiting the migration of eosinophils, basophils and mast cells as well as release of their mediators (Akdis and Akdis, 2015). SIT increases the ratio of Th1 cytokines to Th2 cytokines, inducing CD4+CD25+ Treg cells (Secrist et al., 1993; Ebner et al., 1997; Varney et al., 1993; Akdis et al., 1998). Treg cells often increase the production of interleukin-10 (IL-10) and transforming growth factor β (TGF-β) that contributes to T-cell differentiation and immunoglobulin class switching to IgA and IgG2a (Jutel et al., 2003; Rupa and Mine, 2012). In addition, CD4+ T cells are divided into Th1 and Th2 counter-regulating with one another (Snapper and Paul, 1987). This system of Th1/Th2 balance model provides valuable insight into understanding the basic mechanisms underlying allergic reaction. When Th2 cells are suppressed by IL-10 and TGF-β, Th1 cytokines such as IFN-γ and IL-12 are increased.
In this study, we determined the markers for allergy such as intestinal permeability, levels of serum histamine, IL-4, and IgE, as well as the markers for oral tolerance such as expression of CD4, CD25, and FoxP3 on T cells and levels of IL-10 and TGF-β. The intestinal permeability and levels of histamine, IL-4, and gliadin-specific IgE in serum of the DG group were significantly lower than those of the Control group. In contrast, these allergic-reactions and Th2-response makers did not differ between the Control and UG groups. These results indicate that repeated administration of deamidated gliadin suppressed allergic reaction in gliadin-allergic mice induced by UG challenge. DG-treated mice produced larger amount of TGF-β, gliadin-specific IgG2a, and Treg cells assessed by CD4, CD25, and FoxP3 expression, compared with control mice. However, no significant difference was observed in IL-10 production among the UG, DG, and Control groups. It might be because TGF-β and FoxP3 expression on Treg cells are the major contributors to allergy-suppressive effect elicited in the DG group. These results indicate that repeated oral administration of DG induced oral tolerance by producing Treg cells and suppressing Th2-immune responses (Figure 9).
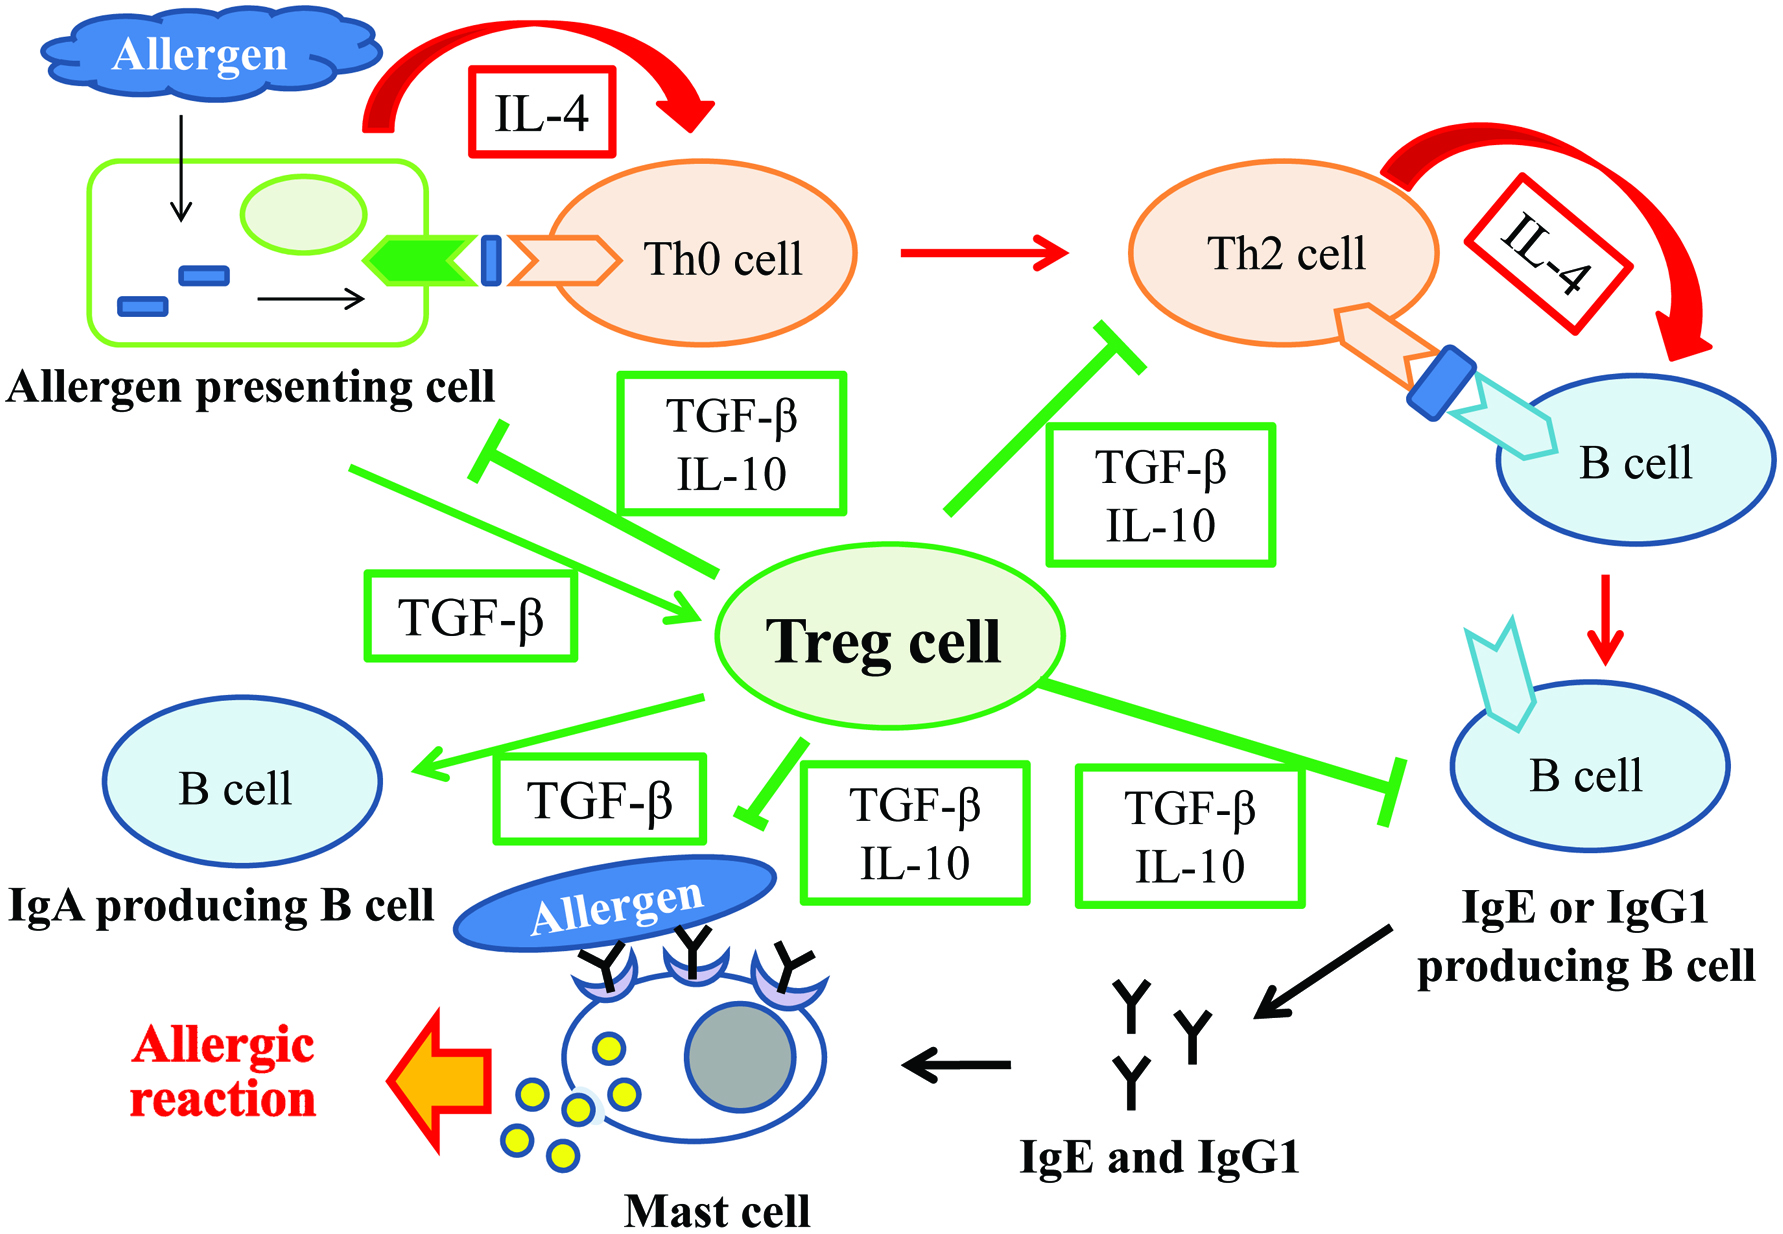 Click for large image | Figure 9. Schematic illustration of role of Treg cells. |
As mentioned above, the gliadin-induced secretion of TGF-β was significantly increased in the DG group, while no significant difference was observed in the IL-10 level among the DG, UG, and Control groups. The induction of oral tolerance and the changes in TGF-β and IL-10 levels are highly dose dependent. Oral administration of 2 or 20 mg peanut protein followed by its immunization (100 μg) did not induce tolerance, but that of 100 mg peanut protein successfully induced oral tolerance (Strid et al., 2004). Oral administration of 0.2 mg peanut protein did not change TGF-β level but slightly increased IL-10 level, while that of 100 mg peanut protein slightly increased TGF-β level but decreased IL-10 level. Similarly, oral administration of ovalbumin in a dose of over 20 mg induced systemic hyporesposiveness (Strid et al, 2004). Repeated oral administration of 1 mg ovalbumin and its single challenge enhanced histamine and IL-4 levels, but showed little change in TGF-β and IL-10 levels (Rupa and Mine, 2012). These reports clearly demonstrate that secretion of TGF-β and IL-10 was dominated by the amount of dose and types of allergens. In this report, oral administration of 20 mg DG induced systemic hyporesponsiveness increasing TGF-β secretion.
The solubility of sample proteins may affect the function to induce oral tolerance. Strid et al. (2004) reported that the oral administration of 100 mg peanut protein, which was water soluble, significantly suppressed allergic responses in peanut allergic mice. In our case, though oral administration of DG in dose of 20 mg suppressed allergic reaction inducing Treg cells in gliadin-allergic mice, oral administration of UG in dose of the same amount as DG did not suppress allergic reaction in the mice. The solubility of DG in water and salt solution at neutral and alkaline pH is much higher than that of UG (Kumagai et al, 2007). This means DG is more susceptible to digestion than UG. Therefore, the high solubility of DG in water might be one of the reasons for its function to induce oral tolerance.
The deamidated wheat gliadin with 23.6% degree of deamidation which we used in this study might be suitable for induction of oral tolerance without causing severe allergic reactions. Gliadin with much higher deamidation degree might not retain T-cell epitopes and no longer be recognized as wheat gliadin, while that with less deamidation degree might induce severe allergic reactions because B-cell epitopes could be retained. Although the degree of deamidation was not optimized in this study, wheat gliadin deamidated with cation-exchange resins resulted in induction of oral tolerance. Since cation-exchange resins have porous structure and most reaction sites locate inside a particle, the amide group in the side chain of large molecule is hardly deamidated by steric hindrance. Therefore, cation-exchange resins can provide moderately-deamidated proteins and can be a suitable means to reduce the allergenicity of allergens which have B-cell epitopes with glutamine and asparagine residues and to prepare a material that induces oral tolerance without causing severe allergic reaction.
| 5. Conclusion | ▴Top |
Repeated oral administration of DG induced oral tolerance in mice of wheat-gliadin allergy by increasing the number of Treg cells and secretion of TGF-β, which resulted in reduction in allergic reactions. Since we have already shown that the deamidated gliadin has low allergenicity in mice of wheat-gliadin allergy, the results of this study demonstrated that deamidated gliadin by cation-exchange resins can be used as a hypoallergenic-food material as well as a useful tool of SIT for patients with wheat allergy.
Conflict of interest
The authors declare no competing financial interest.
| References | ▴Top |