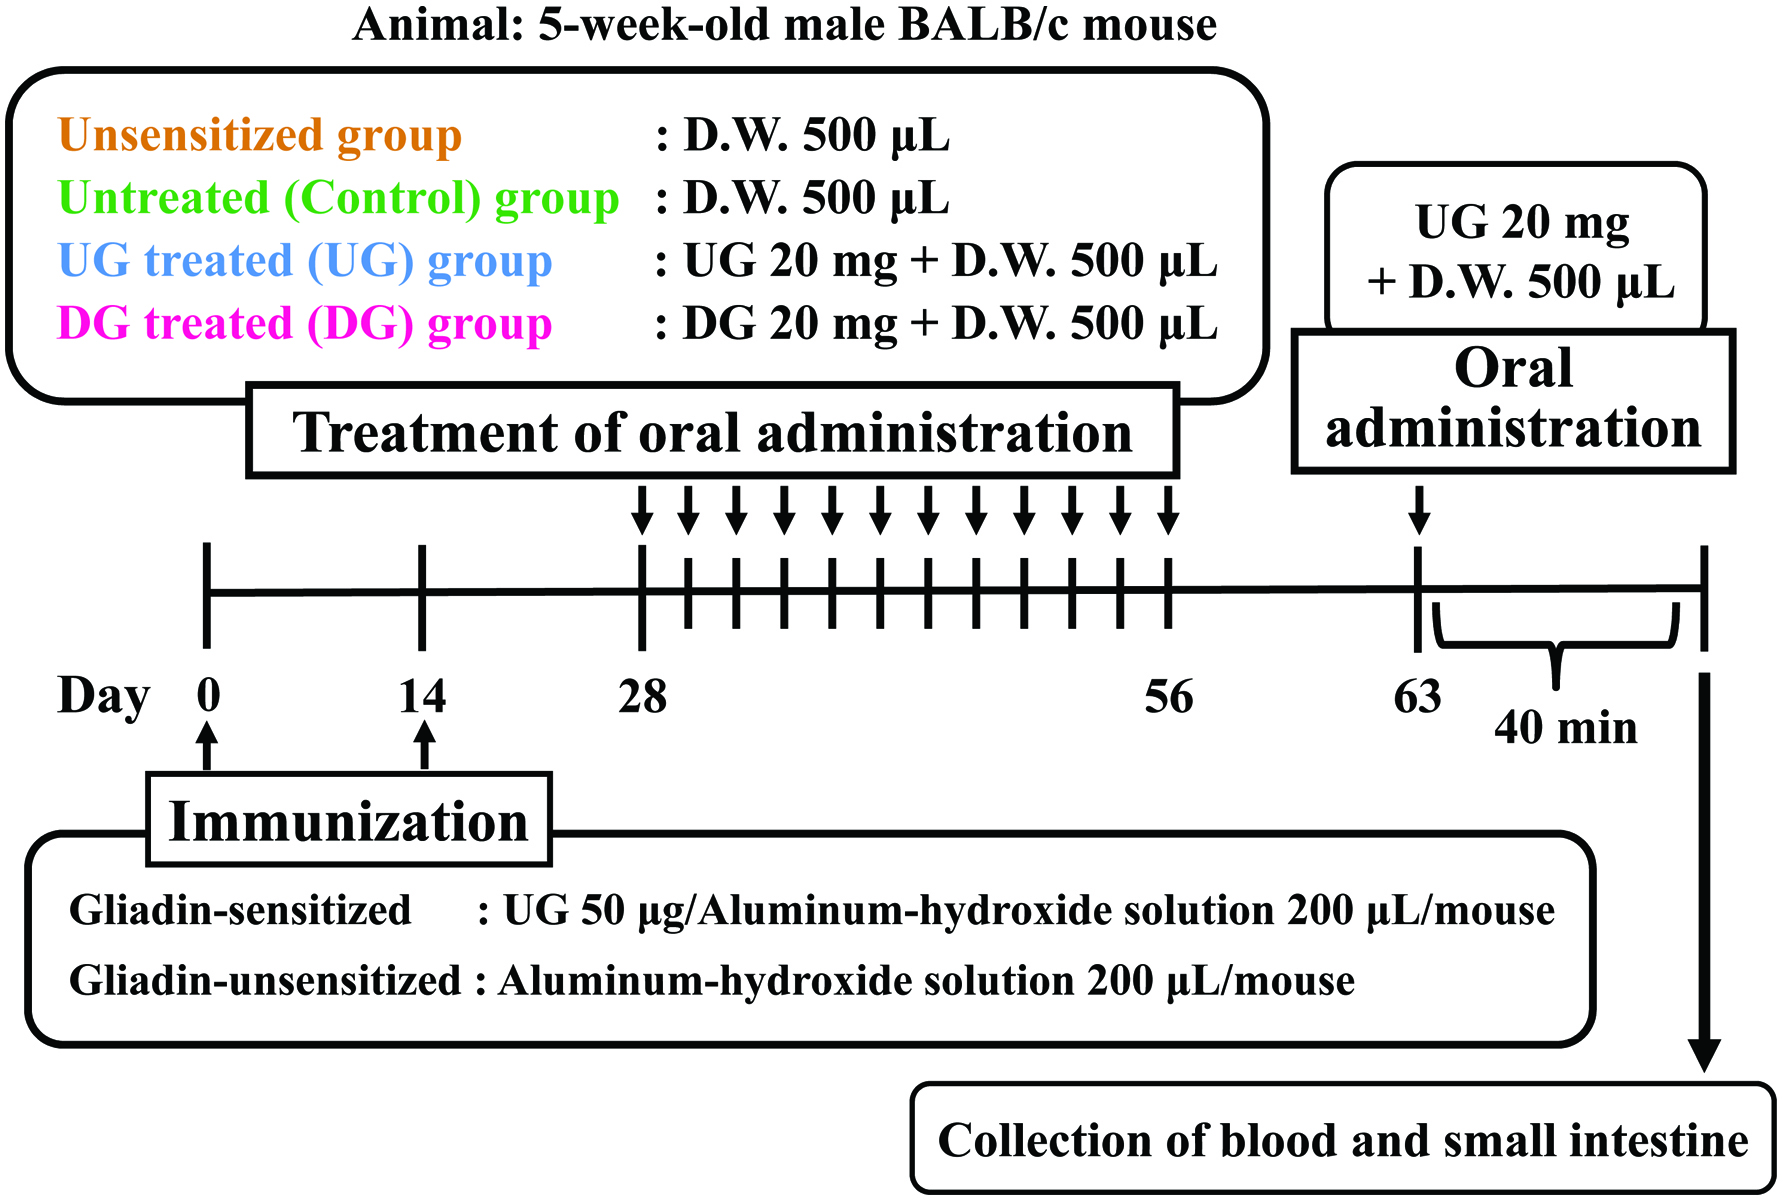
Figure 1.
Experimental design for evaluation of induction of oral tolerance by deamidated gliadin.
| Journal of Food Bioactives, ISSN 2637-8752 print, 2637-8779 online |
| Journal website www.isnff-jfb.com |
Original Research
Volume 2, Number , June 2018, pages 119-128
Wheat gliadin deamidated by cation-exchange resins induces oral tolerance in a mouse model of wheat allergy
Figures
Experimental design for evaluation of induction of oral tolerance by deamidated gliadin.
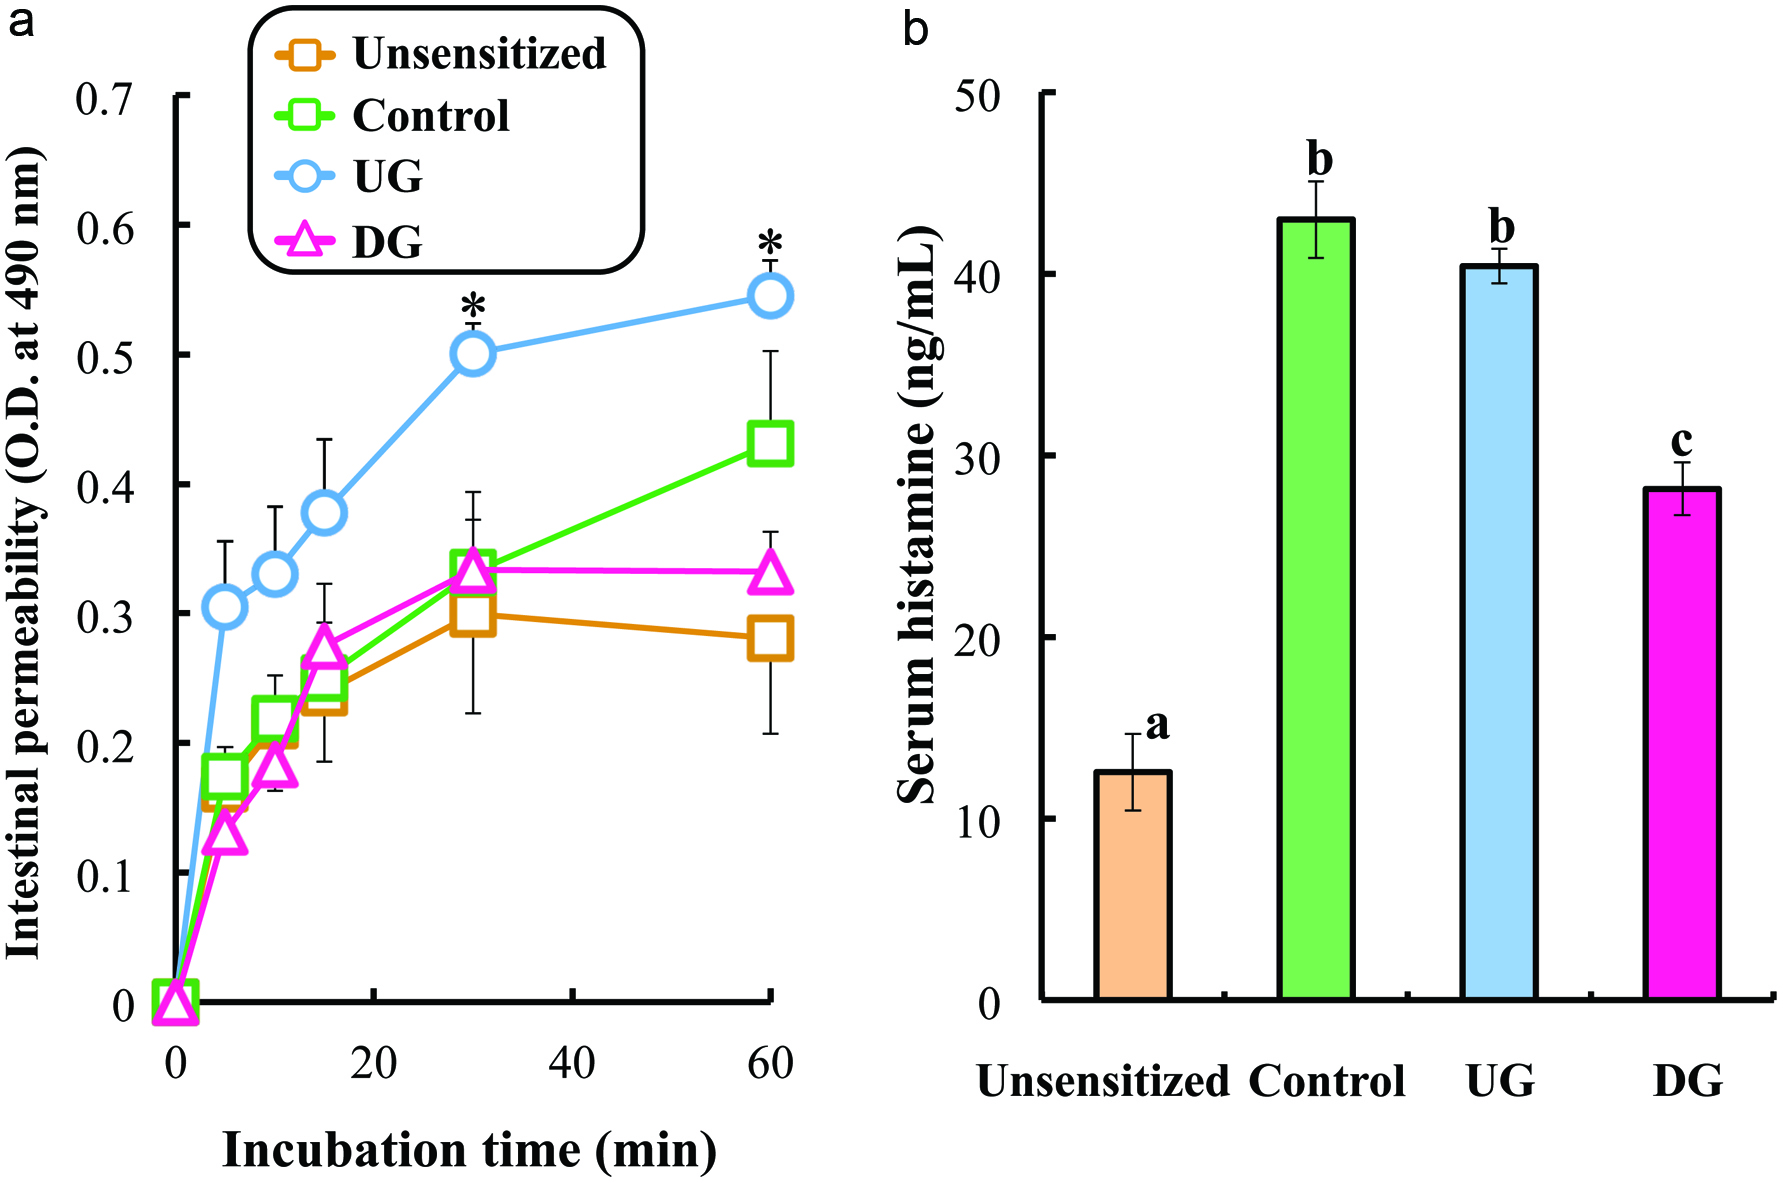
Intestinal permeability (a) and serum histamine level (b) of gliadin-sensitized mice after repeated sample administration and gliadin challenge.
Each value is the mean of 7 experiments ± S.E. Values with an asterisk in the left figure are significantly different from those of unsensitized mice at p < 0.05 by Tukey-Kramer test. Values with different letters in the right figure are significantly different at p < 0.01 by Tukey-Kramer test.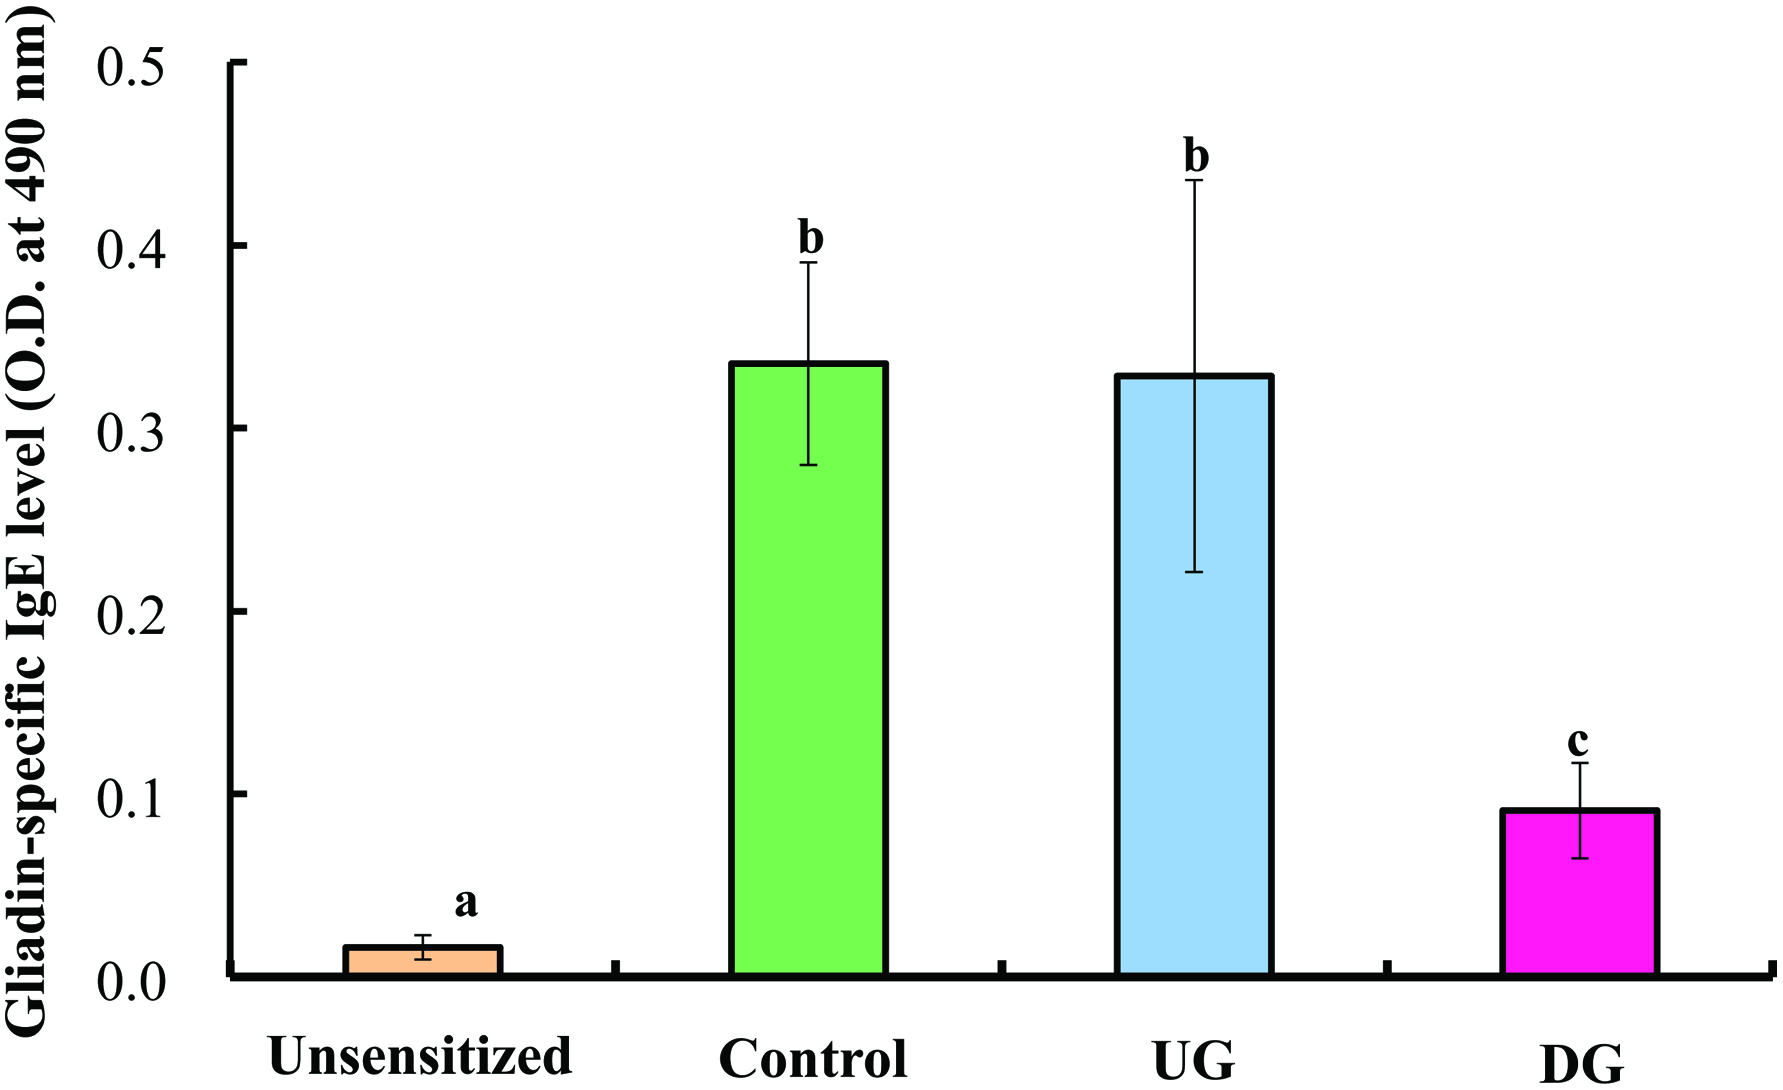
Serum gliadin-specific IgE level of gliadin-sensitized mice after repeated sample administration and gliadin challenge.
Each value is the mean of 7 experiments ± S.E. Values with different letters are significantly different at p < 0.01 by Tukey-Kramer test.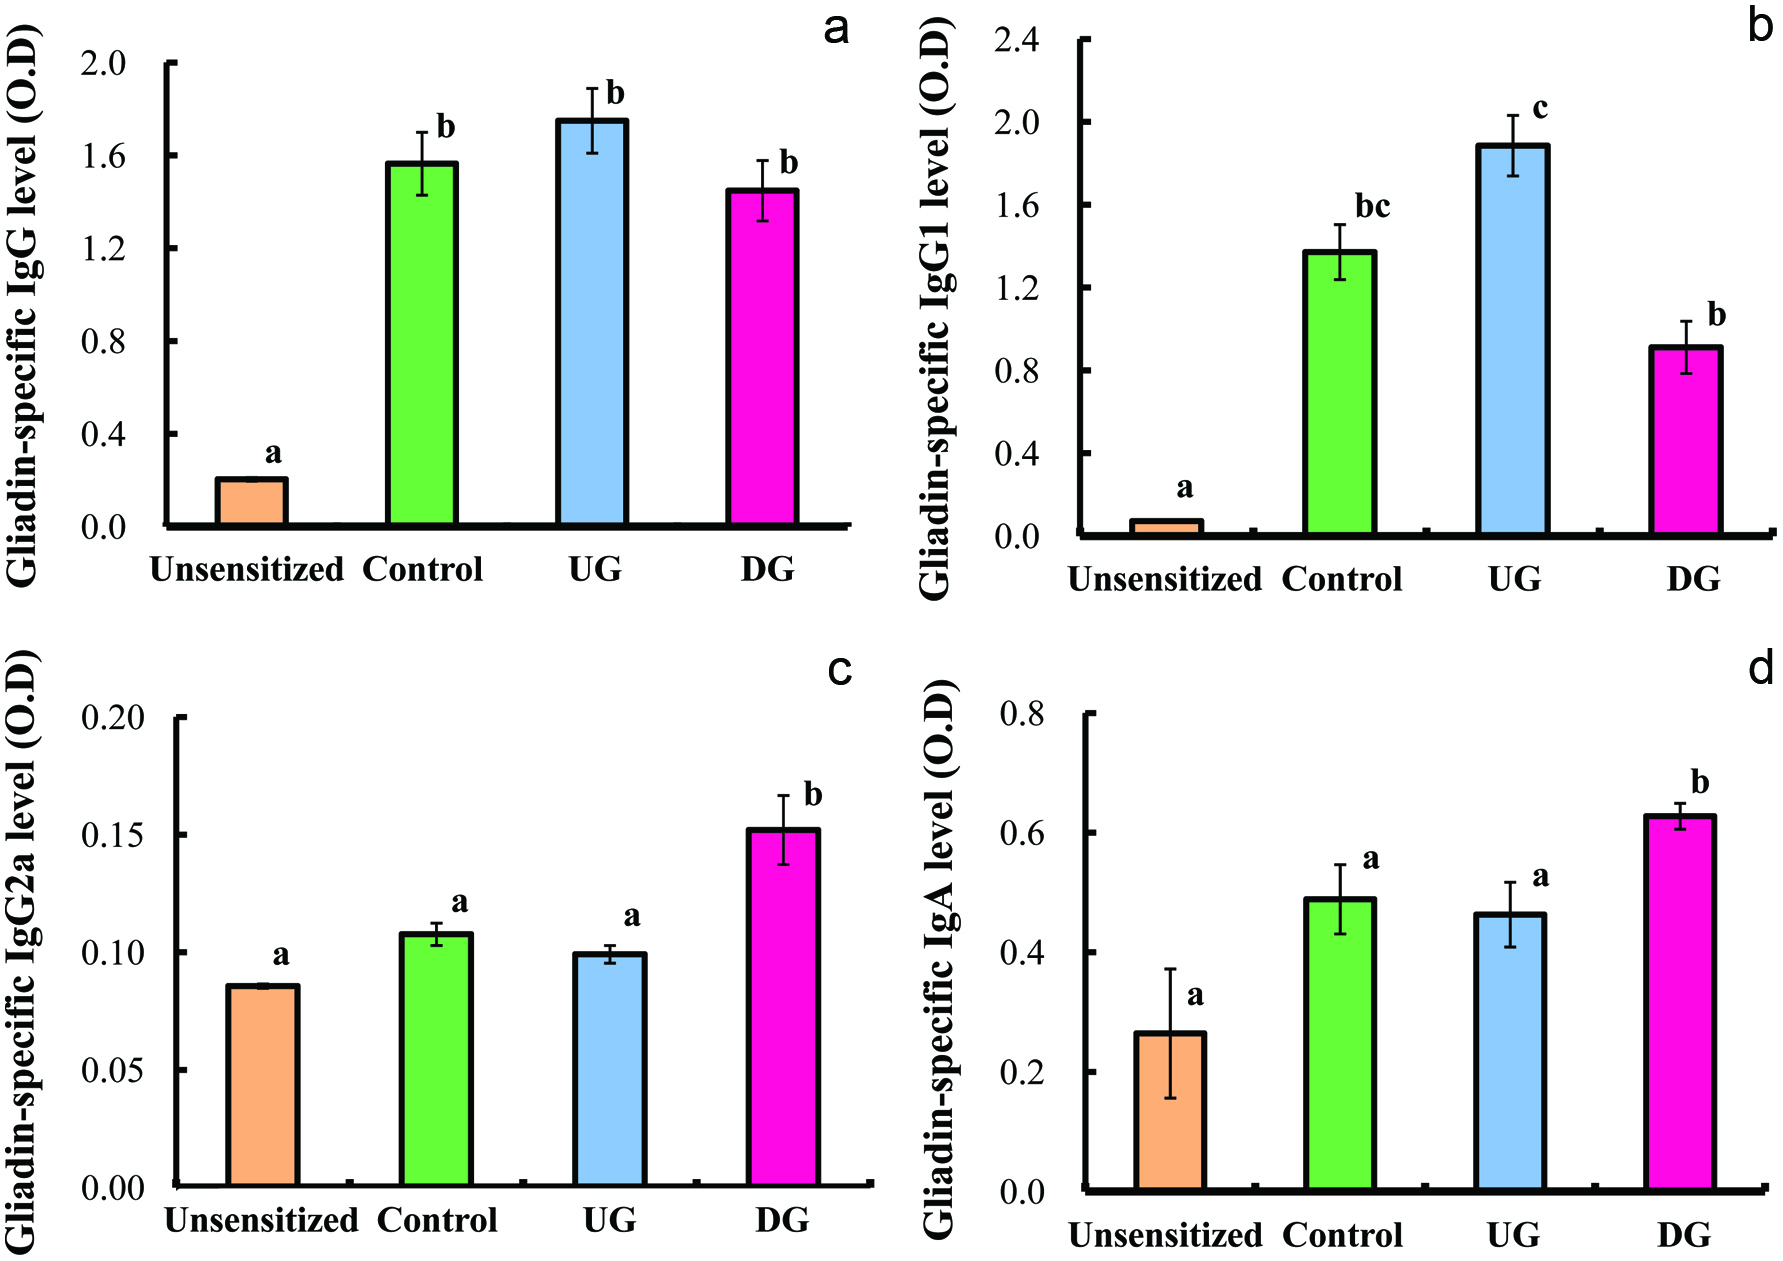
Serum gliadin-specific IgG (a), IgG1 (b), IgG2a (c) and IgA (d) levels of gliadin-sensitized mice after repeated sample administration and gliadin challenge.
Each value is the mean of 7 experiments ± S.E. Values with different letters are significantly different at p < 0.01 by Tukey-Kramer test.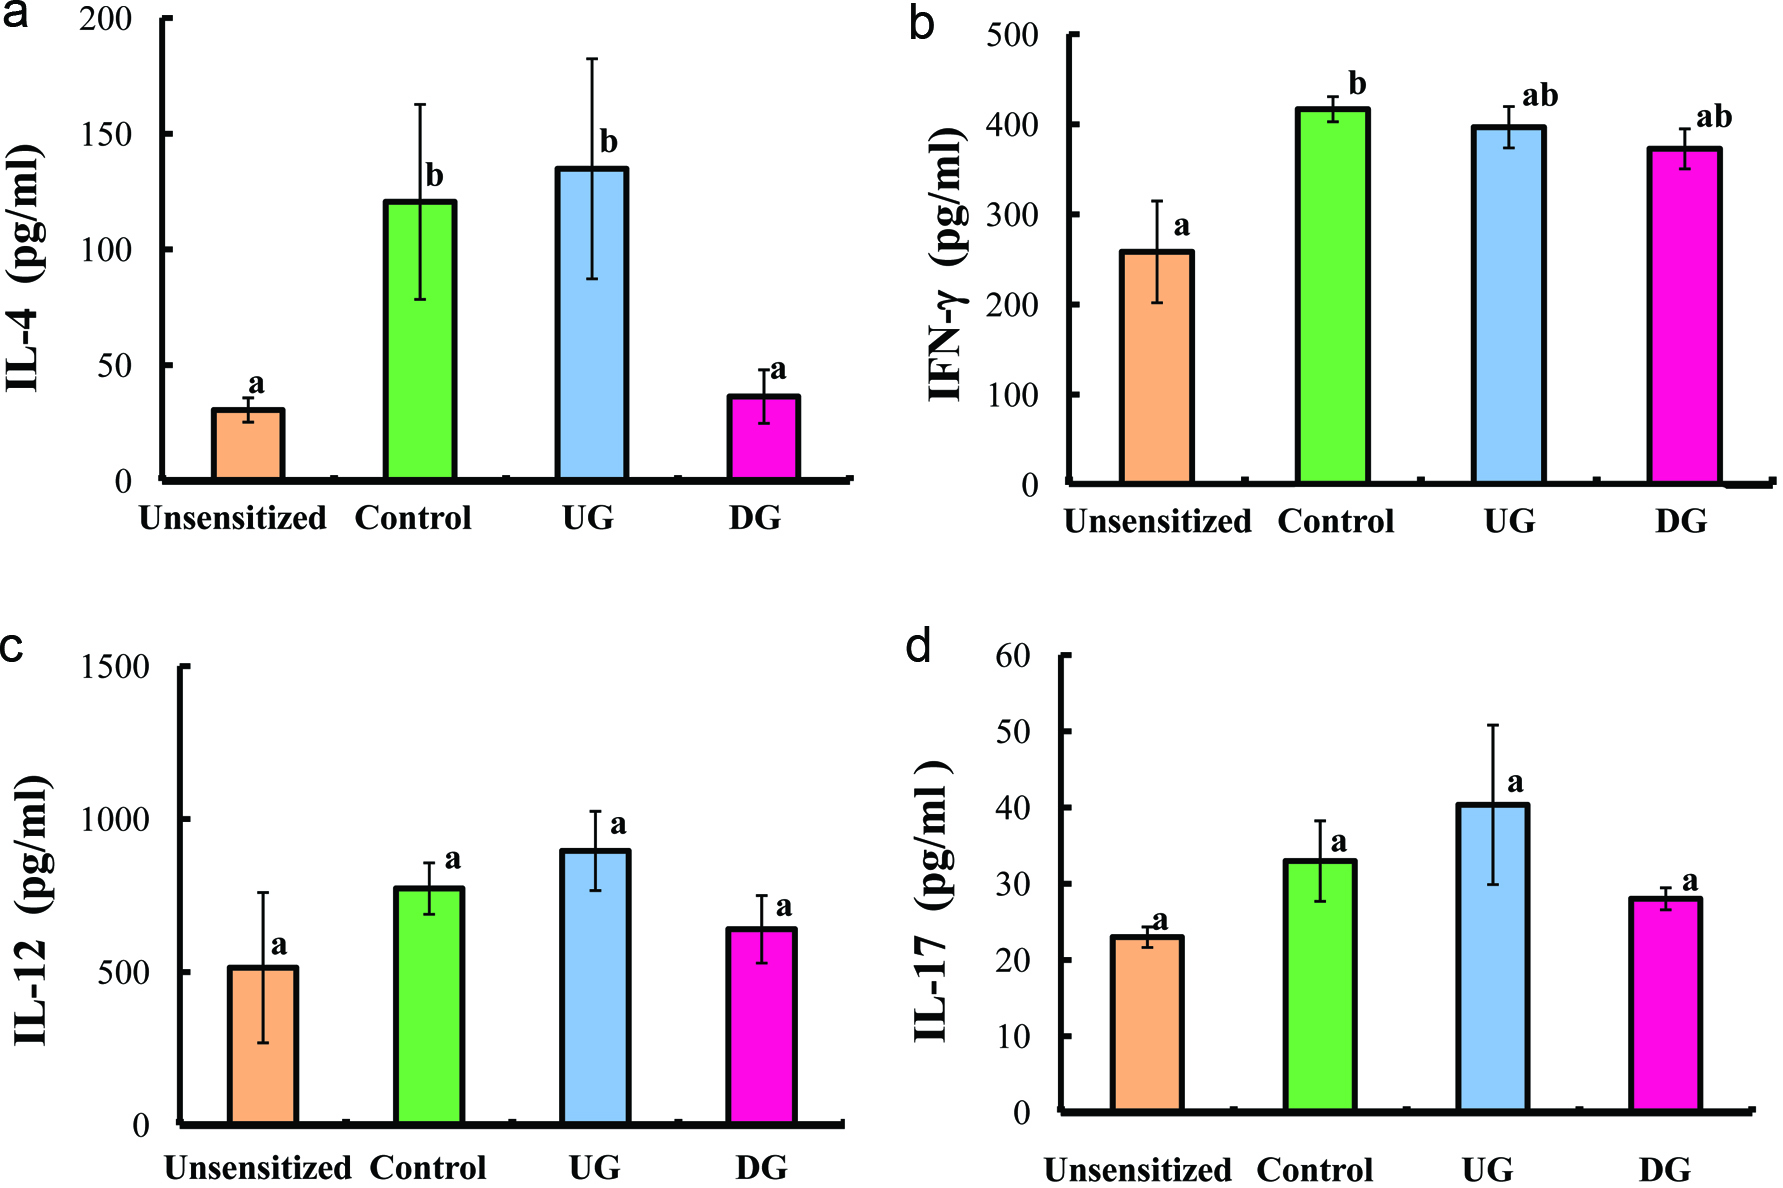
Serum IL-4 (a), IFN-γ (b), IL-12 (c), and IL-17 (d) levels of gliadin-sensitized mice after repeated sample administration and gliadin challenge.
Each value is the mean of 7 experiments ± S.E. Values with different letters are significantly different at p < 0.01 by Tukey-Kramer test.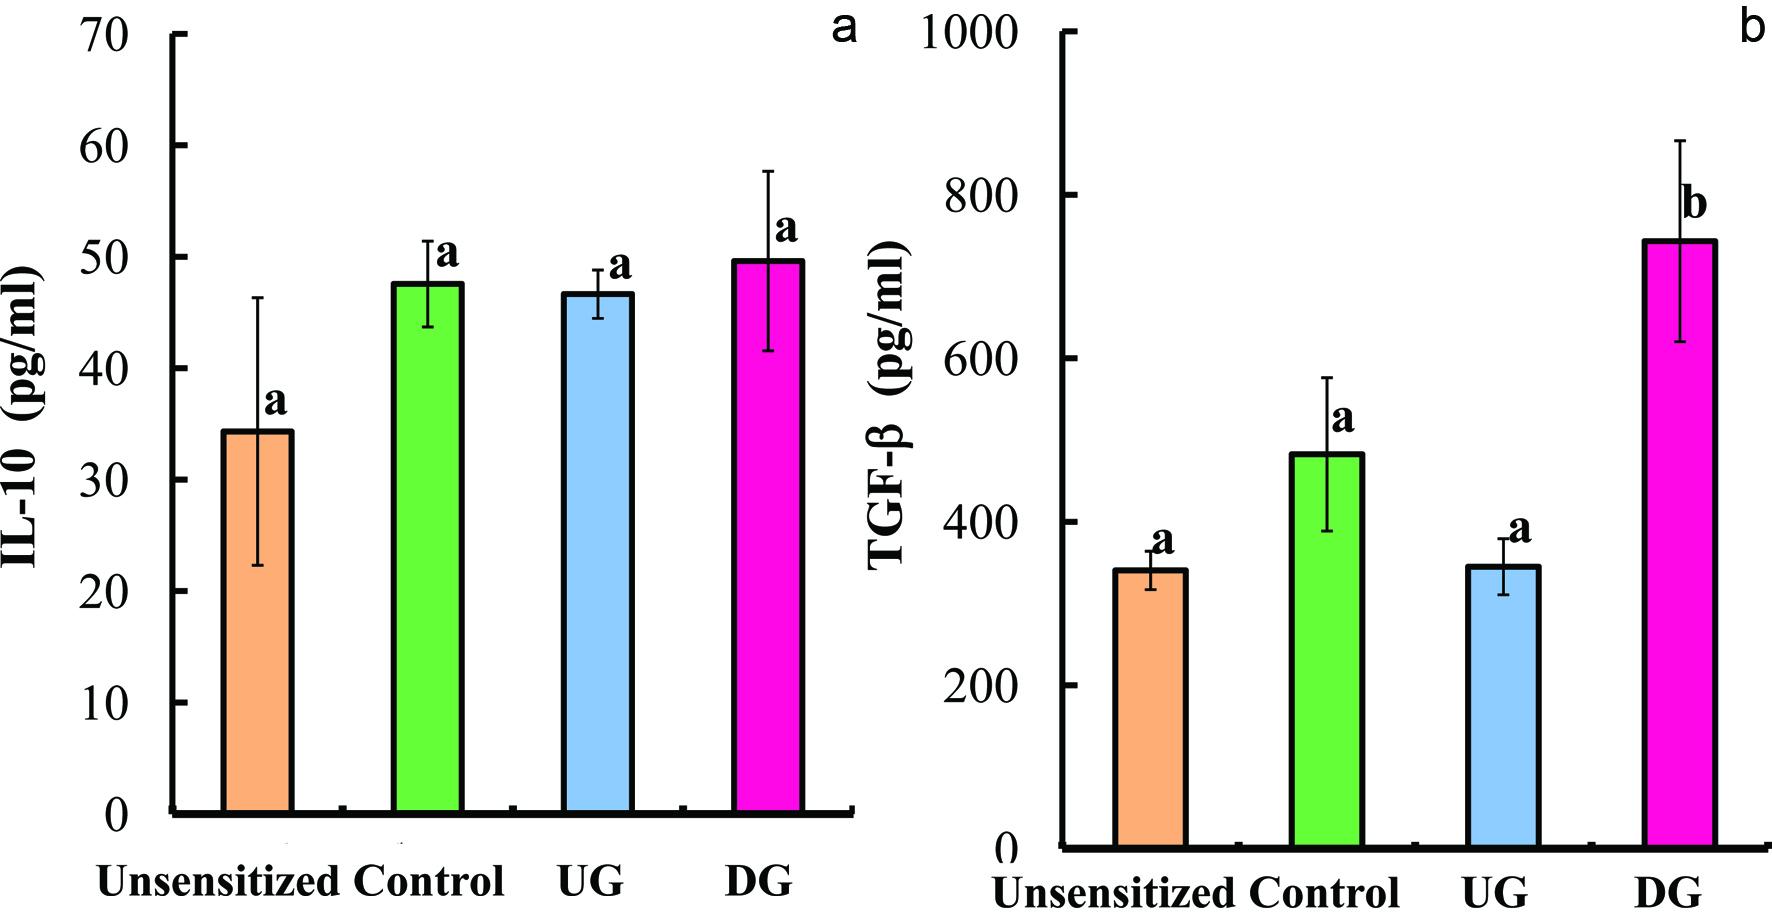
Serum IL-10 (a) and TGF-β (b) levels of gliadin-sensitized mice after repeated sample administration and gliadin challenge.
Each value is the mean of 7 experiments ± S.E. Values with different letters are significantly different at p < 0.01 by Tukey-Kramer test.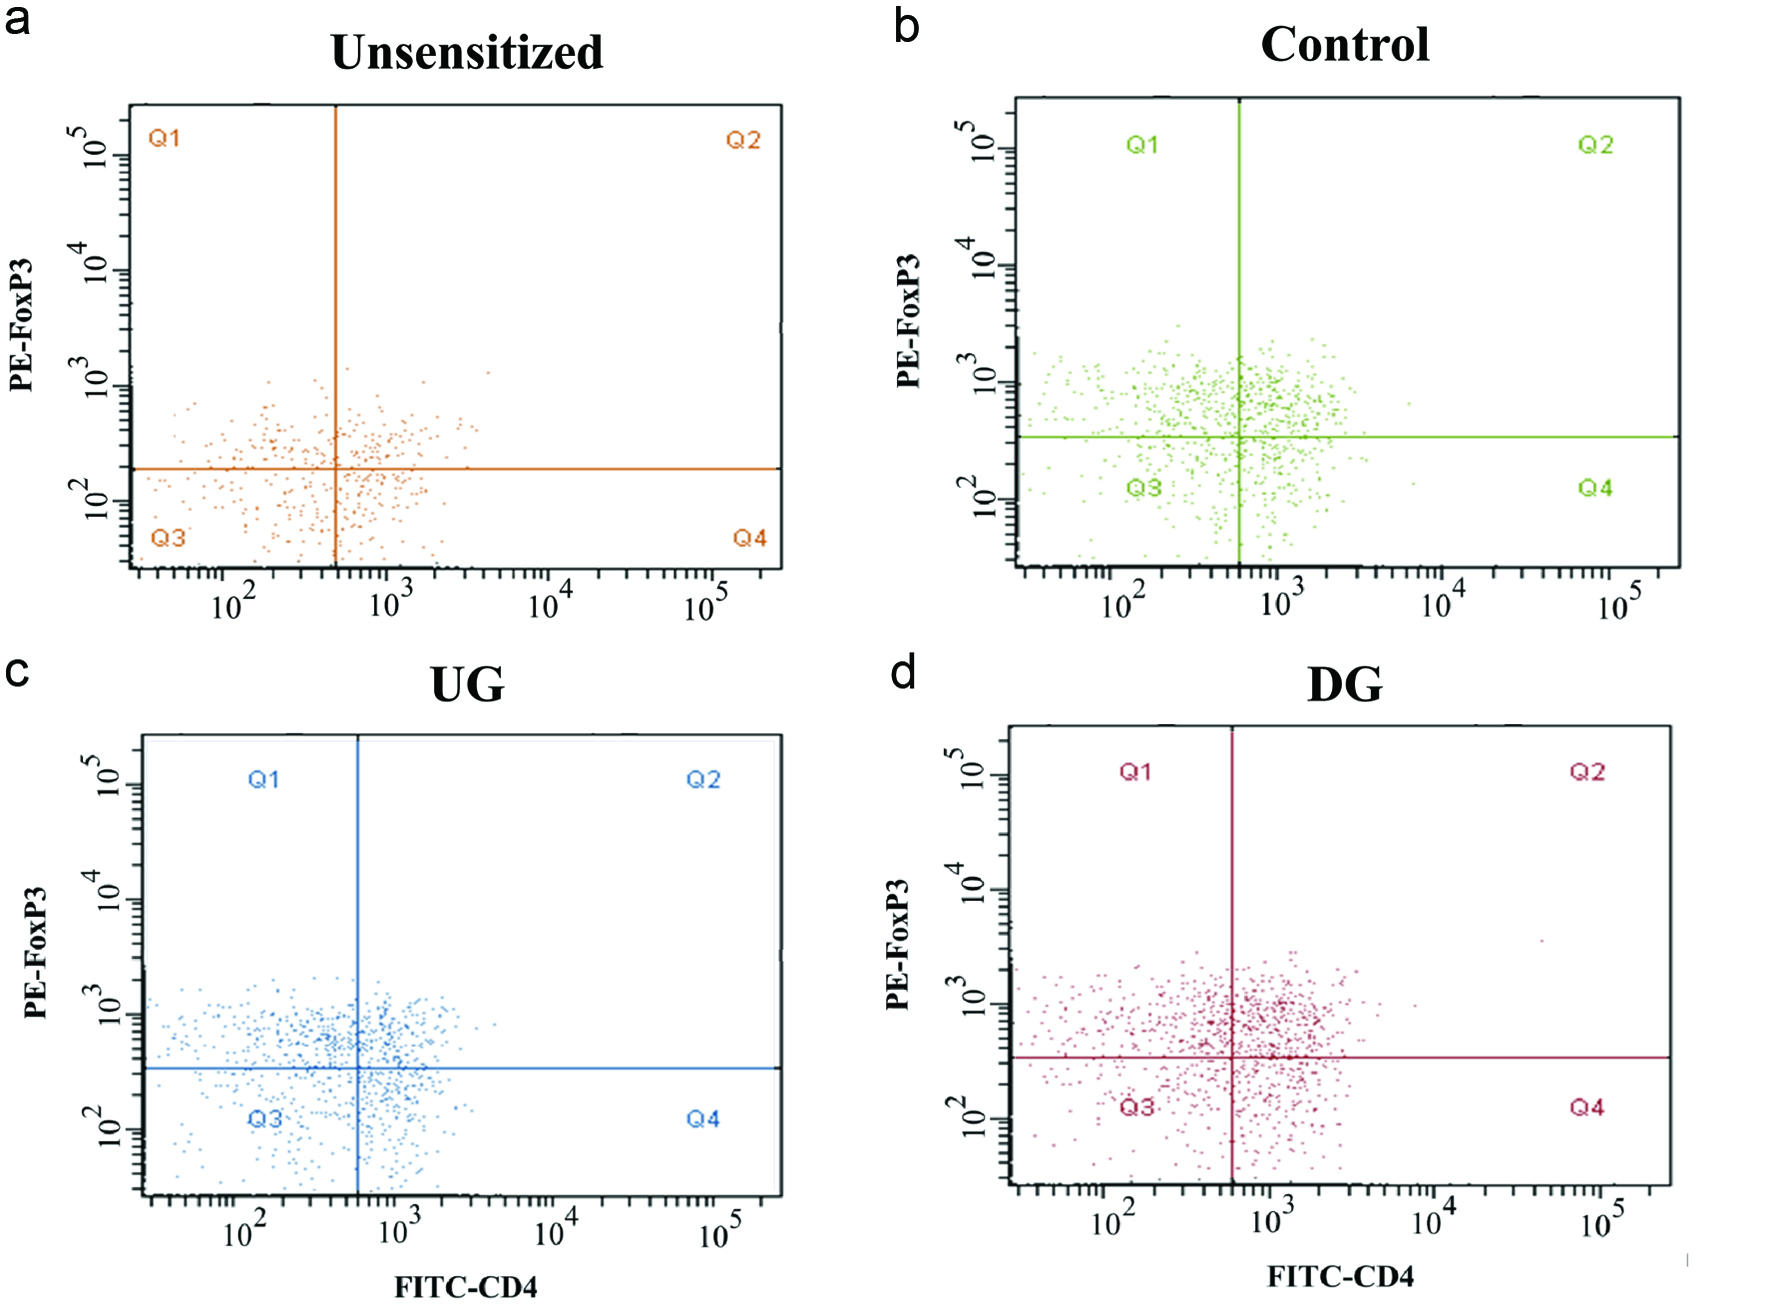
Flow cytometric dot plots of Treg (CD4+FoxP3+) cells of Unsesitized (a), Control (b), UG (c), and DG (d) groups.
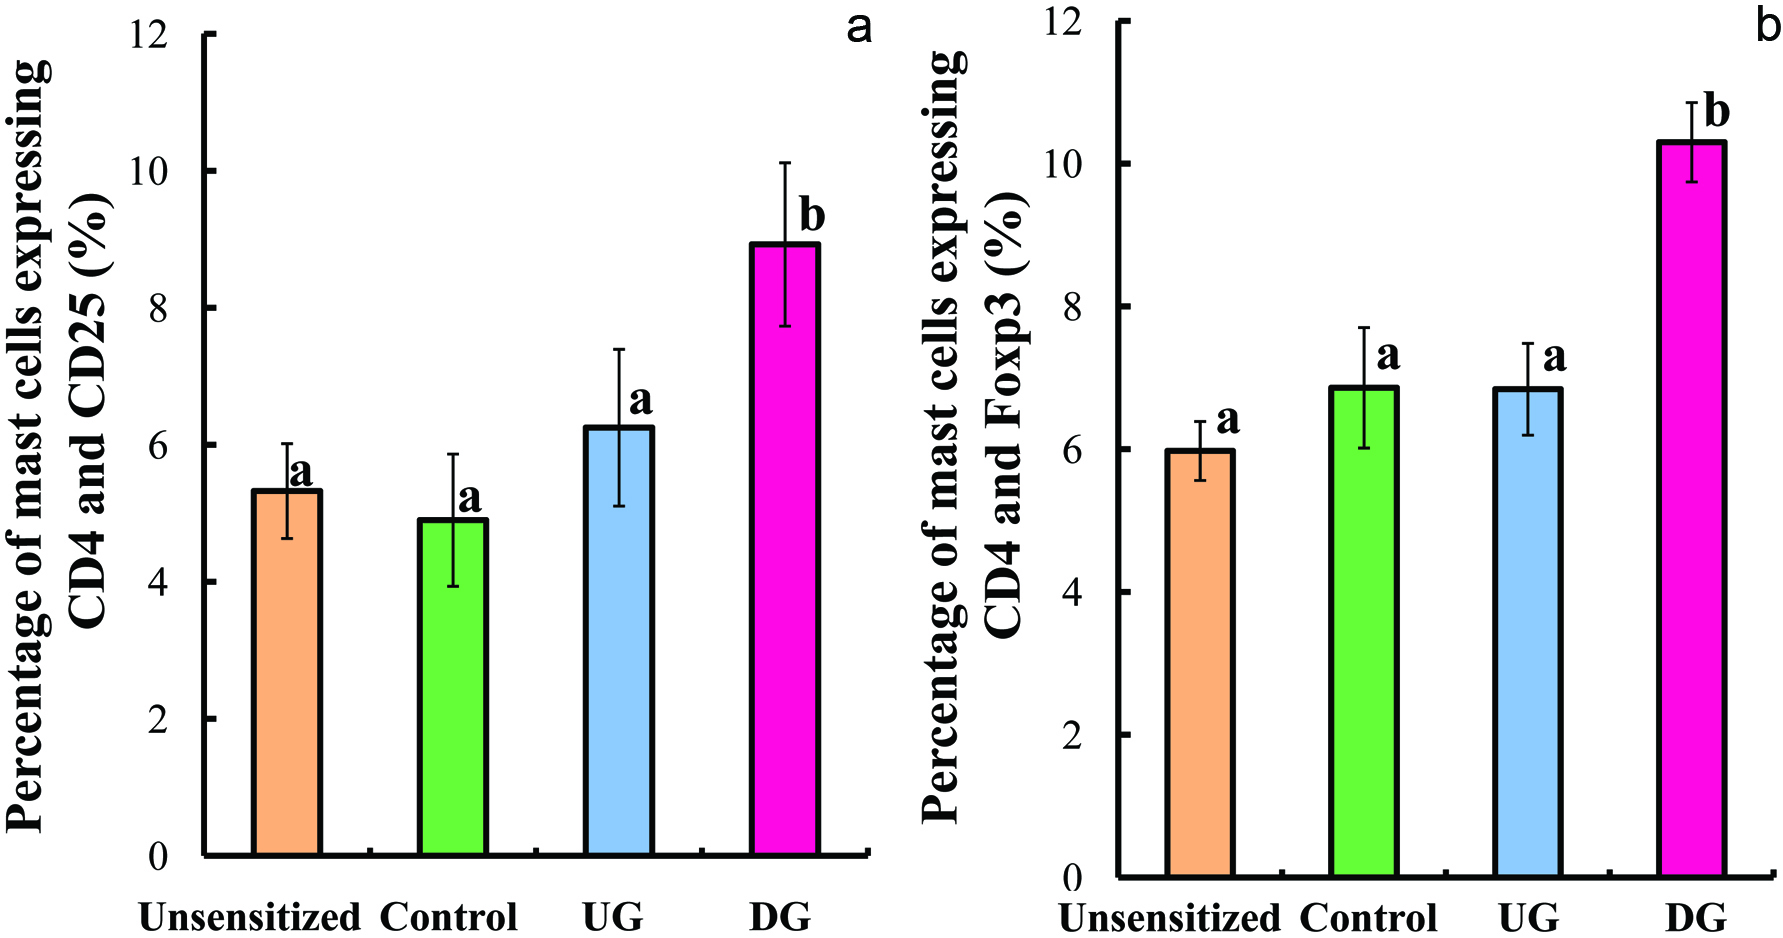
Percentage of lymphocyte cells expressing CD4+CD25+ (a) and CD4+FoxP3+ (b).
Each value is the mean of 7 experiments ± S.E. Values with different letters are significantly different at p < 0.01 by Tukey-Kramer test.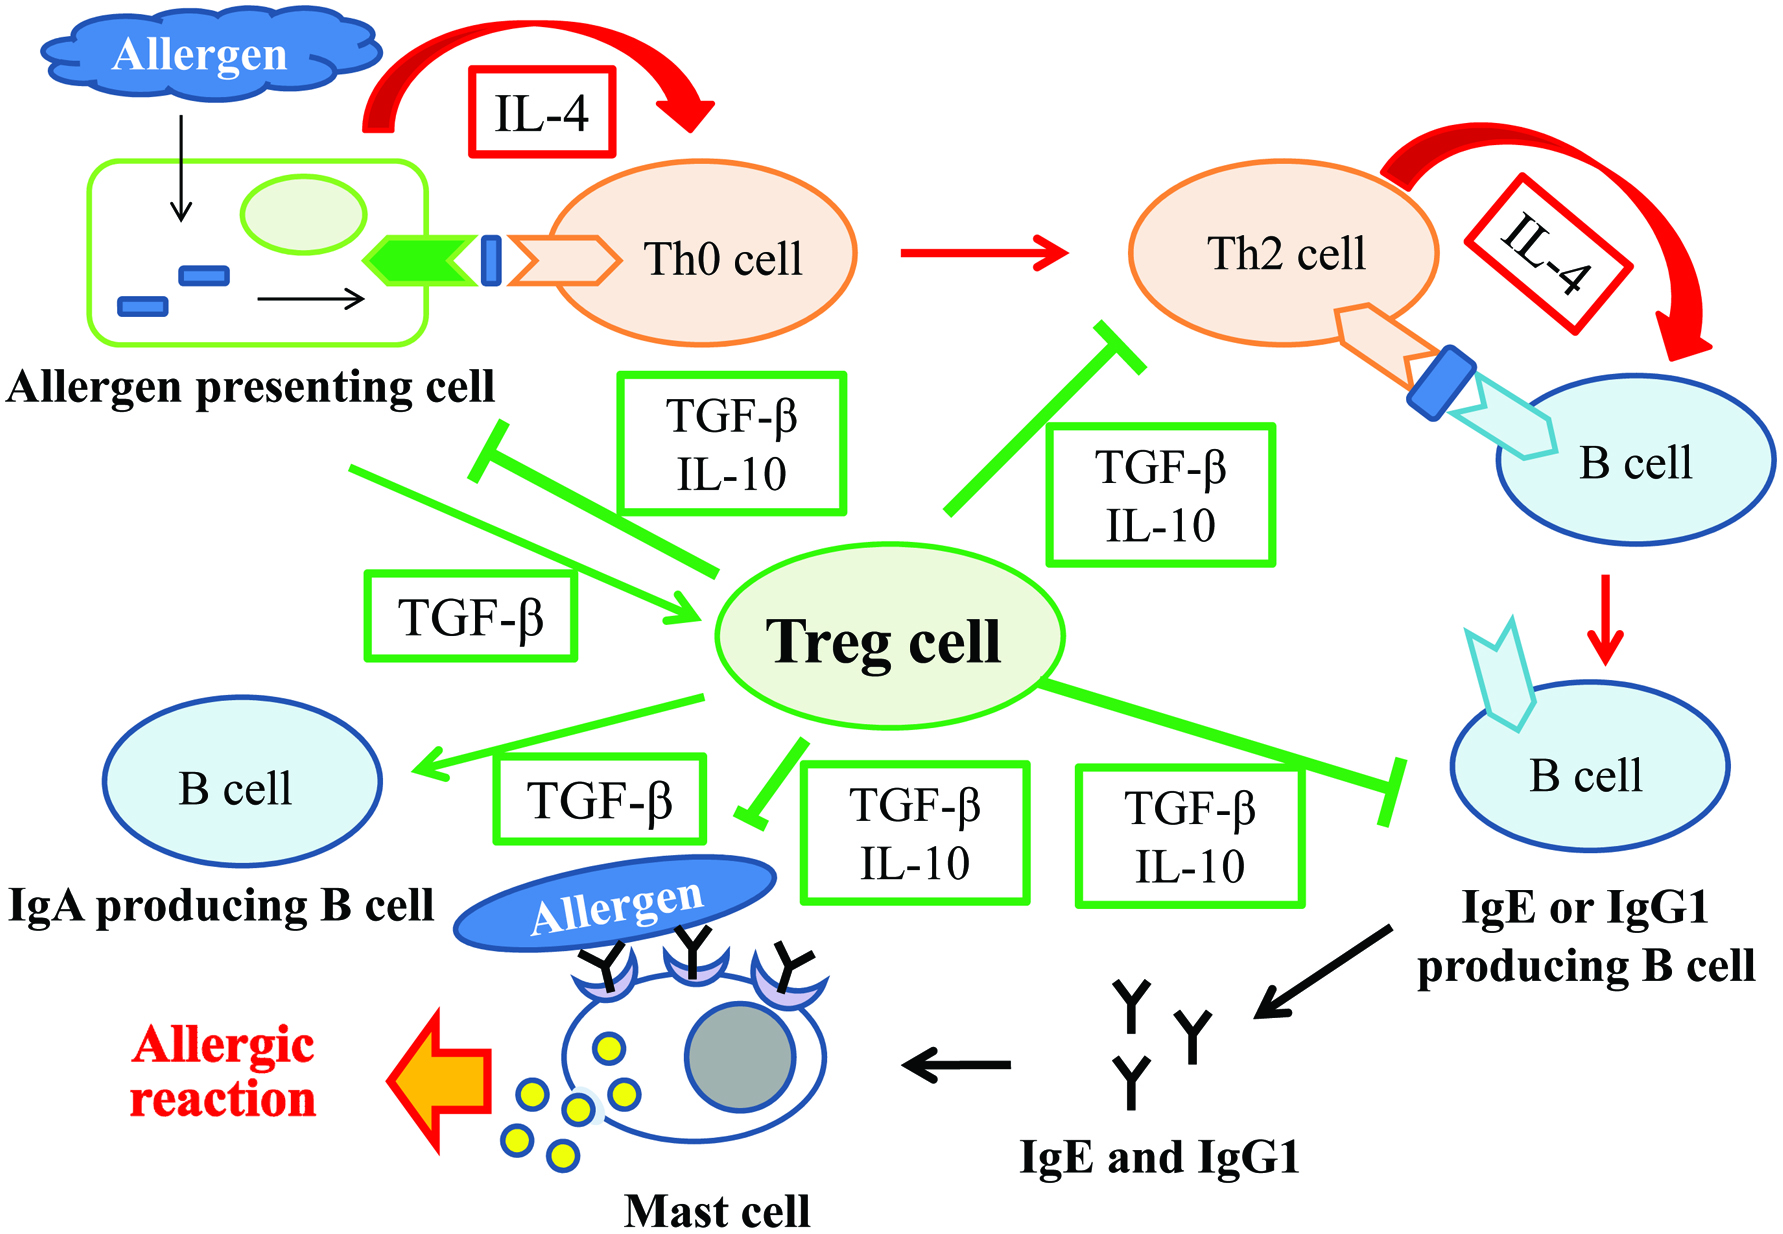
Schematic illustration of role of Treg cells.