| Journal of Food Bioactives, ISSN 2637-8752 print, 2637-8779 online |
| Journal website www.isnff-jfb.com |
Original Research
Volume 16, December 2021, pages 58-68
Egg yolk phosphatidylcholine is more effective than soybean phosphatidylcholine in improving dyslipidemia of obesity in mice fed a high-fat diet
Zhihui Yu#, Liyuan Zhou#, Ling Ma, Huiling Duan, Yingchun Zhu*
College of Food Science and Engineering, Shanxi Agricultural University, Taigu 030801, Shanxi, China
*Corresponding author: Yingchun Zhu, College of Food Science and Engineering, Shanxi Agricultural University, Taigu 030801, Shanxi, China. E-mail: yingchun0417@163.com
DOI: 10.31665/JFB.2021.16293
Received: December 6, 2021
Revised received & accepted: December 26, 2021
| Abstract | ▴Top |
This study aimed to evaluate the effects of dietary egg yolk phosphatidylcholine (EPC) and soybean phosphatidylcholine (SPC) on obesity mice fed a high-fat diet (HFD). After 60 days of dietary intervention, the effects were evaluated by biochemical indices and serum lipidomic analysis. EPC and SPC markedly reduced serum total cholesterol, serum triacylglycerol (TAG) and low-density lipoprotein cholesterol, while increased high-density lipoprotein cholesterol. EPC was more effective in reducing malondialdehyde and superoxide dismutase in liver than SPC. Main lipids including glycerophospholipids, TAG, sphingolipids and fatty acyls were significantly modified by EPC. Compared with HFD, EPC increased 10 main differential lipids such as phosphatidyl ethanolamine (22:6_20:0). The expressions of related protein including sterol-regulatory element binding proteins sterol-regulatory element binding proteins (SREBP-1c) and peroxisome proliferator-activated receptor α (PPAR-α) were significantly down-regulated with EPC treatment. Therefore, EPC was more effective than SPC in improving obesity by regulating glycerophospholipid metabolism.
Keywords: Egg yolk phosphatidylcholine; Soybean phosphatidylcholine; Obesity; UPLC-MS/MS; Lipidomics
| 1. Introduction | ▴Top |
Obesity is a risk factor for cardiovascular and metabolic diseases (Tatsumi et al., 2017). It has been reported that hypertension, diabetes, and type 2 diabetes are closely related to the obesity (Queiroz et al., 2021). With the improvement of living conditions, obesity prevalence has been rising rapidly all over the world. According to the latest released statistics, overweight and obesity have become one of the prominent nutritional problems of Chinese people. The proportion of overweight and obese adults (≥18 years old) has reached around 30 and 12% in 2019, respectively (Xu et al., 2019).
A high-fat diet (HFD) is one of the major reasons for obesity, thus the modification of dietary lipids seems to play a critical role in obesity prevention. Recently, an increasing number of studies on food-derived functional matter for preventing obesity were reported. For instance, studies have shown that taurine could improve hepatic lipid accumulation by improving the expression of carbohydrate response element binding protein (ChREBP), microsomal triacylglycerol transfer protein (MTP) and carnitine palmitoyl transferase 1a (CPT-1a), together with increasing the expression of peroxisome proliferator-activated receptor α (PPAR-α) gene (Bonfleur et al., 2015). In addition, apigenin has been reported to improve dyslipidemia, liver steatosis and insulin resistance in C57BL/6J obese mice induced by HFD (Jung et al., 2016). It has been reported that dietary phosphatidylcholine (PC) could improve the accumulation lipids in serum and liver in obese mice (Erami et al., 2016). Dietary PC is mainly derived from egg yolk and soybeans (Lim et al., 2020). It has shown that egg yolk phosphatidylcholine (EPC)-enriched diet could significantly improve endothelial vasodilatory in subjects with obesity (Skorkowska-Telichowska et al., 2016). In addition, cell experiments have shown that EPC inhibited cholesterol absorption and transport by perturbing physico-chemical properties of micelles in Caco-2 Cells (Yang et al., 2018). Soybean phosphatidylcholine (SPC) have been shown to significantly promote fat degradation by inhibiting cholesterol absorption (Huang et al., 2008). Meanwhile, studies have demonstrated that dietary SPC could alleviate obesity and related complications induced by high fat diet in mice (Lee et al., 2014). In addition, previous studies have revealed that EPC with more saturated fatty acid (FA) component led to a stronger effect on cholesterol absorption than SPC (Blesso, 2015). Similar results have also been reported in other studies (Jiang et al., 2001). Thus, it suggested that EPC seems to be more effective in improvement of obesity than SPC. However, there are few comparative studies on the effects of EPC and SPC on obesity. The regulatory effects and mechanisms of these two animal and plant-derived PC on obesity are still unclear.
Lipidomics is a powerful approach to analyze the lipid profile in a quantitative manner (Murfitt et al., 2018). It has been universally used in the detection of lipid components and nutrition in food studies (Morisasa et al., 2019). In recent years, it is also a high-resolution tool for identifying biomarkers, diagnosing and finding therapeutic strategies for metabolic diseases (Zhang et al., 2013). The ultraperformance liquid chromatography-mass spectrometry (UPLC-MS/MS)-based lipidomic approach is the most frequently used for lipid profiling analyses (Hu et al., 2020). A study has revealed the improvement of berberine in non-alcoholic fatty liver disease by studying changes in lipid profiles using liquid chromatography-mass spectrometry (LC-MS/MS) technology (Chang et al., 2016). Another study has reported that stigmasterol could lower cholesterol ester (CE), and ceramides (CM) in liver (Feng et al., 2018). Thus, these discoveries indicate that lipidomics could serve as an effective means of explore the regulation mechanism of EPC and SPC for obesity.
This study compared the effects of EPC and SPC on obese mice induced by HFD. We hypothesize that EPC may be more effective than SPC in improvement of lipid metabolism disorders. The effects of EPC and SPC on main biochemical indices, lipid oxidation, and histopathology were evaluated. Besides, a lipidomic analysis was used to identify the serum lipid biomarkers induced by EPC and SPC treatment. The involved regulating mechanism of EPC and SPC was also explored.
| 2. Methods and materials | ▴Top |
2.1. Materials
EPC (purity 97%), and SPC (purity 98%) were bought from Sibeifu Biotechnology Co., Ltd (Beijing, China). Saline was purchased from Shijiazhuang Four Medicine Co., Ltd (Hebei, China).
2.2. Animals and diets
Forty male C57BL/6J mice (weighing 23–28 g, 8 weeks old) were purchased from Sibeifu (Beijing) Biotechnology Co., Ltd. The approval No. was NO.110324200102532878 and the Animal License No. was SCXK (Beijing) 2019-0010). All experimental procedures were approved by the Institutional Animal Care and Use Committee (IACUC) of Shanxi Agricultural University.
The mice were housed in cages (4 mice/cage), bred under constant room temperature (22 ± 1 °C) and 12 h light/dark cycle condition, and with free access to food and water.
After one week of adaptive feeding, mice were randomly distributed into four groups (n = 10): control group (normal diet, ND, 10% kCal from fat, D12450J, Research Diets, Inc., New Brunswick, NJ), high-fat diet group (HFD, 60% kCal from fat, D12492, Research Diets), EPC group (fed a HFD and gavage dose of 10 mg/g mice), SPC group (fed a HFD and gavage dose of 10 mg/g mice). The ND and HFD groups were given an equal volume of saline as contrast. The experiment lasted for 60 days. The weight and food intake of the mice were measured every 3 days. After 60 days of feeding, all mice were starved for 24 hours while drinking water libitum. Before collecting blood from eyeballs, the mice were sacrificed by cervical dislocation. Epididymal fat, kidney, heart, spleen and liver tissue were then quickly weighed and flash-frozen in liquid nitrogen, and then stored at −80 °C. The fatty acid composition of EPC and SPC, and the composition of ND and HFD are shown in Tables s1 and 2.
2.3. Biochemical analysis
The serum was separated after centrifugation at 3,500 × g for 15 min at 4 °C, and then transferred to a new centrifuge tube for further analysis. Liver tissue was homogenized with 9 times the volume of saline, and then the mixture was centrifuged at 3,500 × g for 15 min at 4 °C. The serum was obtained by collecting supernatant, and stored at −80 °C for spare use.
Serum triacylglycerol (TAG), total cholesterol (TC), high-density lipoprotein cholesterol (HDL-C), and low-density lipoprotein cholesterol (LDL-C), liver TAG and TC were measured using the reagent kit (Nanjing Jiancheng Bioengineering Institute, Jiangsu, China). Aspartate transaminase (AST) and alamine aminotransferase (ALT) in serum, malondialdehyde (MDA) and superoxide dismutase (SOD) in liver were measured colorimetric using enzymatic reagent kit (Nanjing Jiancheng Bioengineering Institute). The absorbance of MDA and SOD was measured at 530 and 450 nm wavelengths at room temperature. The activities of MDA and SOD are expressed as nmol/mgprot and U/mL.
2.4. Histopathology
Liver and epididymal adipose tissue were dissected and fixed in 10% buffered formalin for 24 h after washing in saline. Subsequently, the samples were dehydrated through a concentration gradient ethanol and permeability, wax-dipped and embedded. Following sectioning at 5 μm thickness, hematoxylin-eosin (H&E) stain was conducted and then monitored under an optical microscope.
2.5. Lipidomic analysis
2.5.1. Lipid extraction
The serum samples were thawed from the freezer (−80 °C) before analysis. After thawing, the samples were vortex-mixed for 10 s and centrifuged at 2,100 × g for 5 min. 1 mL solvent mixture (Chloroform/methanol 3:1, v/v) was added to 50 µL supernatant to precipitated protein. After centrifuging at 8,400 × g for 10 min at 4 °C, the supernatant (500 µL) was collected and analyzed for UPLC-MS/MS analysis.
2.5.2. UPLC-MS/MS analysis
UPLC-MS/MS analysis was performed on Thermo AccucoreTM C30 analytical column (i.d. 2.6 µm, 2.1 mm x 100 mm, Thermo Fisher Scientific) coupled to tandem mass spectrometry (MS/MS) (Applied Biosystems 4500 QTRAP, https://sciex.com.cn/). The column temperature was 45 °C and the injection volume was 2 µL. Mobile phase A consisted of acetonitrile solution (60%, v/v, 0.1% formic acid, 10 mmol/L ammonium formate), and B (10% acetonitrile dissolved in isopropanol v/v, 0.1% formic acid, 10 mmol/L ammonium formate) with linear gradient elution: 0–4 min, 20–60% B; 4–15.5 min, 60–95% B; 15.5–17.3 min, 95% B; 17.3–20 min, 20% B was used. Mass spectrometry was performed using an Agilent 6460 triple quadrupole/mass spectrometry (QQQ/MS) system equipped with an electrospray ionization (ESI) source in both positive (ES+) and negative (ES-) ion modes. The capillary voltage was set at 5.5 kV and −4.5 kV in ES+ and ES-, respectively. The ion source gas 1 (GS1), gas 2 (GS2), curtain gas (CUR) were 45, 55, and 35 psi, respectively. The collision gas (CAD) was medium. The source temperature was set at 500 °C. QQQ scans were acquired as MRM experiments with collision gas (nitrogen) set to 5 psi.
2.5.3. Multivariate analysis and potential biomarkers identification
The raw data were normalized using Tracefinder software (version 3.2, Thermo Fisher Scientific). The ion intensities for each peak were then detected and normalized.
On the basis of the self-built database (MetWare database, MWDB) of Wuhan MetWare Biotechnology Co., Ltd, qualitative analysis was carried out according to the retention time, ion-pair information, and secondary spectrum information. The quantitative analysis was completed by multiple reaction monitoring (MRM) in triple quadrupole mass spectrometry. Peak quantification was performed with Multiquant software. Principal components analysis (PCA) and orthogonal partial least squares-discriminant analysis (OPLS-DA) were established to represent the major latent variables in the datamatrix using the SIMCA-P software package (V.13.5, Umetrics; Umea, Sweden). The differential lipids were determined by the value of variable importance in projection (VIP) ≥ 1, fold change (FC) ≥ 2 or ≤0.5, and p value of t-test < 0.05. S-plots and VIP-plots were extracted from OPLS-DA results to select potential biomarkers discriminating different groups. In order to avoid overfitting, a permutation test involved 200 permutations was performed. Identified lipid metabolites were annotated and then matched to Kyoto Encyclopedia of Genes and Genomes (KEGG) Pathway database (http://www.kegg.jp/kegg/pathway.html) to find involved pathways.
2.6. Western blots
After washing the liver tissue with pre-cooled phosphate buffer saline (PBS), total proteins in the liver tissues were extracted by radio-immunoprecipitation assay (RIPA) lysate (Servicebio, Wuhan, China) at 1:10 mass/volume ratio to 100 mg liver tissue. Then the protein concentration was measured and subjected to sodium dodecyl sulfate-polyacrylamide gel electrophoresis (SDS-PAGE). Proteins were separated and transferred on polyvinylidene difluoride (PVDF) membranes at a constant current of 300 mA for 30 min and added the primary and secondary antibodies to the incubation tank for immunoblotting reaction. The intensity of protein bands and image analyses were achieved by densitometry analysis using Image J software (NIH, MD, USA), and β-actin was measured as an internal standard.
2.7. Statistical analysis
All values are expressed as mean ± SD. The differences between groups were analyzed by the analysis of variance (ANOVA) test using SPSS 22.0 (SPSS Inc., Chicago, IL, USA). Asterisks ‘*’ and ‘**’ stand for significant differences at P < 0.05 and P < 0.01, respectively. Three replicates were set for each sample.
| 3. Results | ▴Top |
3.1. Effects on body, food intake and organ index
After 60 days of intervention, the body size and body weights of mice increased gradually, and the body weight of the HFD group was significantly higher than the ND group (P < 0.01). After 48 days, the body weight of the mice with EPC treatment was significantly reduced than that in the HFD and SPC groups (P < 0.01) (Figure 1a). The mice in ND showed more food intake than in the other groups, while there was no significant difference in food intake among HFD fed groups (P > 0.05) (Figure 1b).
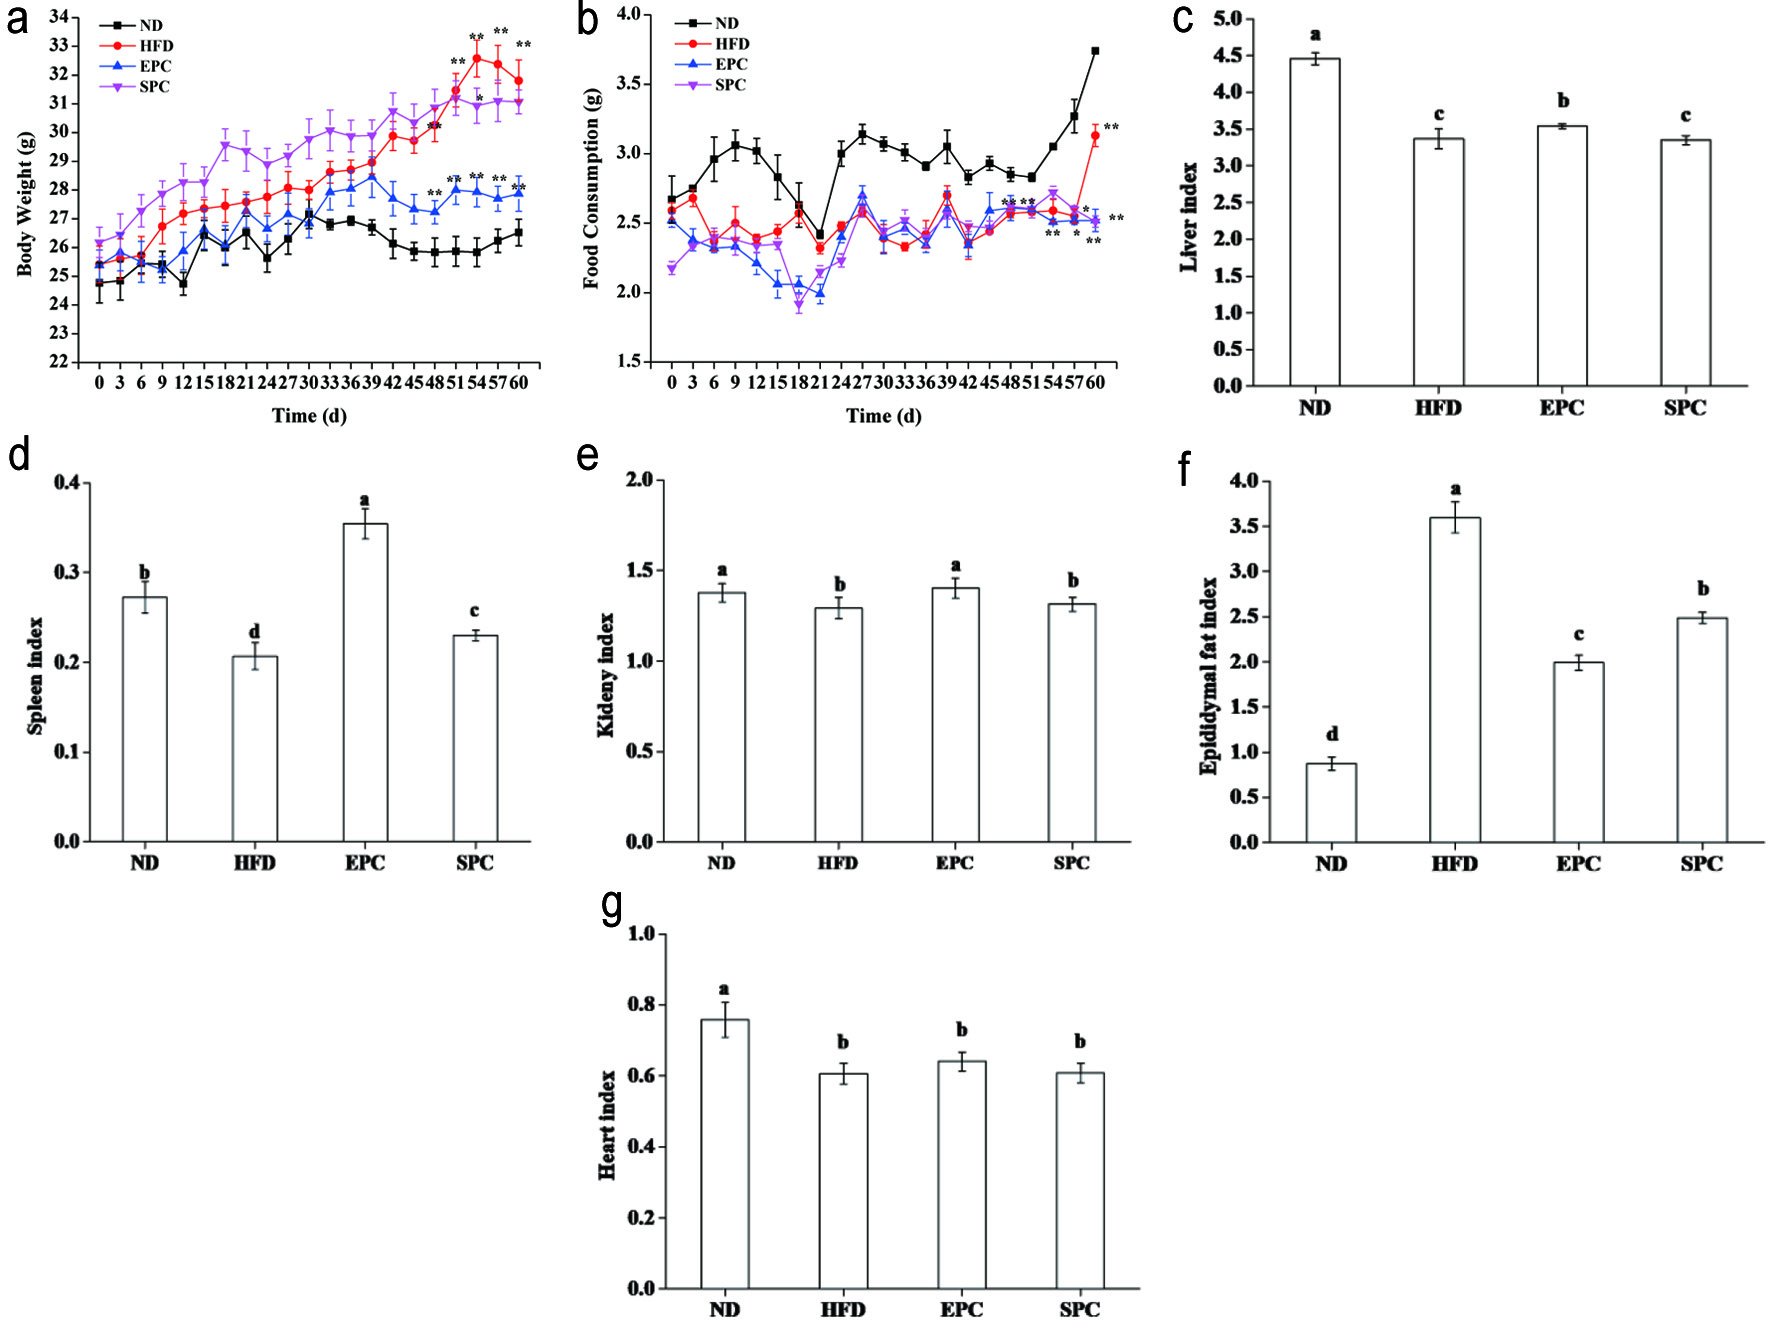 Click for large image | Figure 1. Effects of EPC and SPC on body weight (a), food consumption (b), liver (c), spleen (d), kidney (e), epididymal fat (f), and heart index (g). Asterisks ‘*’ and ‘**’ indicate significant differences at P < 0.05 and P < 0.01, respectively. a,b,c,d,e stand for significant difference among groups (ANOVA, P < 0.05) |
Furthermore, organ index of some tissues including liver, kidney, and spleen were significantly increased in EPC mice (P < 0.05), while no significant changes in liver and kidney indices in the SPC group than in the HFD group (P > 0.05) (Figure 1c–e). EPC and SPC groups also had a lower epididymal fat weight than the HFD groups (P < 0.05) (Figure 1f). No obvious difference was noticed among the HFD fed groups (P > 0.05), but significant reduced heart index was found in the HFD fed groups compared with the ND group (P < 0.05) (Figure 1g).
3.2. Effect on serum biochemical indicators
As shown in Figure 2, serum concentrations of TC and TAG in the HFD fed groups increased significantly than those of the ND group (P < 0.05), although the EPC and SPC groups did not differ from each other in TC level (P > 0.05) (Figure 2a, b). Notably, EPC significantly increased HDL-C level (P < 0.05), while preventing elevation of LDL-C due to HFD feeding (Figure 2c, d). The maximum ALT level (2.86 U/gprot) was found in the EPC group (Figure 2e). Compared with the HFD group, EPC caused a decrease in serum AST, which was also lower than SPC (P < 0.05) (Figure 2f). The ratio of AST/ALT with EPC than HFD fed mice, while increased significantly in the SPC fed mice (P < 0.05) (Figure 2g).
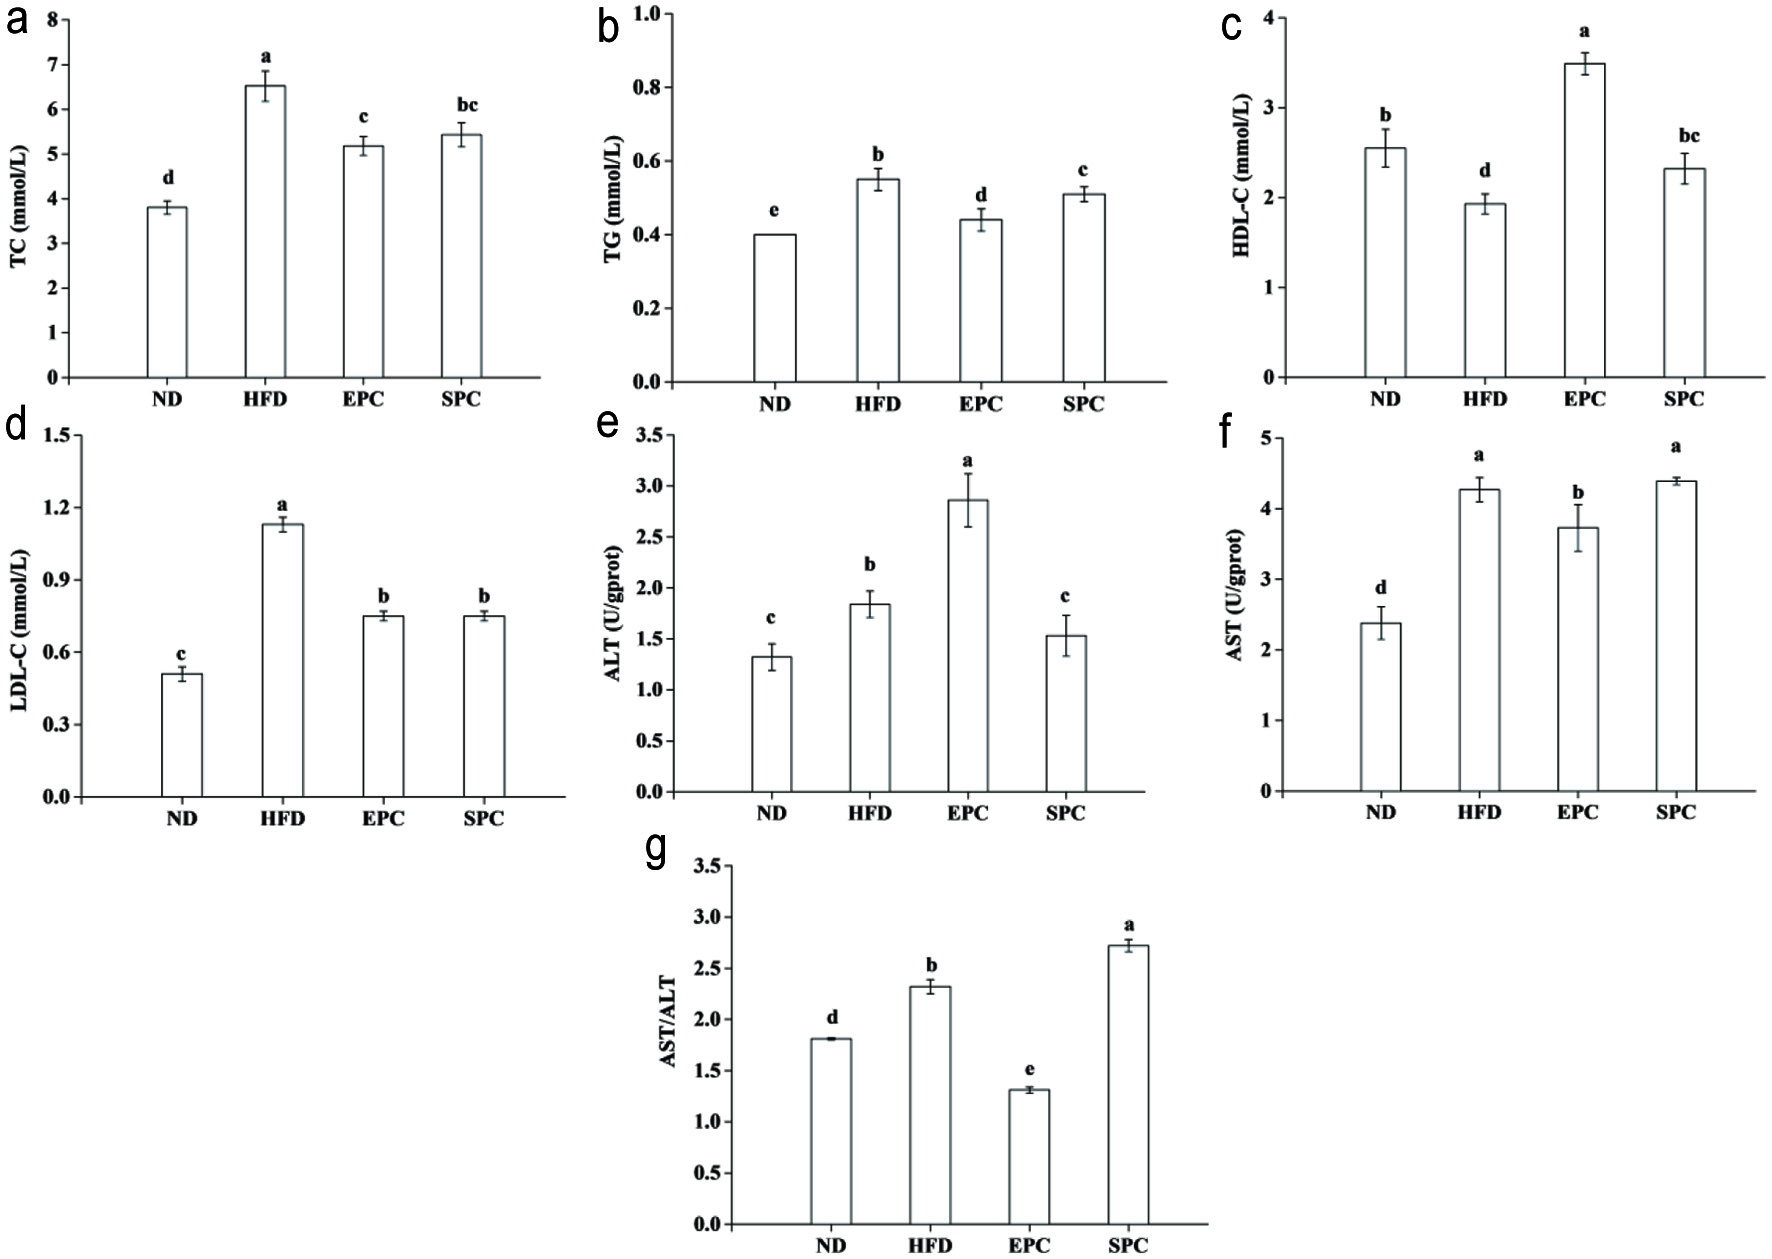 Click for large image | Figure 2. Effects of EPC and SPC on total cholesterol (TC) (a), triacylglycerol (TAG) (b), high-density lipoprotein cholesterol (HDL-C) (c), low-density lipoprotein cholesterol (LDL-C) (d), alamine aminotransferase (ALT) (e), aspartate transaminase (AST) (f), and AST/ALT (g) in serum. a–e stand for significant difference among groups (ANOVA, P < 0.05) |
3.3. Effect on hepatic biochemical indicators
Figure 3a and b shows that the mice fed HFD had increased hepatic TC and TAG compared with those fed ND. HFD-induced hepatic TC and TAG were significantly decreased by EPC and SPC intake (P < 0.05). No notable differences between EPC and SPC groups were observed in TC level (P > 0.05). Meanwhile, in comparison with HFD mice, EPC and SPC showed a significant improvement in AST, ALT and AST/ALT (P < 0.05) (Figure 3c–e). Although SOD activities in EPC and SPC were lower than HFD, there were no differences between these two groups (P > 0.05) (Figure 3f). Compared to HFD, the content of MDA in the EPC and SPC groups decreased by 48.3% and 59.6%, respectively (Figure 3g).
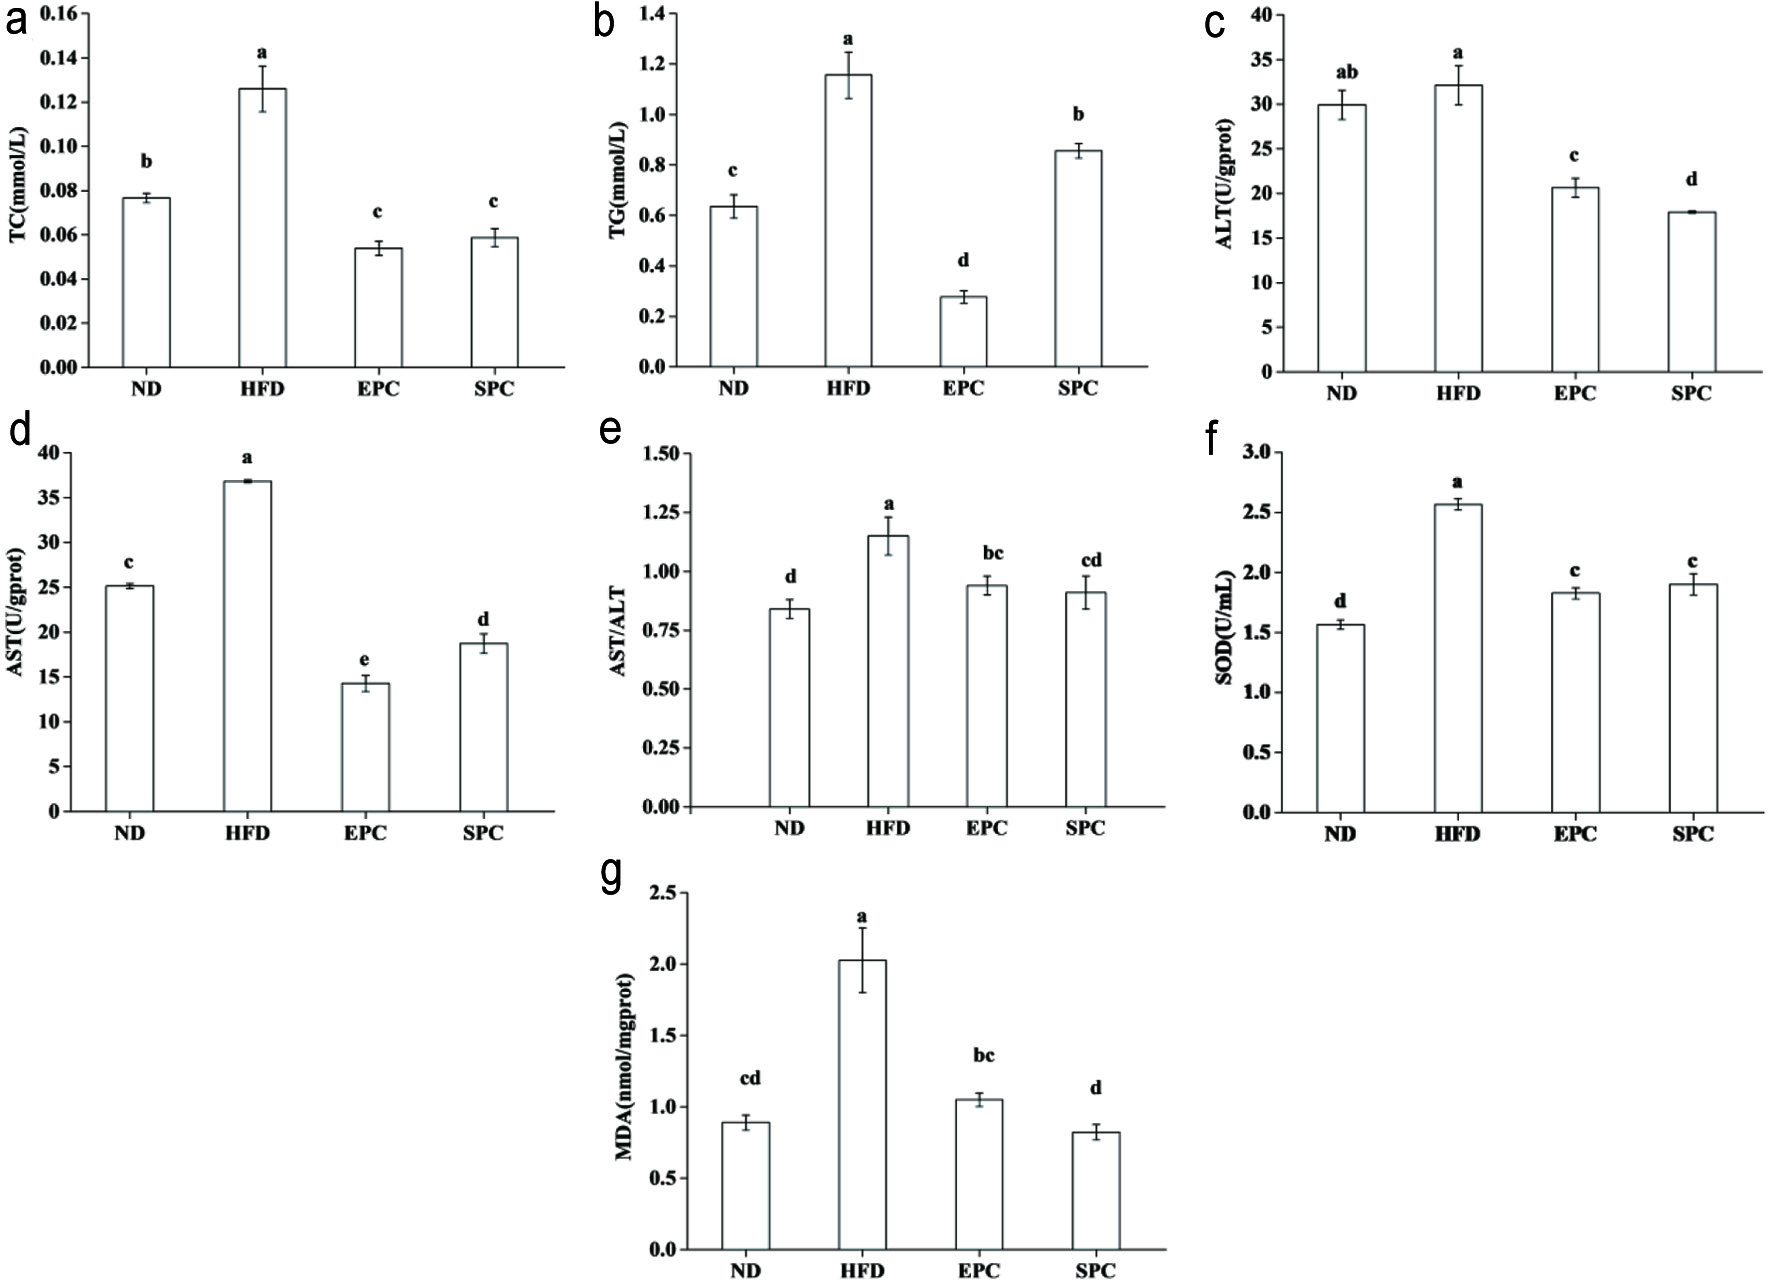 Click for large image | Figure 3. Effects of EPC and SPC on total cholesterol (TC) (a), triacylglycerol (TAG) (b), alamine aminotransferase (ALT) (c), aspartate transaminase (AST) (d), AST/ALT (e), superoxide dismutase (SOD) (f), and malondialdehyde (MDA) (g) in liver. a–e stand for significant difference among groups (ANOVA, P < 0.05) |
3.4. Effect on histopathology of hepatic and epididymal adipose tissue
The liver texture of the ND group was smooth, reddish brown, soft texture with an evident gloss, while the liver of the HFD fed groups was yellow brown with hard texture, and the surface was rough (Figure 4a). The hepatic histology results have also revealed that HFD accelerated smaller lipid-filled vacuoles accumulation in the liver. However, supplementation with EPC clearly suppressed the formation of lipid droplets (Figure 4b). Moreover, pebbles like structures and larger adipocyte size in epididymal adipose tissue were discovered in HFD-feeding mice, suggesting the adipocyte hypertrophy induced by long term HFD intervention. Notably, EPC supplementation could effectively reduce the increased adipocyte area in comparison with the HFD group (Figure 4c).
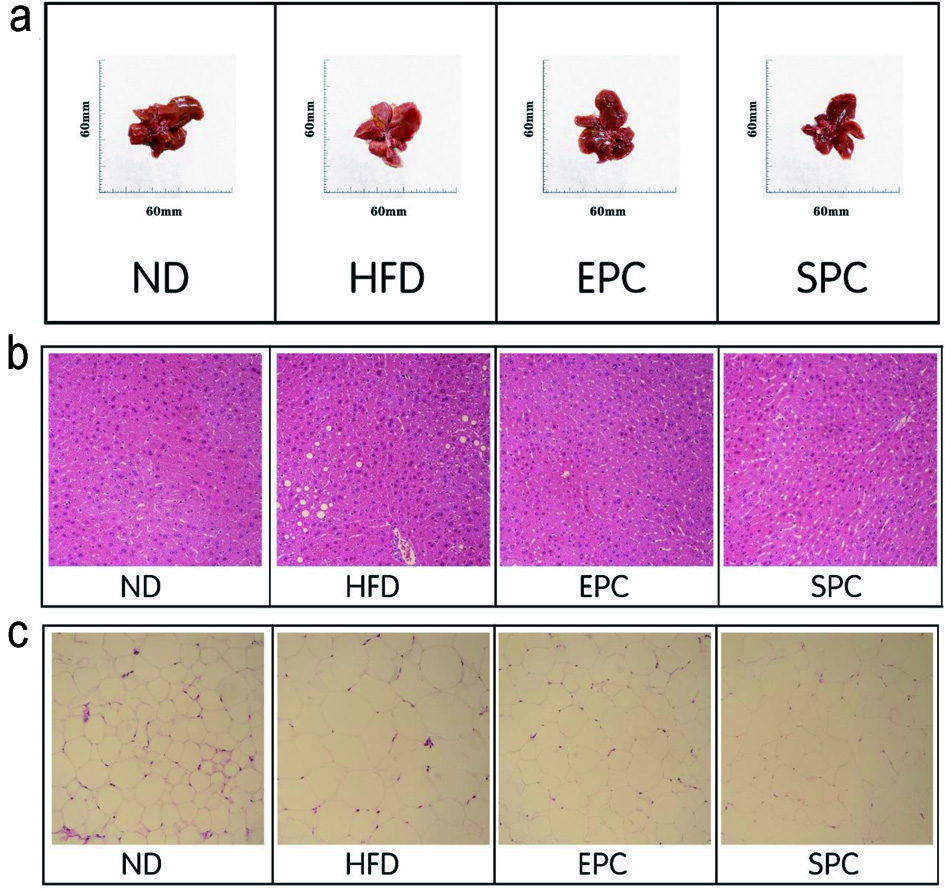 Click for large image | Figure 4. Effects of EPC and SPC on liver morphology (a), liver histology (b, ×400), and epididymal fat histology (c, ×400). |
3.5. Lipidomic analysis
3.5.1. Serum lipid type and content analysis
The two typical basic peak intensity (BPI) chromatograms of the serum samples were shown in Figure s1. The lipids were mainly distributed in the region from 0.5 min to 8 min, and each individual peak was clearly separated. In the ES+ mode, a total of 558 lipids were detected, and the main lipids were TAG (121), PC (91), phosphatidyl ethanolamine (PE) (60), lysophosphatidyl choline (LPC) (51), carnitine (CAR) (48), sphingomyelin (SM) (39), diacylglycerol (DG) (37), lysophosphatidylethanolamine (LPE) (24). In ES-mode, a total of 121 lipids including free fatty acid (FFA) (25), PC (20), Eicosanoid (12), PE (12), phosphatidylinositol (PI) (9), LPE (8), bile acid (BA) (6) were detected.
In the ES+ mode, PC and LPC were two most abundant. Compared with the HFD group, the LPC and CE content of the EPC group was significantly reduced, but the content of PC and PE has significantly increased (P < 0.05). Compared with the SPC, EPC significantly reduced LPC, while increased PC, PE and SM (P < 0.05) (Figure s2a). Meanwhile, the results showed that most FFA and LPC content were detected in ES-mode. LPE decreased while ceramide 1-phosphate (CerP) increased in the HFD group than ND group. Furthermore, EPC significantly decreased the content of lysophosphatidylinositol (LPI) (P < 0.05), while increased PE and phosphatidylserine (PS) compared with HFD. Compared with the SPC group, EPC elevated the total amount of Eicosanoid, while did not change in the overall abundance of PC and PI (Figure s2b).
3.5.2. PCA and OPLS-DA analysis
The PCA analysis was employed to discriminate the difference of the serum lipid profiles by the EPC and SPC supplementation for 60 days. The PCA score chart showed that the first component (contribution rate of 37.2%), the second principal component (contribution rate of 11.5%), and the total contribution rate of the two components is 48.7%, indicating that all variables can be better explained. The PCA score plot showed a clear discrimination among the ND group, HFD and the other two groups (Figure 5a).
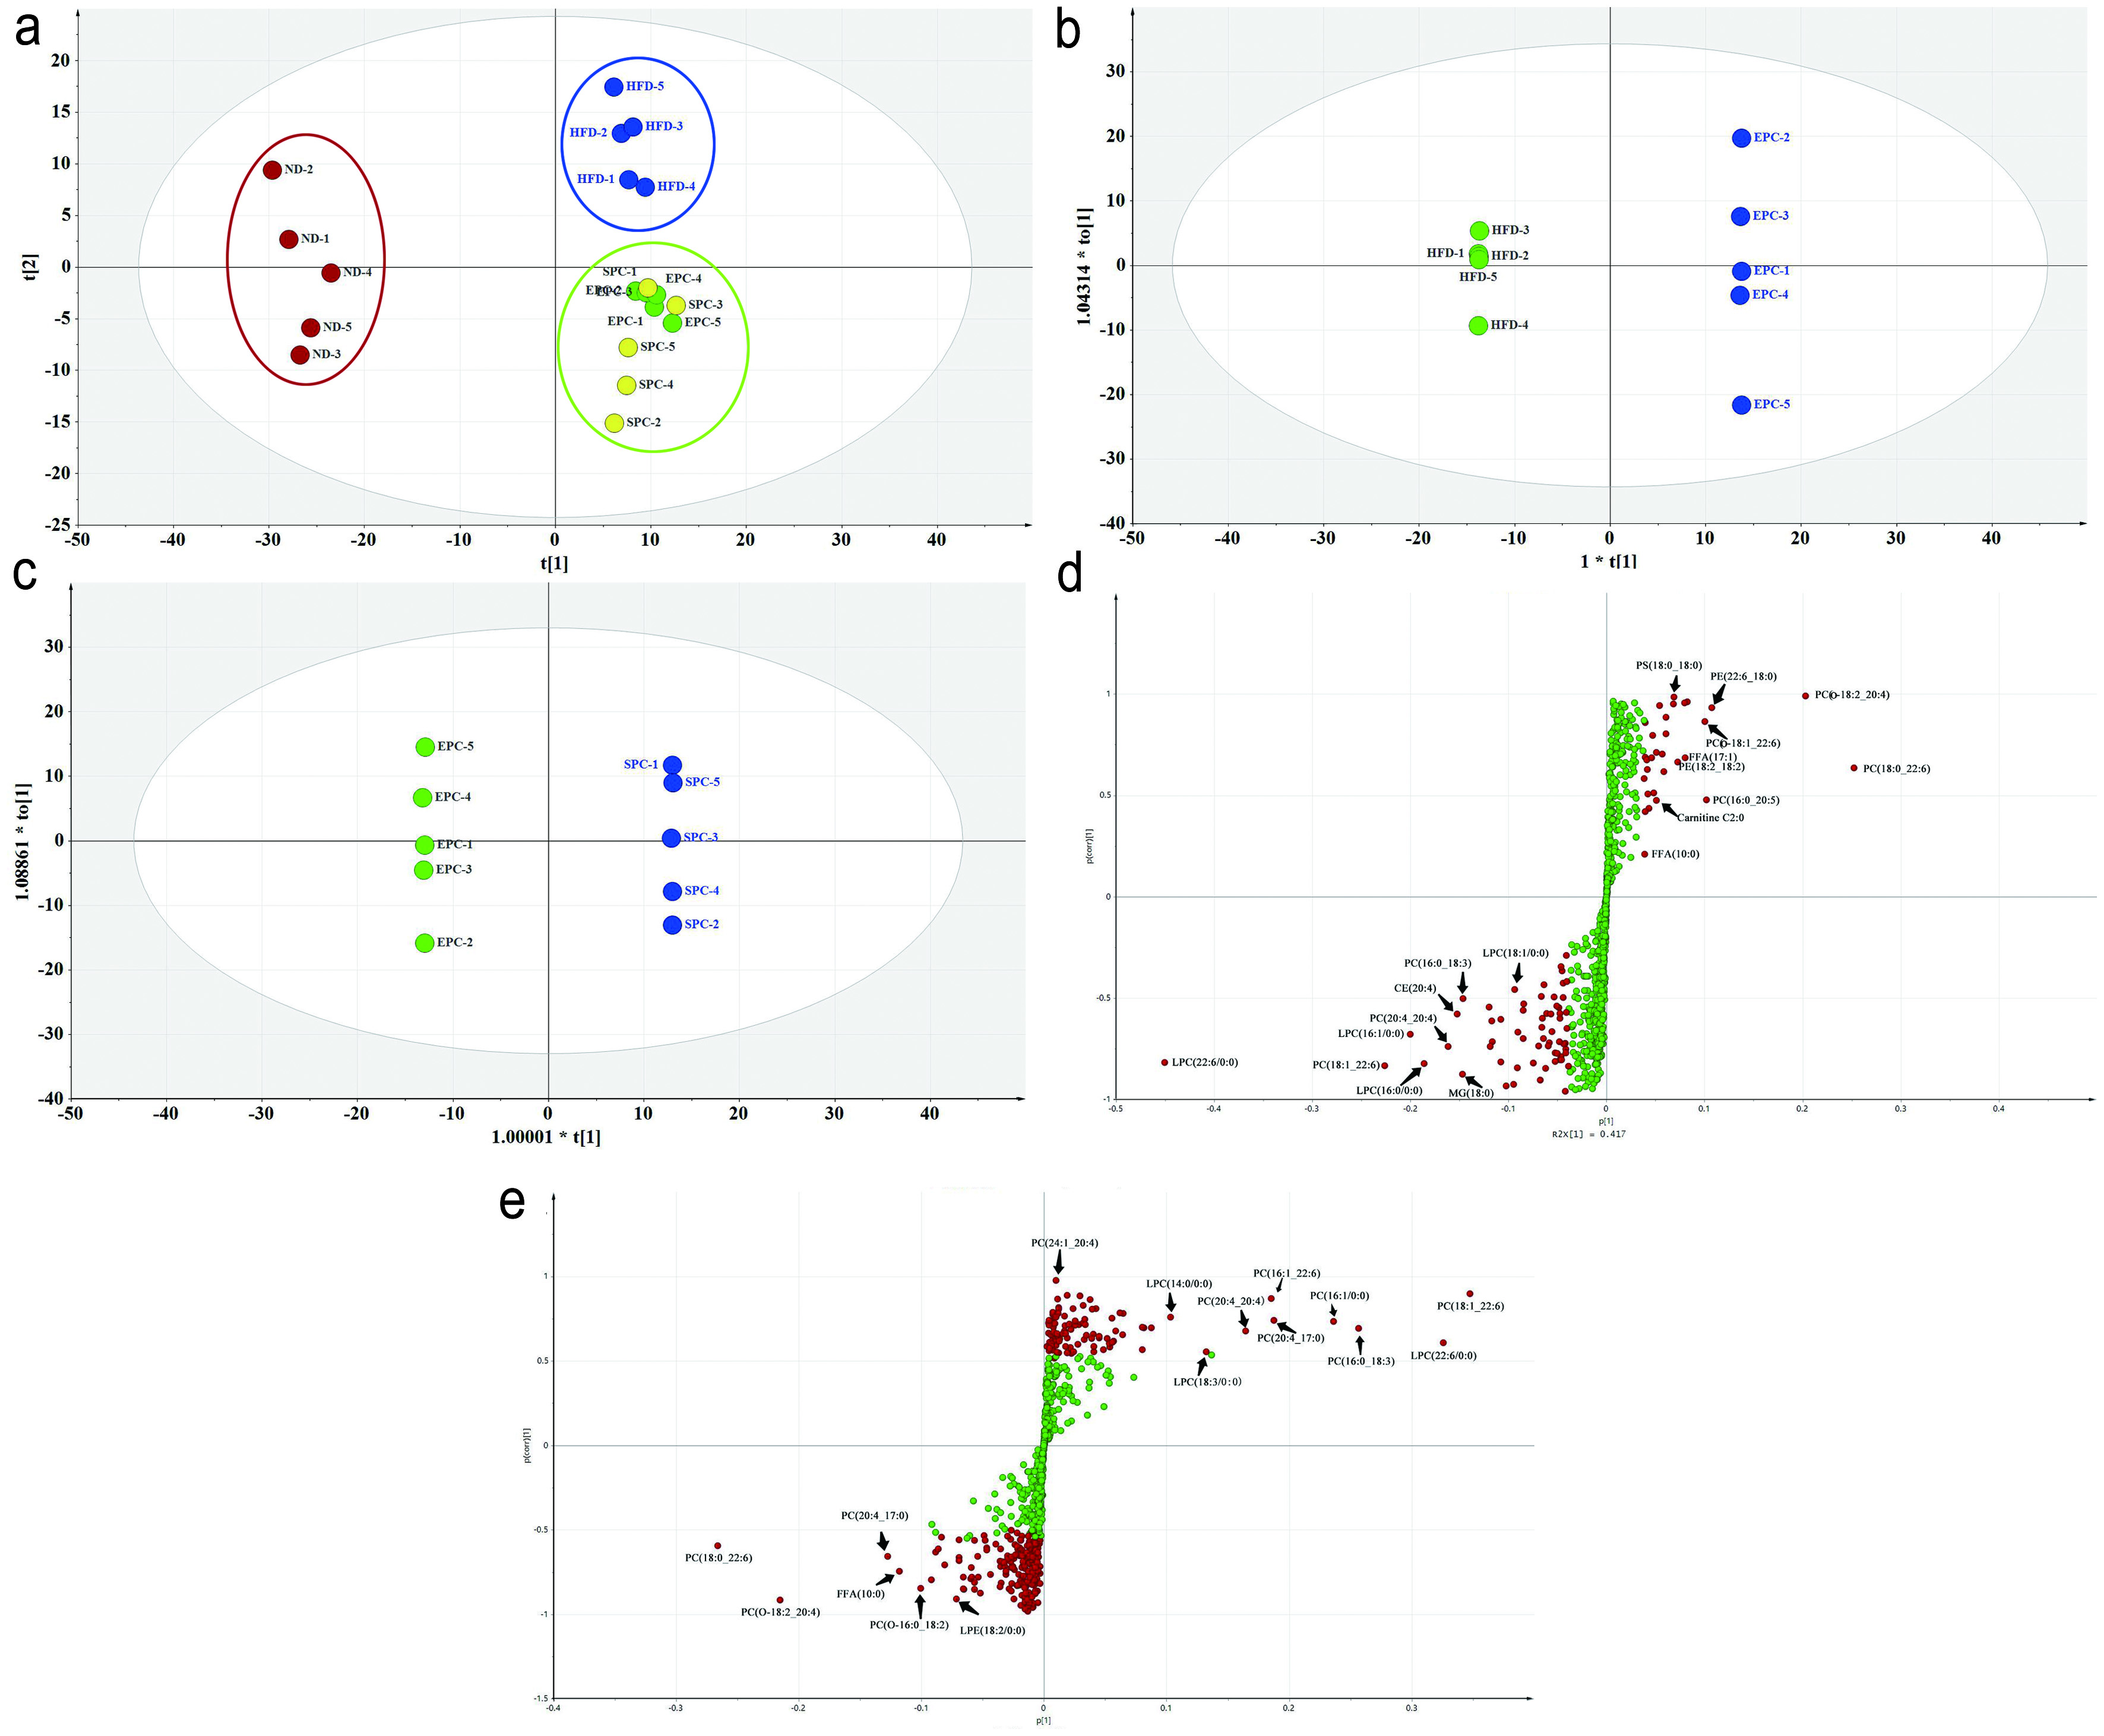 Click for large image | Figure 5. PCA and OPLS-DA of lipid species in serum. (a) PCA score plot; (b) OPLS-DA score plot of HFD vs EPC; (c) OPLS-DA score plot of EPC vs SPC; (d) S-Plot of HFD vs EPC; (e) S-Plot of EPC vs SPC. |
The cluster of the EPC and SPC groups were slightly separated from the HFD group, which indicates that EPC and SPC may improve lipid metabolism. In order to further screen out the regulated lipids by EPC and SPC, the OPLS-DA models were established and OPLS-DA score plots were shown in Figure 5b and c. There were obvious separations among the tested groups. The OPLS-DA permutation test parameters between groups were showed as follows: the Q2s corresponding to the ND group vs HFD group, HFD group vs EPC group, and EPC group vs SPC group were 0.0625, −0.402, −0.279, respectively. The corresponding R2 values were 0.757, 0.505, 0.675 (Figure s3). The difference between R2Y and Q2 indicates a good fitting degree of the model. Thereafter, S-plots obtained from OPLS-DA were proposed to identify potential biomarkers, and remote dots from the main-data cluster were considered as the main contributors for group separation. Combined with the parameter VIP and P-value, the significant differential lipids were screened out as potential biomarkers from the S-plots (Figure 5d, e).
3.5.3. Differential lipids and metabolic pathways analysis
There were the most differential lipids (45) in ND group between HFD group, of which PC accounted for the largest proportion (11). Furthermore, a total of 10 specific differential lipids, including PE (4) and TAG (2) were selected. Only 6 differential lipids, namely CE (1), hexosaccharide ceramide (HexCer) (1), LPE (P-22:0) (1) and TAG (3) were found in EPC vs SPC. Subsequently, cluster analysis of different lipids was performed. Heatmap with clustering visualization according to the lipid biomarker levels showed significant differences between two compared groups (Figure 6). The HFD significantly up-regulated HexCer (d18:2/20:0), HexCer (d18:1/18:1), CerP (d18:1/24:1), CerP (d18:1/14:0), while significantly down-regulated TAG (18:2 22:5_22:6), TAG (16:0_22:6_22:6), TAG (18:2_20:5_22:6), Carnitine C13:0, LPC (19:0 /0:0) compared with the ND (Figure 6a). Compared with the HFD group, PE (20:1_18:0), PE (22:6_20:0), PE (18:2_16:0), PE (17:0_22:6), and 9,10-DiHOME were significantly increased, but LPI (16:0/0:0) and thromboxane B2 (TXB2) were significantly decreased in EPC group (Figure 6b). EPC significantly elevated CE (16:2), TAG (16:0_18:0_20:1), TAG (18:0_18:1_20:1), while significantly reduced Hex2Cer (d18:2/16:0) and LPE (P-22:0) than SPC (Figure 6c).
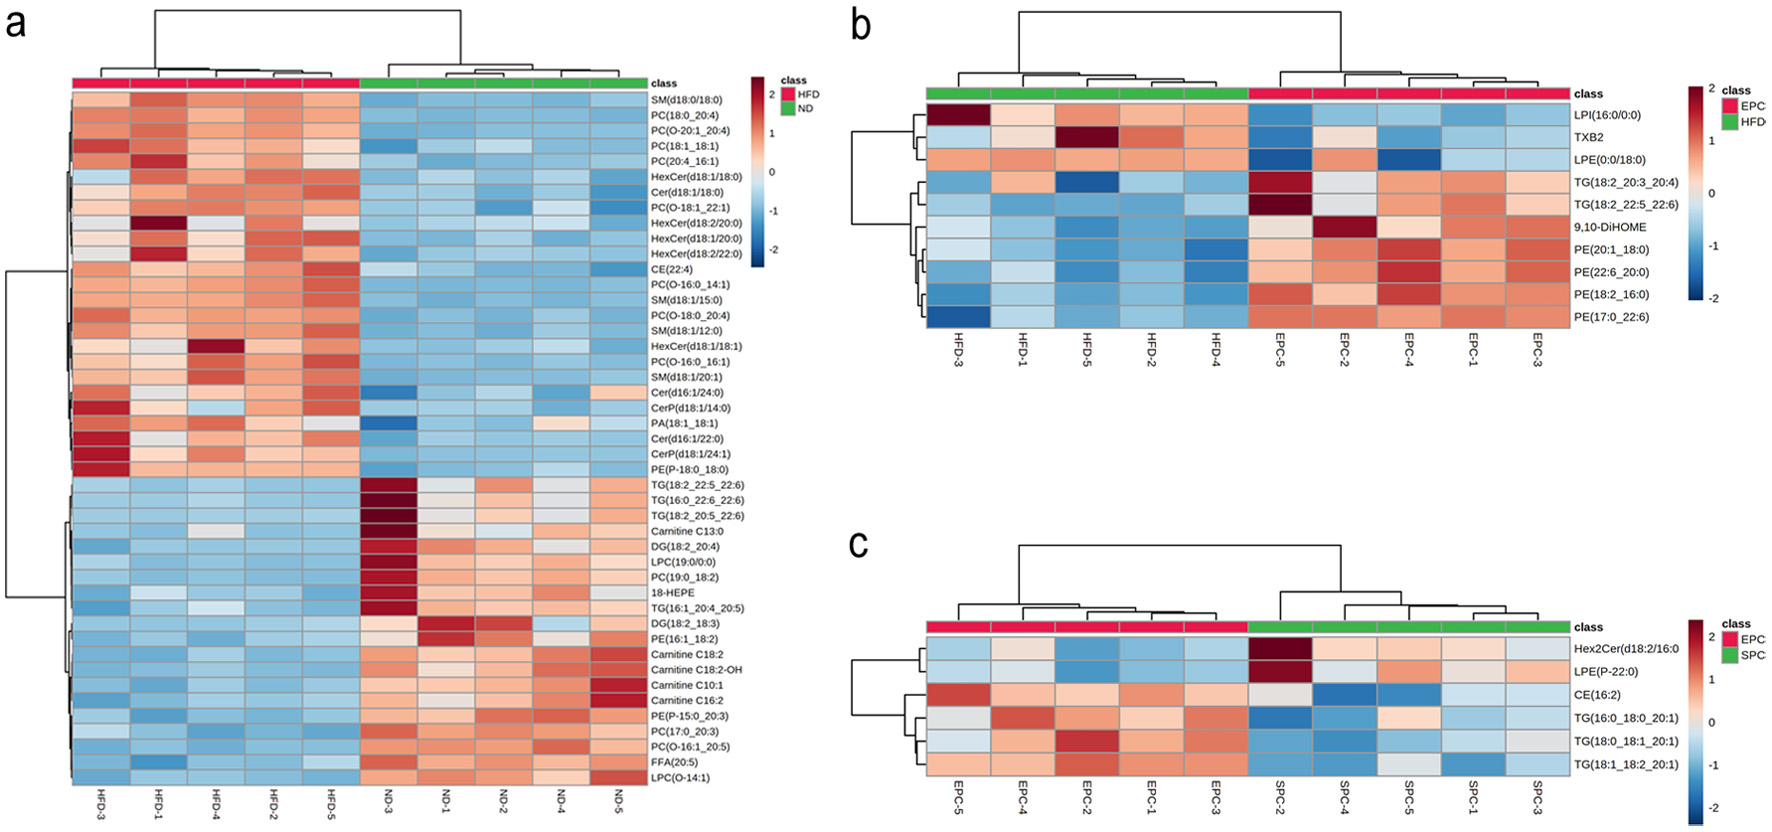 Click for large image | Figure 6. Heat map analysis of serum differential lipid biomarkers in ND vs HFD (a), HFD vs EPC (b), EPC vs SPC (c). Color indicates the changes of selected lipid biomarkers: the dark red color indicates up-regulated lipid biomarkers, while the dark green color indicates down-regulated lipid biomarkers. |
Next, pathway enrichment analysis of differential lipids was conducted using the KEGG pathway database. This result indicates that the lipids regulated by EPC mainly were TAG and PE, and glycerophospholipid metabolism is the most relevant metabolic pathway (Figure 7a). In order to further confirm the glycerophospholipid metabolism pathway, we determined the expression levels of relevant proteins. Compared with HFD, the markedly down-regulated expression for sterol-regulatory element binding proteins sterol-regulatory element binding proteins (SREBP-1c) in the EPC and SPC groups were 0.07 and 0.57, respectively. EPC and SPC also inhibited the relative expression of carnitine palmitoyltransferase 1b (Cpt1b) (P < 0.05) (Figure 7b, c). Compared with the HFD group, the levels of PPAR-α and tumor necrosis factor-α (TNF-α) in the EPC group were reduced by 21.3% and 31.9%, while the level of PPAR-α in the SPC group was significantly higher than that in the HFD group (P < 0.05) (Figure 7d, e). However, there was no significant difference in TNF-α expression between the SPC and HFD groups (P > 0.05).
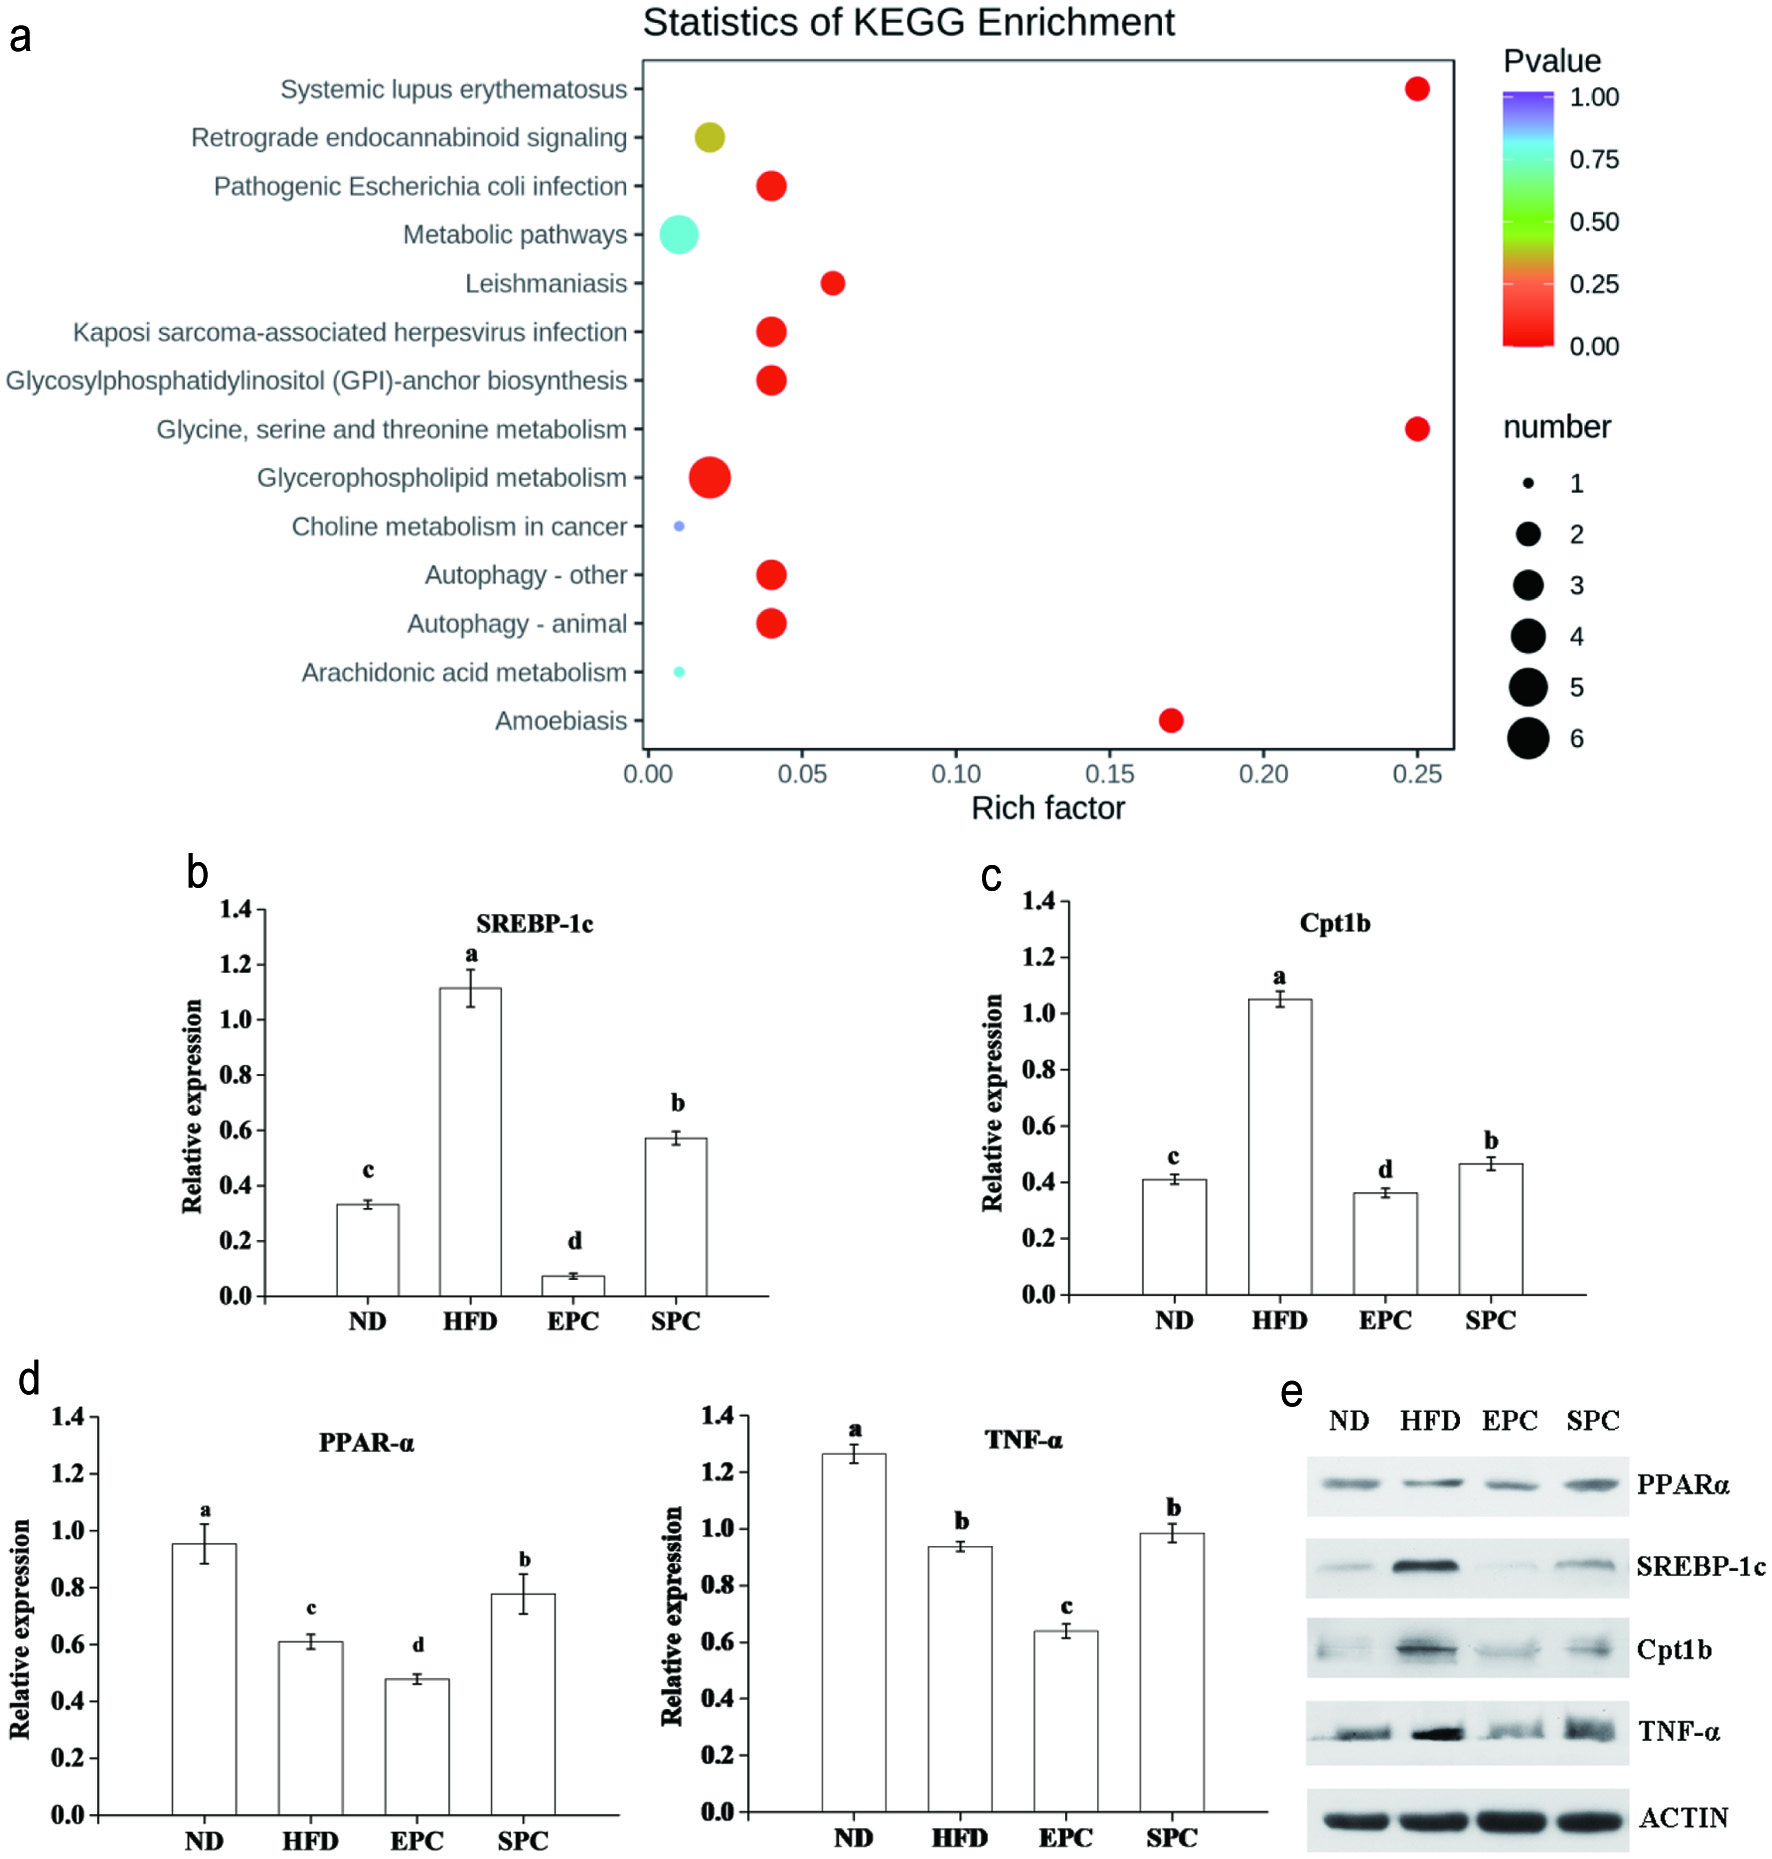 Click for large image | Figure 7. Involved metabolic pathways of the potential biomarkers and expression of related proteins for EPC and SPC treatment. (a) Statistics of KEGG enrichment; (b) sterol-regulatory element binding proteins sterol-regulatory element binding proteins (SREBP-1c); (c) carnitine palmitoyltransferase 1b (Cpt1b); (d) peroxisome proliferator-activated receptor α (PPAR-α); E. tumor necrosis factor-α (TNF-α); F. Representative picture for western blots protein bands. |
| 4. Discussion | ▴Top |
Studies have shown that obesity is a risk factor for numerous clinical diseases, and it can also be regarded as an important basis for the diagnosis and prevention of cardiovascular disease and diabetes (Suliga et al., 2017). Previous studies have suggested that PC could alleviate HFD-induced hyperglycemia and hyperlipidemia (Xue et al., 2019). To further verify its regulatory mechanism, a HFD induced mice model for obesity was established. The effects of EPC and SPC on the blood lipid metabolism in obesity mice were then explored.
The organ index is an indicator that reflects the growth of organs relative to body weight, and to some extent, it may directly reflect the degree of organ damage (Garcia-Compean et al., 2016). The accumulation of visceral fat, especially epididymal fat, is a basic feature of obesity (Gholami et al., 2018). We found that HFD feeding could significantly increase body weight and epididymal fat accumulation in mice, while EPC could alleviate obesity by inhibiting fat accumulation caused by HFD diet. In addition, a HFD may also lead to kidney abnormalities and functional impairment, such as renal dilation and inflammation (Drescher et al., 2019). The spleen is one of the main immune organs, and the spleen indices can reflect and predict the immune function of the body (Li et al., 2020). Our results showed that EPC suppressed the decrease in kidney and spleen index caused by the high-fat diet in mice, which indicates that EPC had a protective effect on the immune system and kidney of obesity mice. Low level of TC and high level of HDL-C in serum contribute to maintaining the body lipid metabolism balance (Min et al., 2018). TAG is the main component of body fat, and excessive TAG deposition in the liver can cause metabolic dysfunctions and hepatomegaly (Jiang et al., 2018). Dietary PC prevented body weight gain and lipid accumulation in mice by reducing serum TC and TAG levels or by lowering the value of HDL/TC (Lee et al., 2014). After 60 days of diet intervention, EPC significantly reduced TC, TAG and LDL-C in liver and serum, which was in agreement with previous study (Yang et al., 2021).
AST and ALT, biomarkers of liver injury, which are released from liver to blood when there is damage in the liver (Shi et al., 2020). AST/ALT ratio is also a key hallmark of visceral fat accumulation in daily clinical practice (Ohgo et al., 2009). Lee and Lee (2021) showed that the elevated levels of oxidative stress led to the significant increase of lipid peroxidation products MDA and SOD. Therefore, compared with HFD group, EPC reduced serum AST and liver SOD activity by 12.6% and 26.1%, respectively. Meanwhile, AST/ALT ratio in EPC group (1.31) was significantly lower than that in HFD group (2.32), which indicates that EPC could improve liver lipid peroxidation and effectively prevented liver injury in obese mice.
Lipidomics is widely applied to study lipid profiles changes and identifying lipid biomarkers in obesity model (Zhai et al., 2018). High-throughput lipidomic analysis in serum was performed to further investigate the regulation mechanism of EPC. EPC and SPC generally decreased the levels of CE, monoacylglycerol (MAG), HexCer and LPC, but elevated that of PE and PS. Besides, EPC showed more significant effects than SPC in preventing these lipids changes. It has been reported that lipid metabolites, including PC, TAG, LPC, PE, and fatty acyl groups, were potential biomarkers of lipid metabolism disorders caused by HFD (Pati et al., 2018). Therefore, the alteration in these lipids could help to further assess the beneficial effects and regulatory mechanisms of EPC. Sterol lipids are involved in cholesterol homeostasis, and their increased levels are linked to metabolic syndrome, obesity, and diabetes (Cui et al., 2020). Feng et al. (2018) showed that HFD treatment significantly increased CE biomarkers, which is consistent with our results. In addition, the herbal tea improved diabetic dyslipidemia by improving 30 lipids in serum including CE, DG in diabetic mice (Zhai et al., 2018). Lower hepatic levels of Cer 16:0, showed protective effects on obesity rats fed HFD (Velazquez et al., 2020). MG is an essential precursor for resynthesis and biosynthesis of DG and TAG, and lower MG in EPC group was associated with reduced TAG accumulation (Shah et al., 2019). Studies have shown that increased LPC could be used as a biomarker for HFD-induced obesity-resistant mice (Hadchouel et al., 2015). In addition, Jin et al. (2014) found that consuming turmeric has a certain preventive effect on hyperlipidemia mice by reducing the serum LPC level. Such lipid changes could contribute to the lipid-regulating effect of EPC in this study.
We further investigated differential lipids based on OPLS-DA and S-Plot. Compared with ND group, eight PCs including PC (20:4_16:1), PC (O-20:1_20:4) and PC (O-18:1_22:1), four SM including SM (d18:0/15:0), SM (d18:0/18:0) and PE (P-18:0_18:0) were increased, while two LPC, LPC (19:0/0:0) and LPC (O-14:1), four TAG including TAG (16:0_22:6_22:6) and TAG (18:2_20:5_22:6) were decreased in EPC group. LPC is a metabolite product formed by the enzymatic hydrolysis of PC by phospholipase A (PLA) (Wymann and Schneiter, 2008). Several studies demonstrate that LPC was involved in atherosclerosis diseases, and the chronic intake of HFD could decrease in the levels of LPC in the serum and liver (Garcia-Jaramillo et al., 2019). Our results also suggested that increased LPC by HFD may act as proinflammatory mediators, and cause inflammation (Barber et al., 2012). It has also been reported that HFD induced an increase in the levels of SM in the serum in a HFD chronic consumption nonobese mice (Kim et al., 2014). By comparing the changes in the lipid between EPC and HFD groups, a total of 4 unique PEs including PE (20:1_18:0), PE (22:6_10:0), PE (18:2_16:0) and PE (17:0_22:6) were selected as the potential biomarkers. PE is synthesized via the PS decarboxylation pathway. PE can be transferred with PC between microsomes and mitochondria, and the decrease of PE leads to steatosis (Ling et al., 2012). Park et al. (2017) has also reported on the lower level of PE (36:3) and PE (36:2) of liver in HFD-fed mice. Down-regulated PE biomarkers were found in our HFD mice, which is similar to previous results. The higher PE biomarkers in EPC group may contribute to explaining the attenuating TAG accumulation. 12,13-diHOME levels was positively correlated with and negatively related to fat increased and body mass index (BMI) (Stanford et al., 2018). Studies have reported that the altered DiHOME compounds were related to systemic inflammatory processes based on metabolomics study (Shen et al., 2018). In our study, EPC significantly increased 9,10-DiHOME, suggesting that EPC improved oxidative stress caused by HFD.
Further analysis based on differential lipids revealed that glycerophospholipid metabolism was the most relevant metabolic pathway. Glycerophospholipids is the most abundant group of phospholipids in vivo, which is associated with a lot of metabolic diseases. PPAR participates in the development and progression of steatohepatitis, and may become a target in drug therapy (Lim et al., 2017). In addition, LPC, an intermediate product of glycerophospholipid metabolism, can bind to PPAR-γ to regulate lipidic ligands (Wang et al., 2020). It has been reported that the decreased expression of PPAR-α in liver protected mice from high fat-induced hepatic steatosis by regulating conversion of saturated fatty acids to monounsaturated fatty acids (Abdelmegeed et al., 2011). Therefore, it can be suggested that down-regulated PPAR-α in EPC group may inhibit the accumulation of fat in the liver by reducing fatty acid oxidation. SREBP-1c and Cpt1b are involved in hepatic lipogenesis and fatty acid oxidation, and their overexpression accelerates cholesterol synthesis (Choi et al., 2020). In the present study, both EPC and SPC significantly down-regulate the expression of SREBP-1c and Cpt1b in HFD-induced obese mice, while EPC had a more marked effect. These reflected EPC could reduce the accumulation of liver fat and prevent the occurrence of fatty liver by regulating SREBP-1c and Cpt1b. Long-term HFD intake could trigger liver inflammation, which is the main factor in liver injury and metabolic disorder (Yeboah et al., 2016). TNF-α, an important pro-inflammatory cytokine, participates in development of fatty liver (Lai et al., 2019). It was proposed that the inhibitory effects of EPC on TNF-α, may also contribute to attenuating hepatic fat deposition.
| 5. Conclusion | ▴Top |
In summary, we focused on the lipidomics approach combined with an obesity mice model for investigating the effects of EPC and SPC on abnormal lipid metabolism. The results showed that EPC and SPC reduced TC and TAG, as well as MDA and SOD activity in liver. The beneficial effects were associated with the improvement in CE, LPC, PE and PS. The glycerophospholipid metabolism pathway was revealed as the most relevant pathway based on differential lipids. EPC regulated more effectively than SPC in the expression of SREBP-1c, PPAR-α, Cpt1b and TNF-α. Therefore, EPC could serve as agents for prevention of obesity and the regulatory mechanism are still needed in further studies.
| Supplementary material | ▴Top |
Acknowledgments
This study was supported by the Applied Basic Research of Shanxi Province (grant numbers 201901D211381) and the Innovation-driven Development Capacity Enhancement Fund of Shanxi Province (grant numbers SXYBKY2019041).
Both authors contributed equally to this work.
Conflict of interest
The authors of this study have declared no conflict of interest.
| References | ▴Top |