Figures
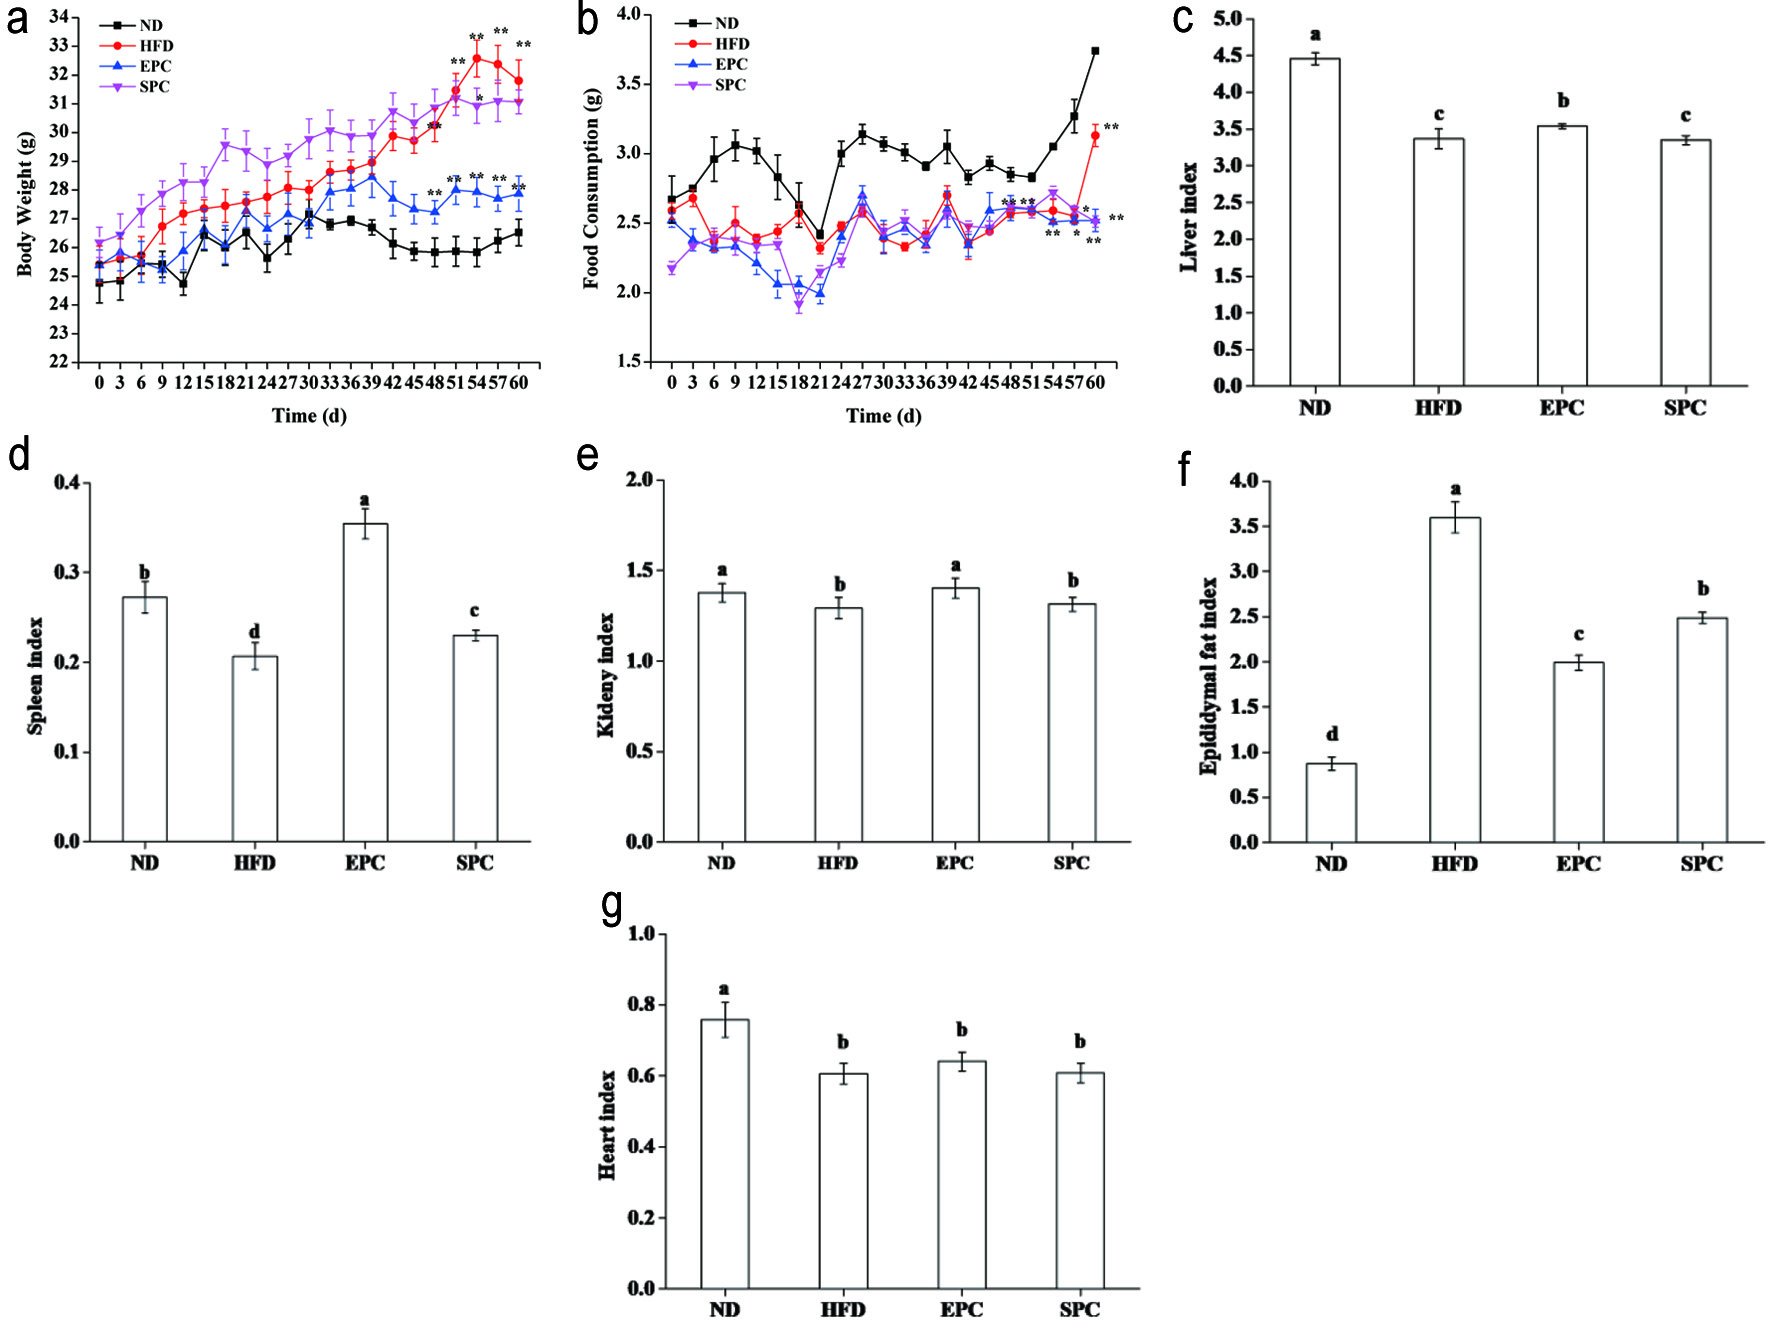
Figure 1. Effects of EPC and SPC on body weight (a), food consumption (b), liver (c), spleen (d), kidney (e), epididymal fat (f), and heart index (g). Asterisks ‘*’ and ‘**’ indicate significant differences at P < 0.05 and P < 0.01, respectively. a,b,c,d,e stand for significant difference among groups (ANOVA, P < 0.05)
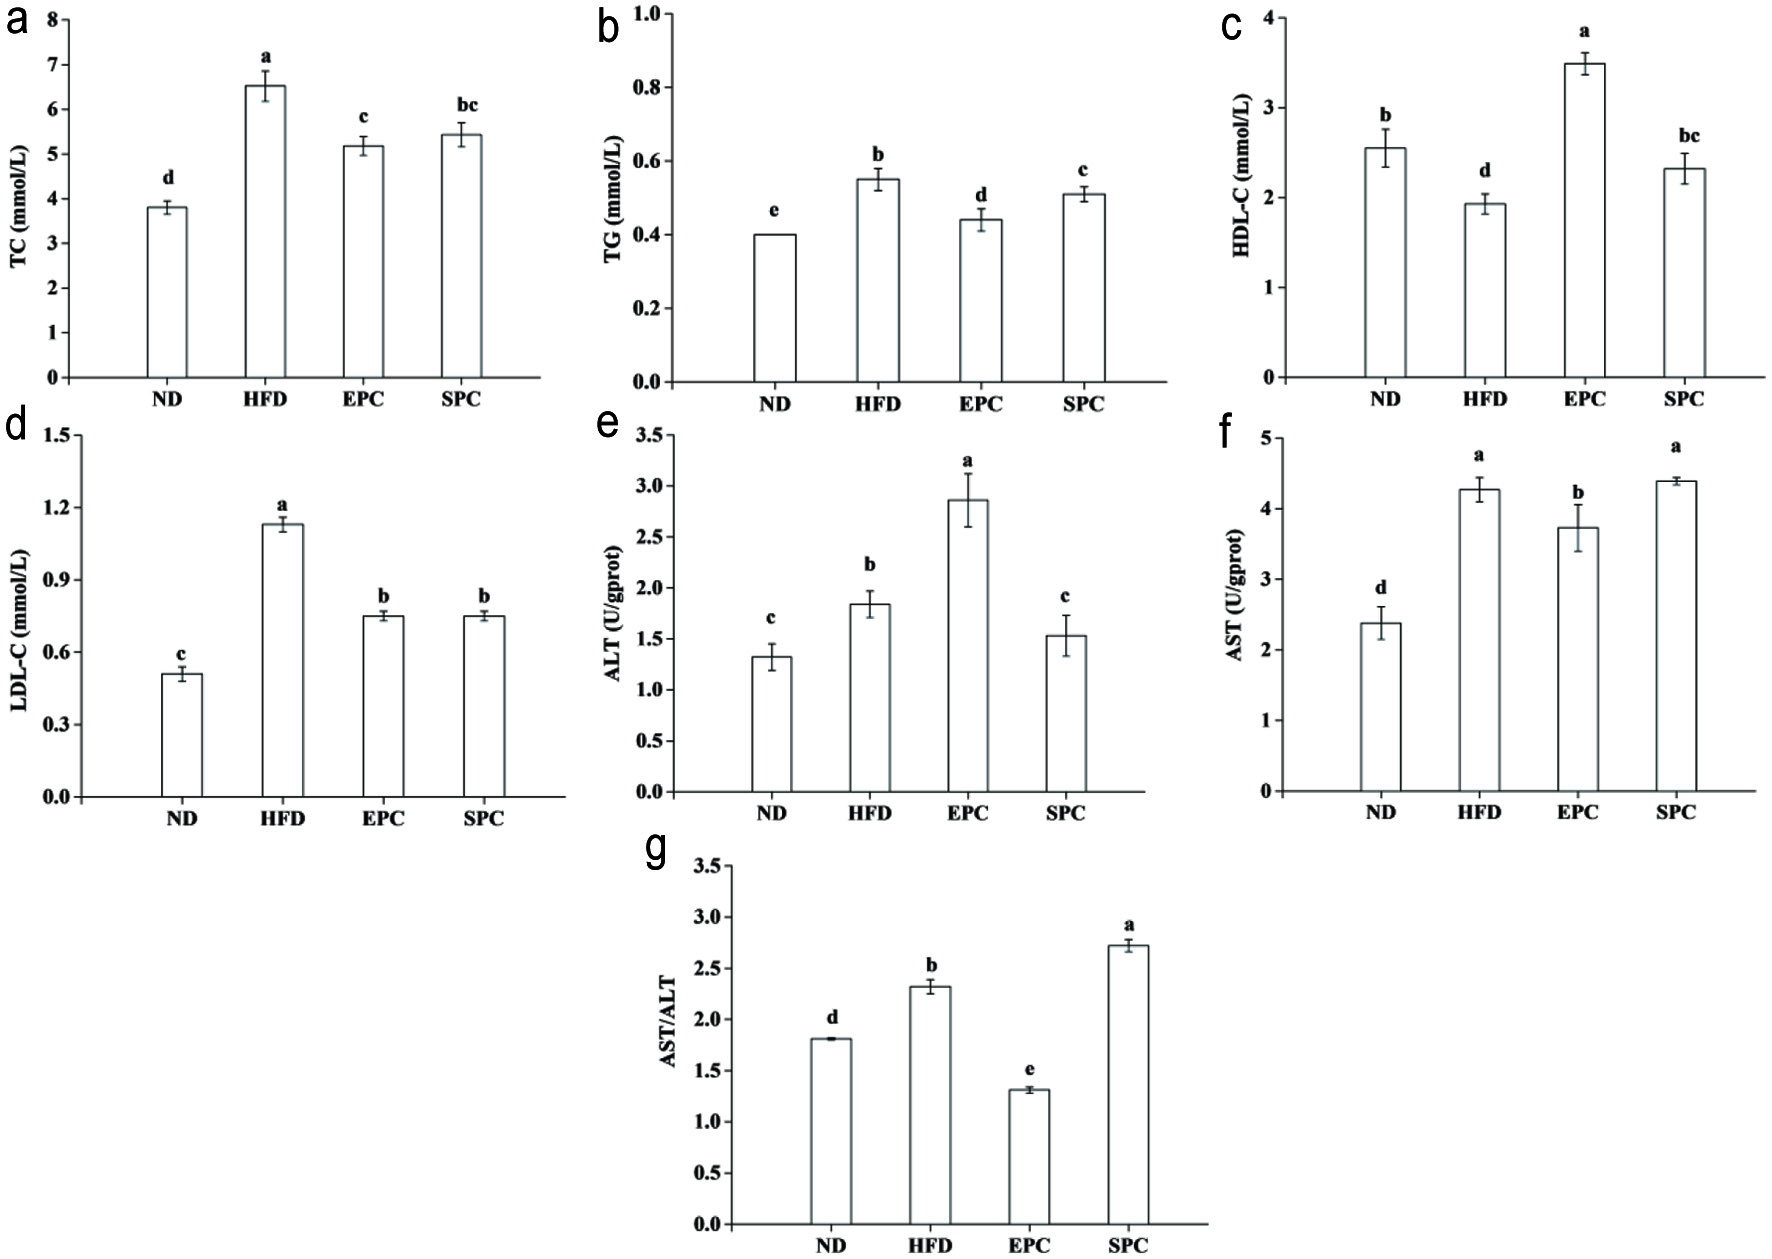
Figure 2. Effects of EPC and SPC on total cholesterol (TC) (a), triacylglycerol (TAG) (b), high-density lipoprotein cholesterol (HDL-C) (c), low-density lipoprotein cholesterol (LDL-C) (d), alamine aminotransferase (ALT) (e), aspartate transaminase (AST) (f), and AST/ALT (g) in serum. a–e stand for significant difference among groups (ANOVA, P < 0.05)
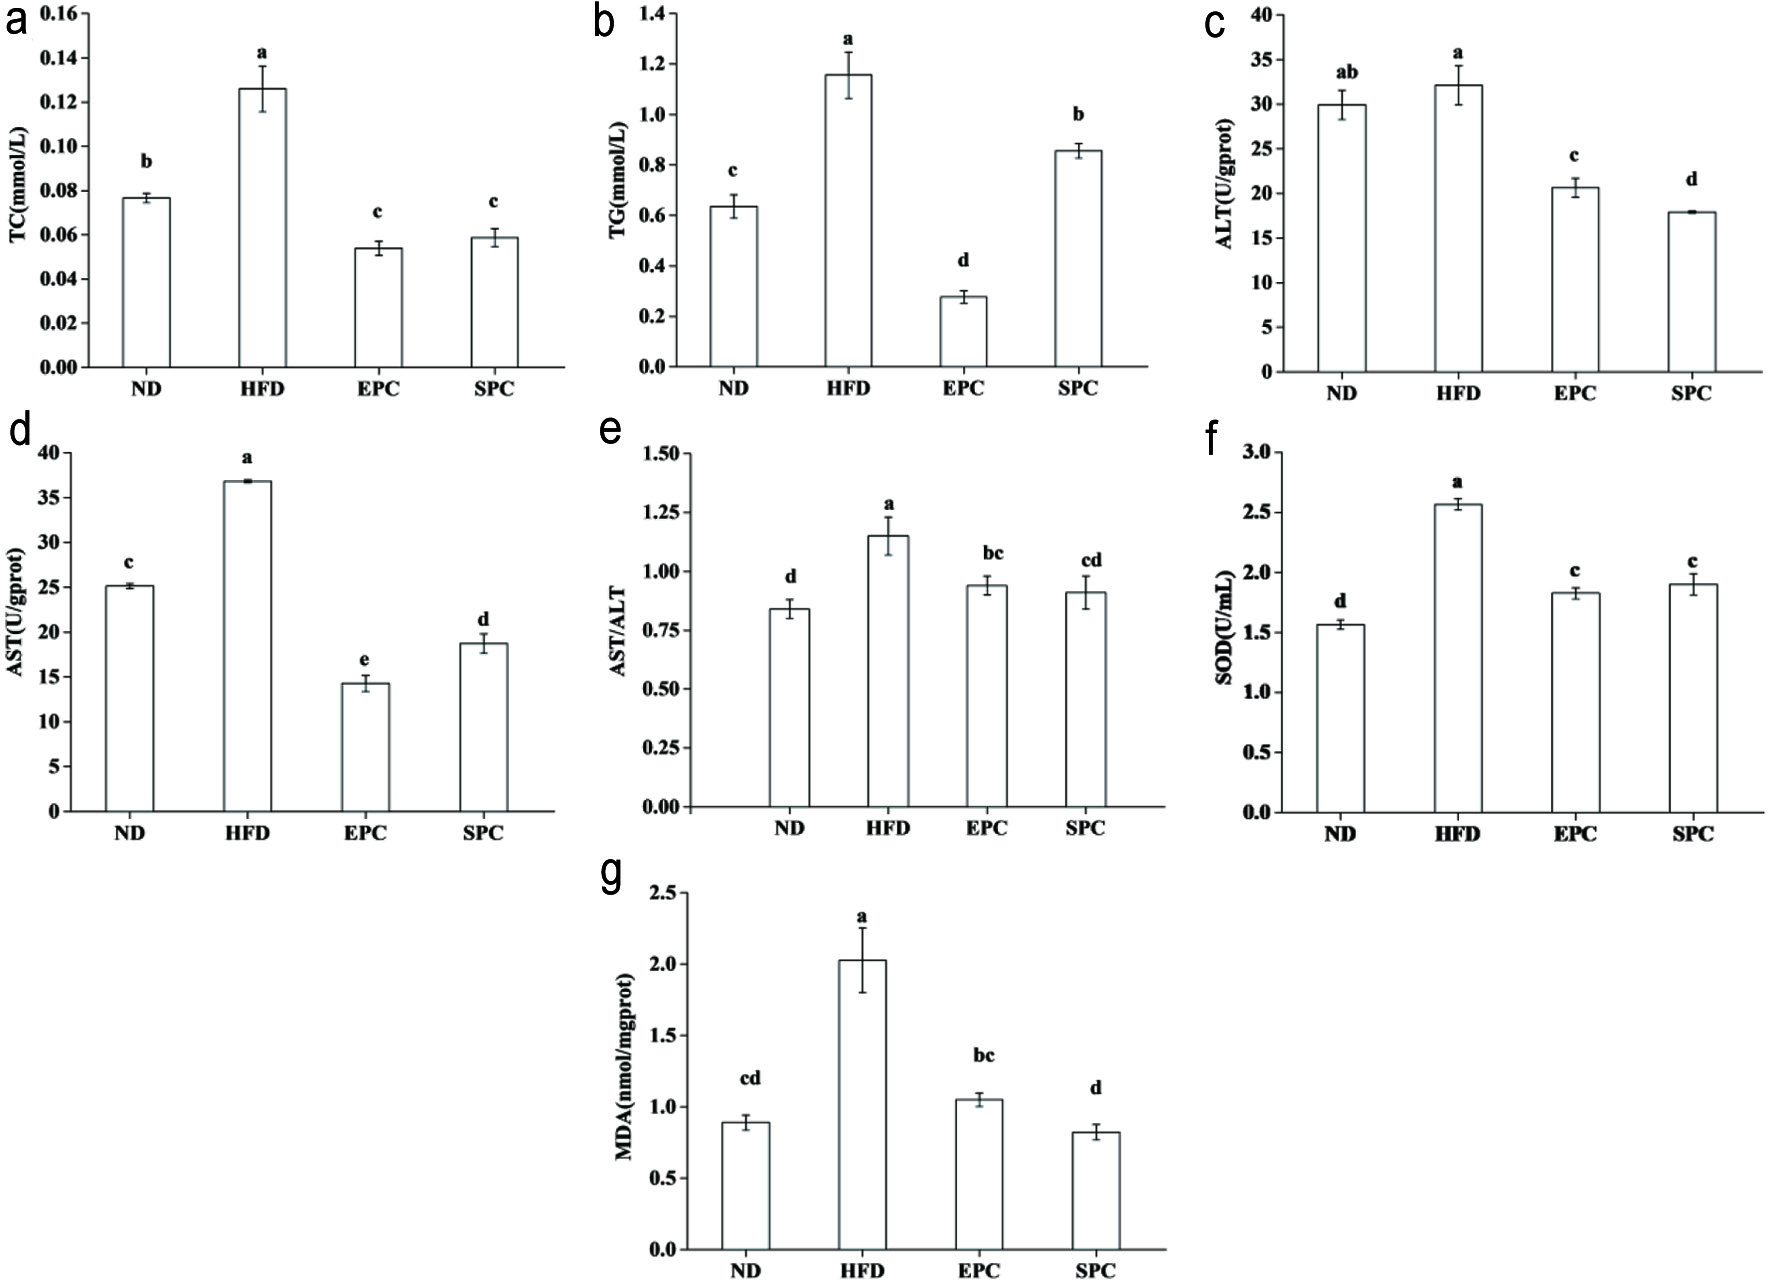
Figure 3. Effects of EPC and SPC on total cholesterol (TC) (a), triacylglycerol (TAG) (b), alamine aminotransferase (ALT) (c), aspartate transaminase (AST) (d), AST/ALT (e), superoxide dismutase (SOD) (f), and malondialdehyde (MDA) (g) in liver. a–e stand for significant difference among groups (ANOVA, P < 0.05)
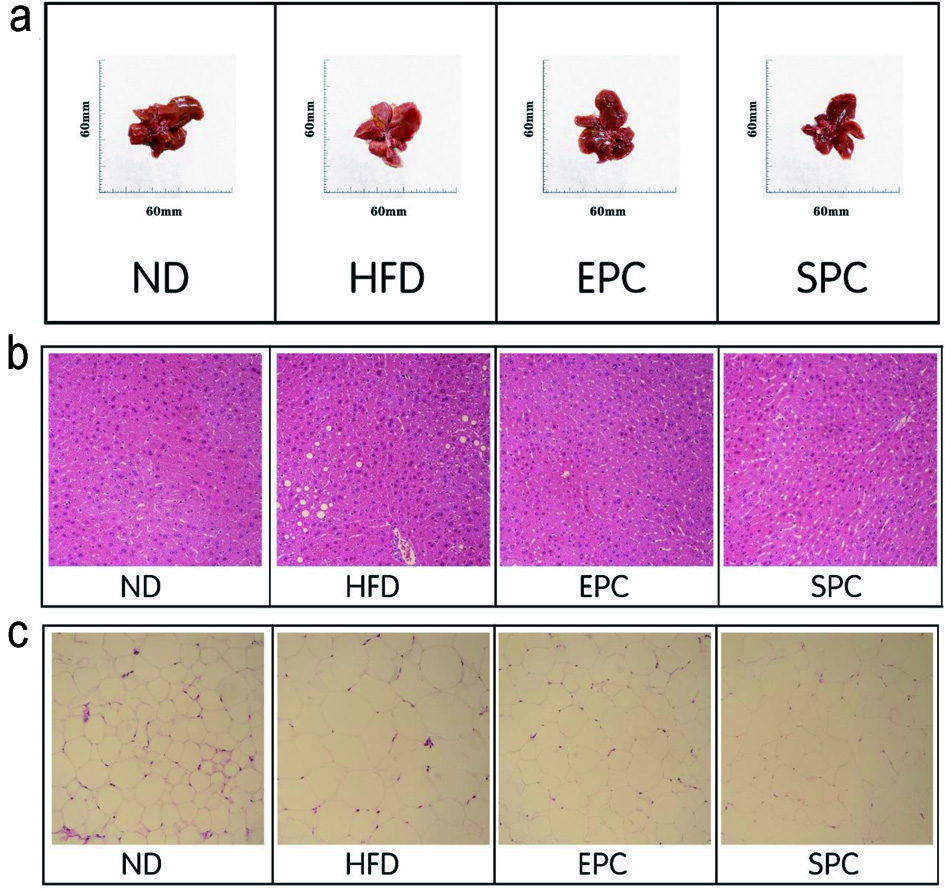
Figure 4. Effects of EPC and SPC on liver morphology (a), liver histology (b, ×400), and epididymal fat histology (c, ×400).
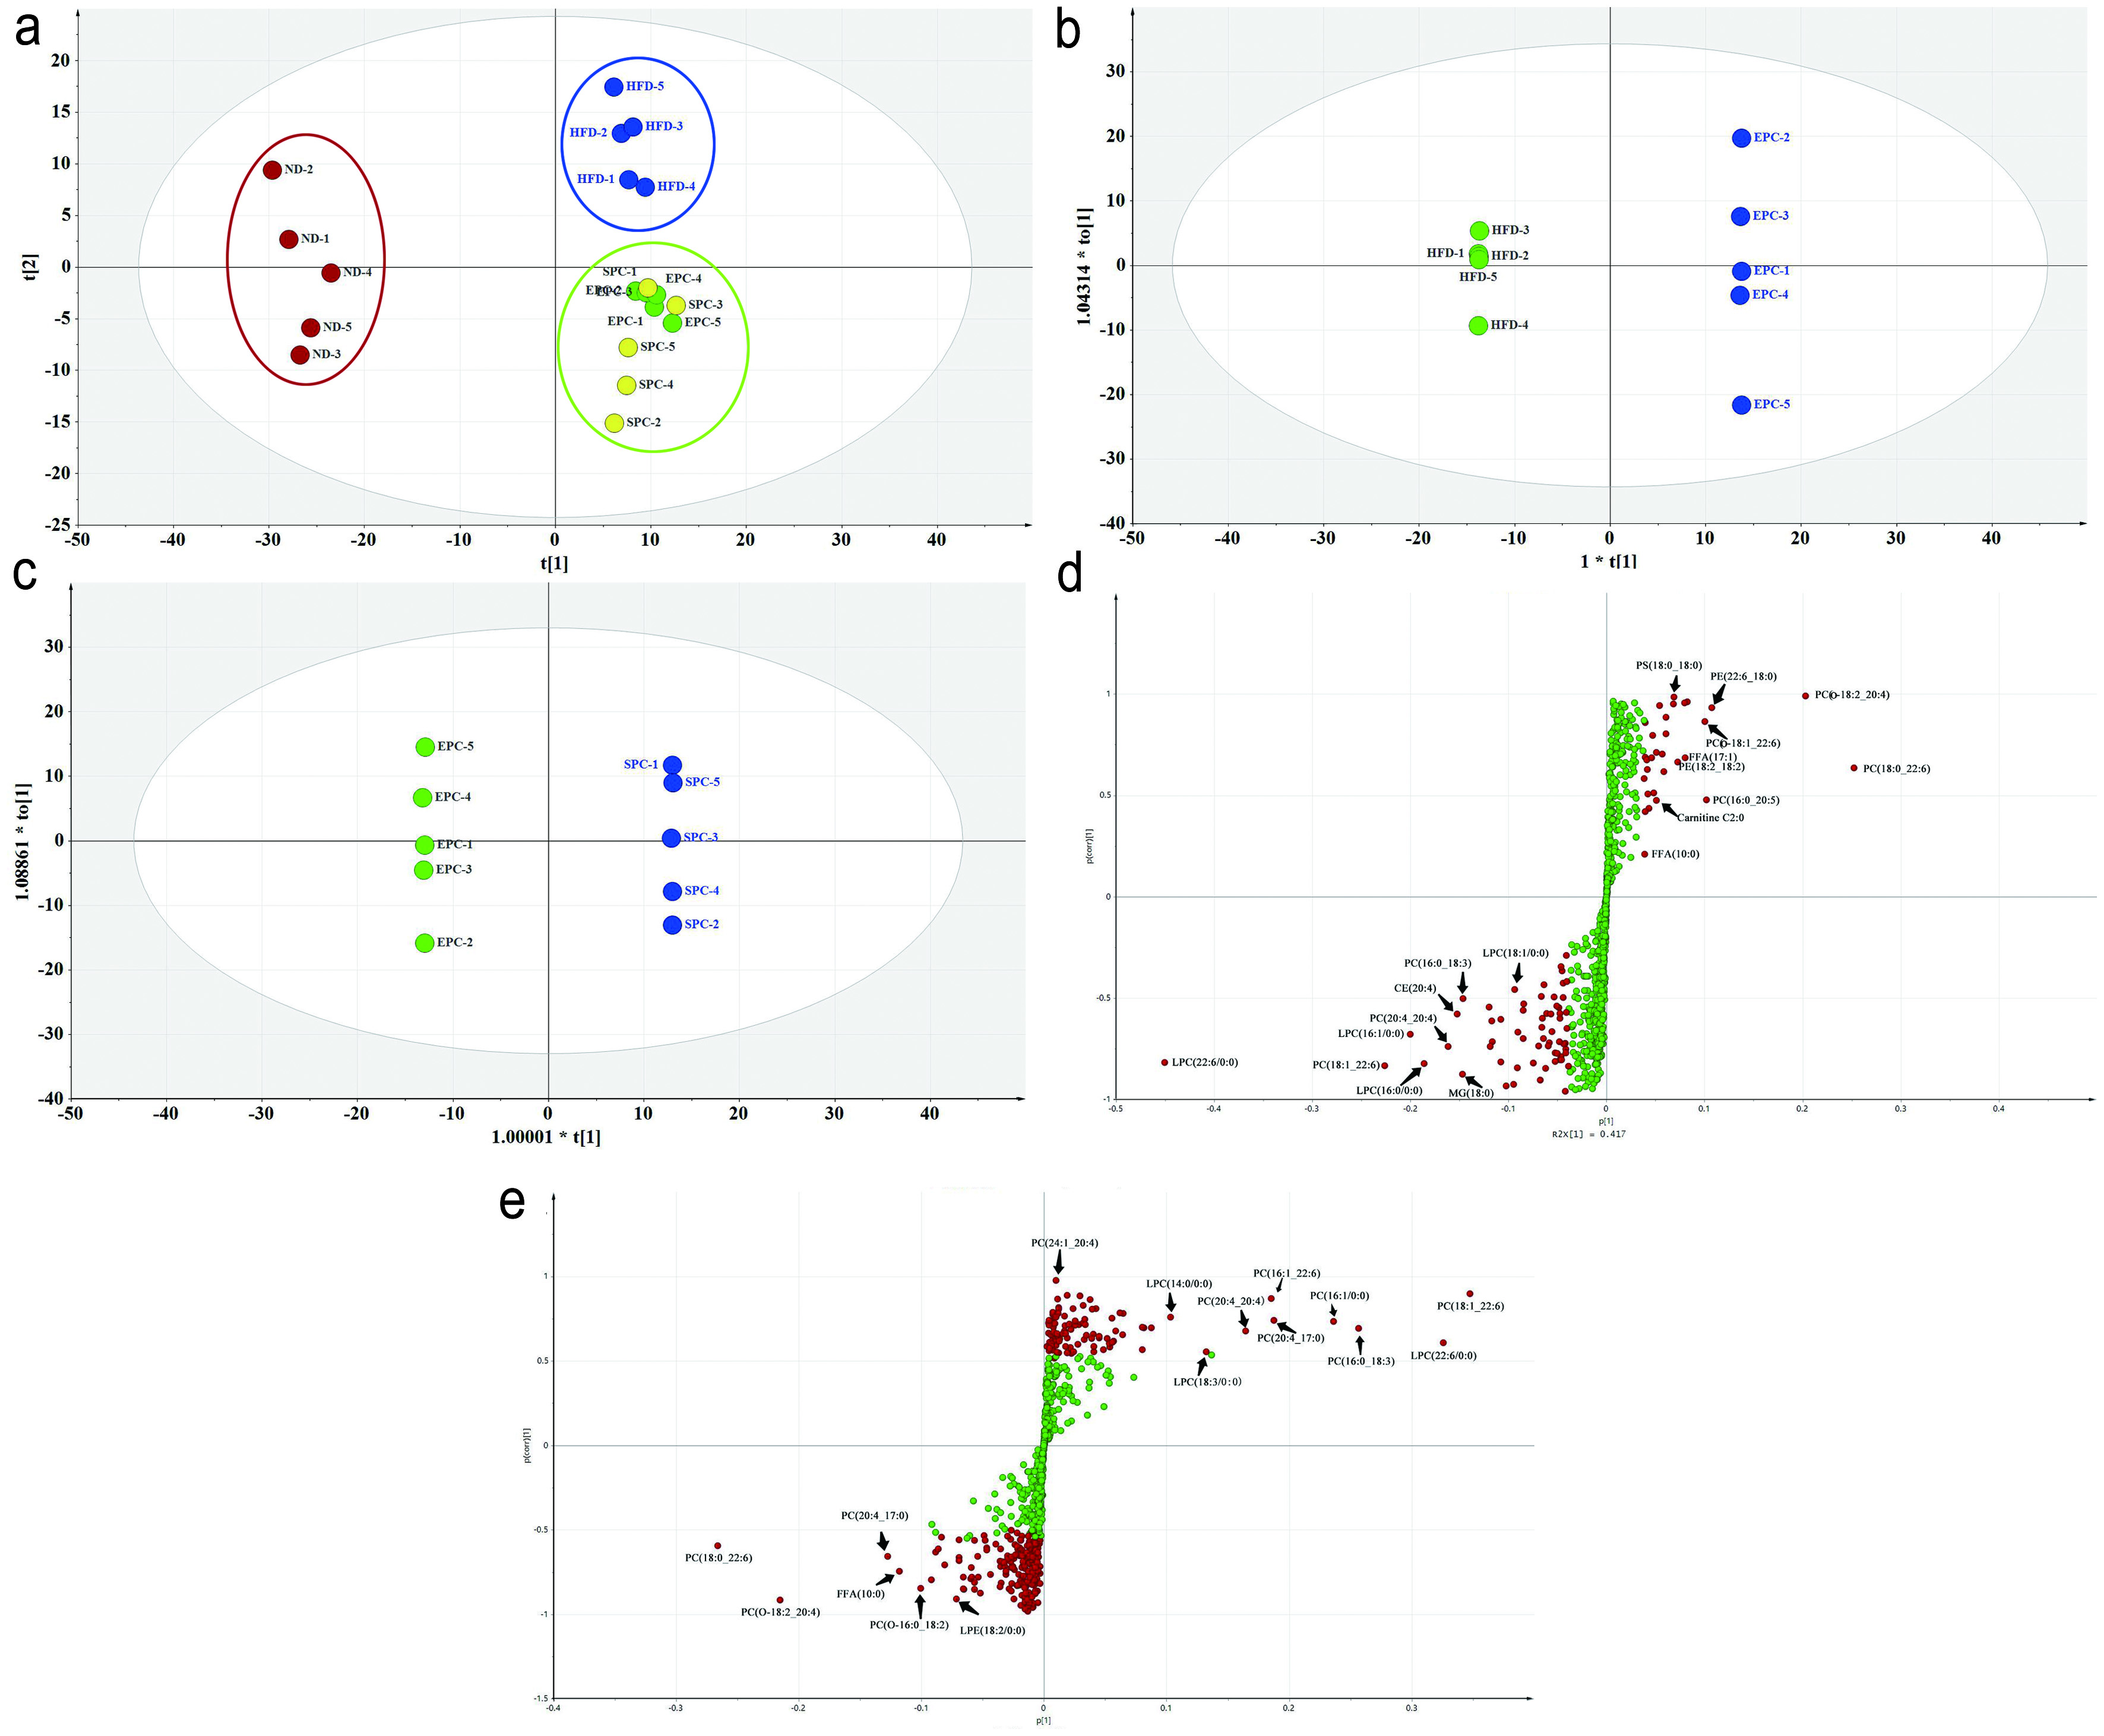
Figure 5. PCA and OPLS-DA of lipid species in serum. (a) PCA score plot; (b) OPLS-DA score plot of HFD vs EPC; (c) OPLS-DA score plot of EPC vs SPC; (d) S-Plot of HFD vs EPC; (e) S-Plot of EPC vs SPC.
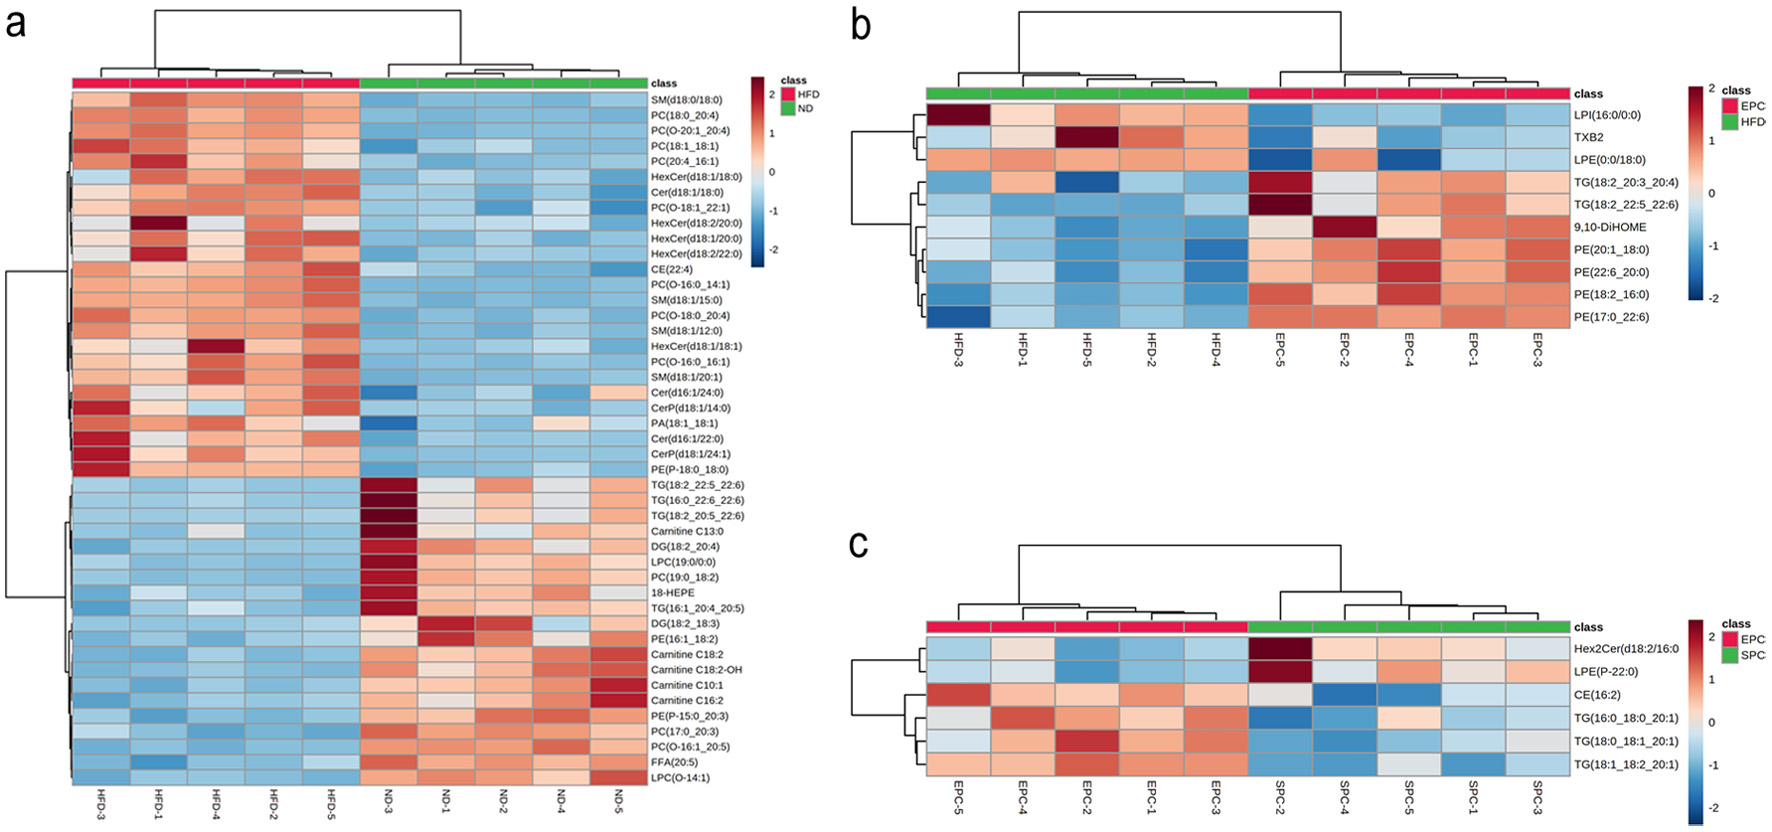
Figure 6. Heat map analysis of serum differential lipid biomarkers in ND vs HFD (a), HFD vs EPC (b), EPC vs SPC (c). Color indicates the changes of selected lipid biomarkers: the dark red color indicates up-regulated lipid biomarkers, while the dark green color indicates down-regulated lipid biomarkers.
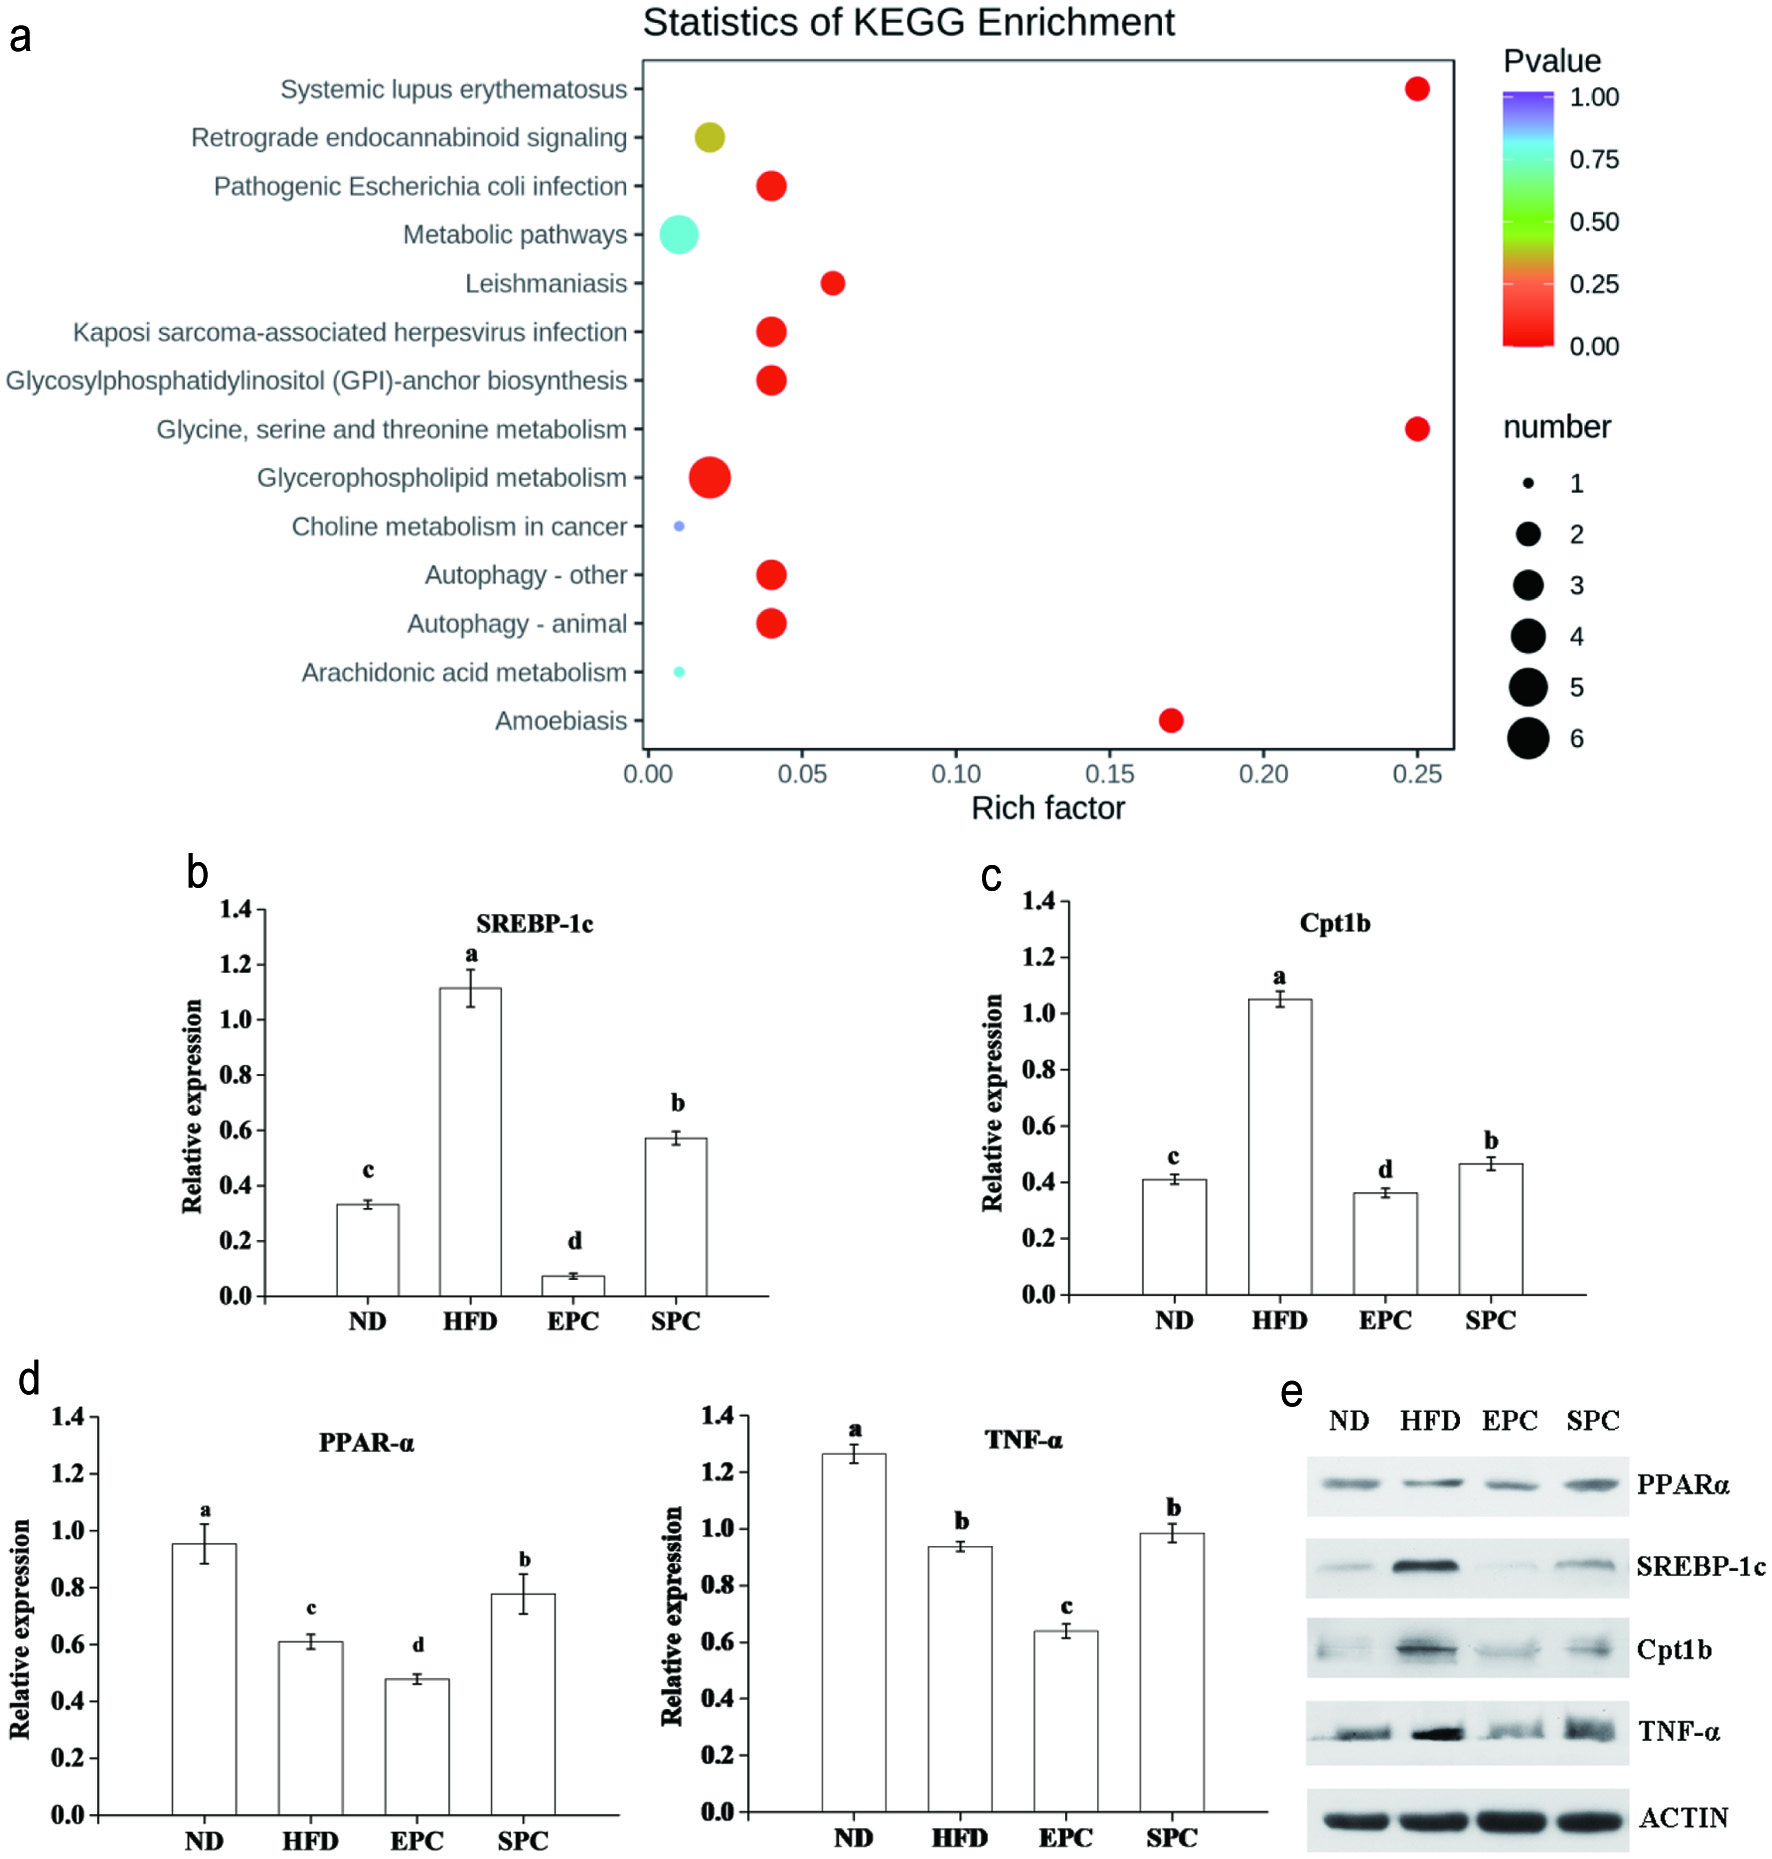
Figure 7. Involved metabolic pathways of the potential biomarkers and expression of related proteins for EPC and SPC treatment. (a) Statistics of KEGG enrichment; (b) sterol-regulatory element binding proteins sterol-regulatory element binding proteins (SREBP-1c); (c) carnitine palmitoyltransferase 1b (Cpt1b); (d) peroxisome proliferator-activated receptor α (PPAR-α); E. tumor necrosis factor-α (TNF-α); F. Representative picture for western blots protein bands.