| Journal of Food Bioactives, ISSN 2637-8752 print, 2637-8779 online |
| Journal website www.isnff-jfb.com |
Original Research
Volume 14, June 2021, pages 102-113
A novel approach to trypsin inhibition by flavonoids
Alejandra I. Martinez-Gonzaleza, Ángel G. Díaz-Sáncheza, Laura A. de la Rosaa, Ismael Bustos-Jaimesb, Emilio Alvarez-Parrillaa, *
aDepartamento de Ciencias Químico Biológicas, Instituto de Ciencias Biomédicas, Universidad Autónoma de Ciudad Juárez, Ciudad Juárez 32310, México
bDepartamento de Bioquímica, Facultad de Medicina, Universidad Nacional Autónoma de México, México D.F. 04510, México
*Corresponding author: Emilio Alvarez-Parrilla, Departamento de Ciencias Químico Biológicas, Instituto de Ciencias Biomédicas, Universidad Autónoma de Ciudad Juárez, Ciudad Juárez 32310, México. E-mail: ealvarez@uacj.mx
DOI: 10.31665/JFB.2021.14272
Received: June 26, 2021
Revised received & accepted: June 30, 2021
| Abstract | ▴Top |
Trypsin is a key protease related to digestion and absorption of proteins, which its inhibition must be studied when natural compounds, such as flavonoids, are used as part of alternative treatments for obesity and diabetes mellitus type 2, since trypsin and other pancreatic enzymes work at small intestine. Considering that flavonoids are good lipase and amylase inhibitors, trypsin-flavonoids interactions were analyzed through UV-Vis, intrinsic and extrinsic fluorescence spectroscopies, circular dichroism, and molecular docking. The interaction between porcine pancreas trypsin and five flavonoids: hesperetin (HES), luteolin (LUT), quercetin (QUE), catechin (CAT), and rutin (RUT) was evaluated. Most of them exhibited a mixed-type inhibition mode. LUT was the best trypsin inhibitor (e.g., lower IC50, 45.20 ± 1.00 µM). All flavonoids-trypsin complexes showed static quenching, and QUE and LUT exhibited higher affinity (associative binding constant, Ka values, 0.90 ± 0.10 and 1.60 ± 0.20·10−1 mM−1, respectively). Hydrophobic interactions between trypsin and flavonoids were predominant.
Keywords: Trypsin; Flavonoids; Inhibition; Structure-activity relationship
| 1. Introduction | ▴Top |
Noncommunicable diseases and their risk factors, such as diabetes mellitus type 2 and obesity, respectively, are being a target of alternative treatments for their control (Chang et al., 2020; Pelvan et al., 2021). In this way, the prevention and treatment of obesity is important to reduce the prevalence of diabetes mellitus type-2 (Liu et al., 2020). One of these treatments is related to the inhibition of catalytic activity of two relevant pancreatic enzymes: lipase and α-amylase. For example, pancreatic lipase inhibitors can diminish its catalytic activity, and can control fat levels in blood, since this enzyme is responsible for the hydrolysis of approximately 70% of dietary fats (Birari and Bhutani, 2007; Liu et al., 2020). Polyphenols including flavonoids have been analyzed as good inhibitors of these enzymes, in comparison to FDA approved drugs such as acarbose for pancreatic α-amylase (Martinez-Gonzalez et al., 2019).
Polyphenols are secondary metabolites of plants, and they are involved in their reproduction, development, and defense against pathogens agents, among others (Huang et al., 2009). Flavonoids correspond to the biggest polyphenolic family. Most of them are derivatives of the 2-phenil-benzo-γ-pyran, they possess a common structure of two aromatic rings (“A” and “B”), and one heterocyclic ring (“C”) (Harborne, 1964; Ribeiro et al., 2015). Flavonoids can be grouped in several subfamilies, depending on the number of hydroxyls present in their structure, presence of double bonds and oxidation level (Gonzales et al., 2015). Among them we have flavanones such as HES, flavones such as LUT, flavonols such as QUE, and flavanols such as CAT (Figure 1). Flavonoids can possess glycosylated groups as substituents of hydroxyl groups, such as RUT with presents a rutinoside group substituent at C3 in QUE (Figure 1).
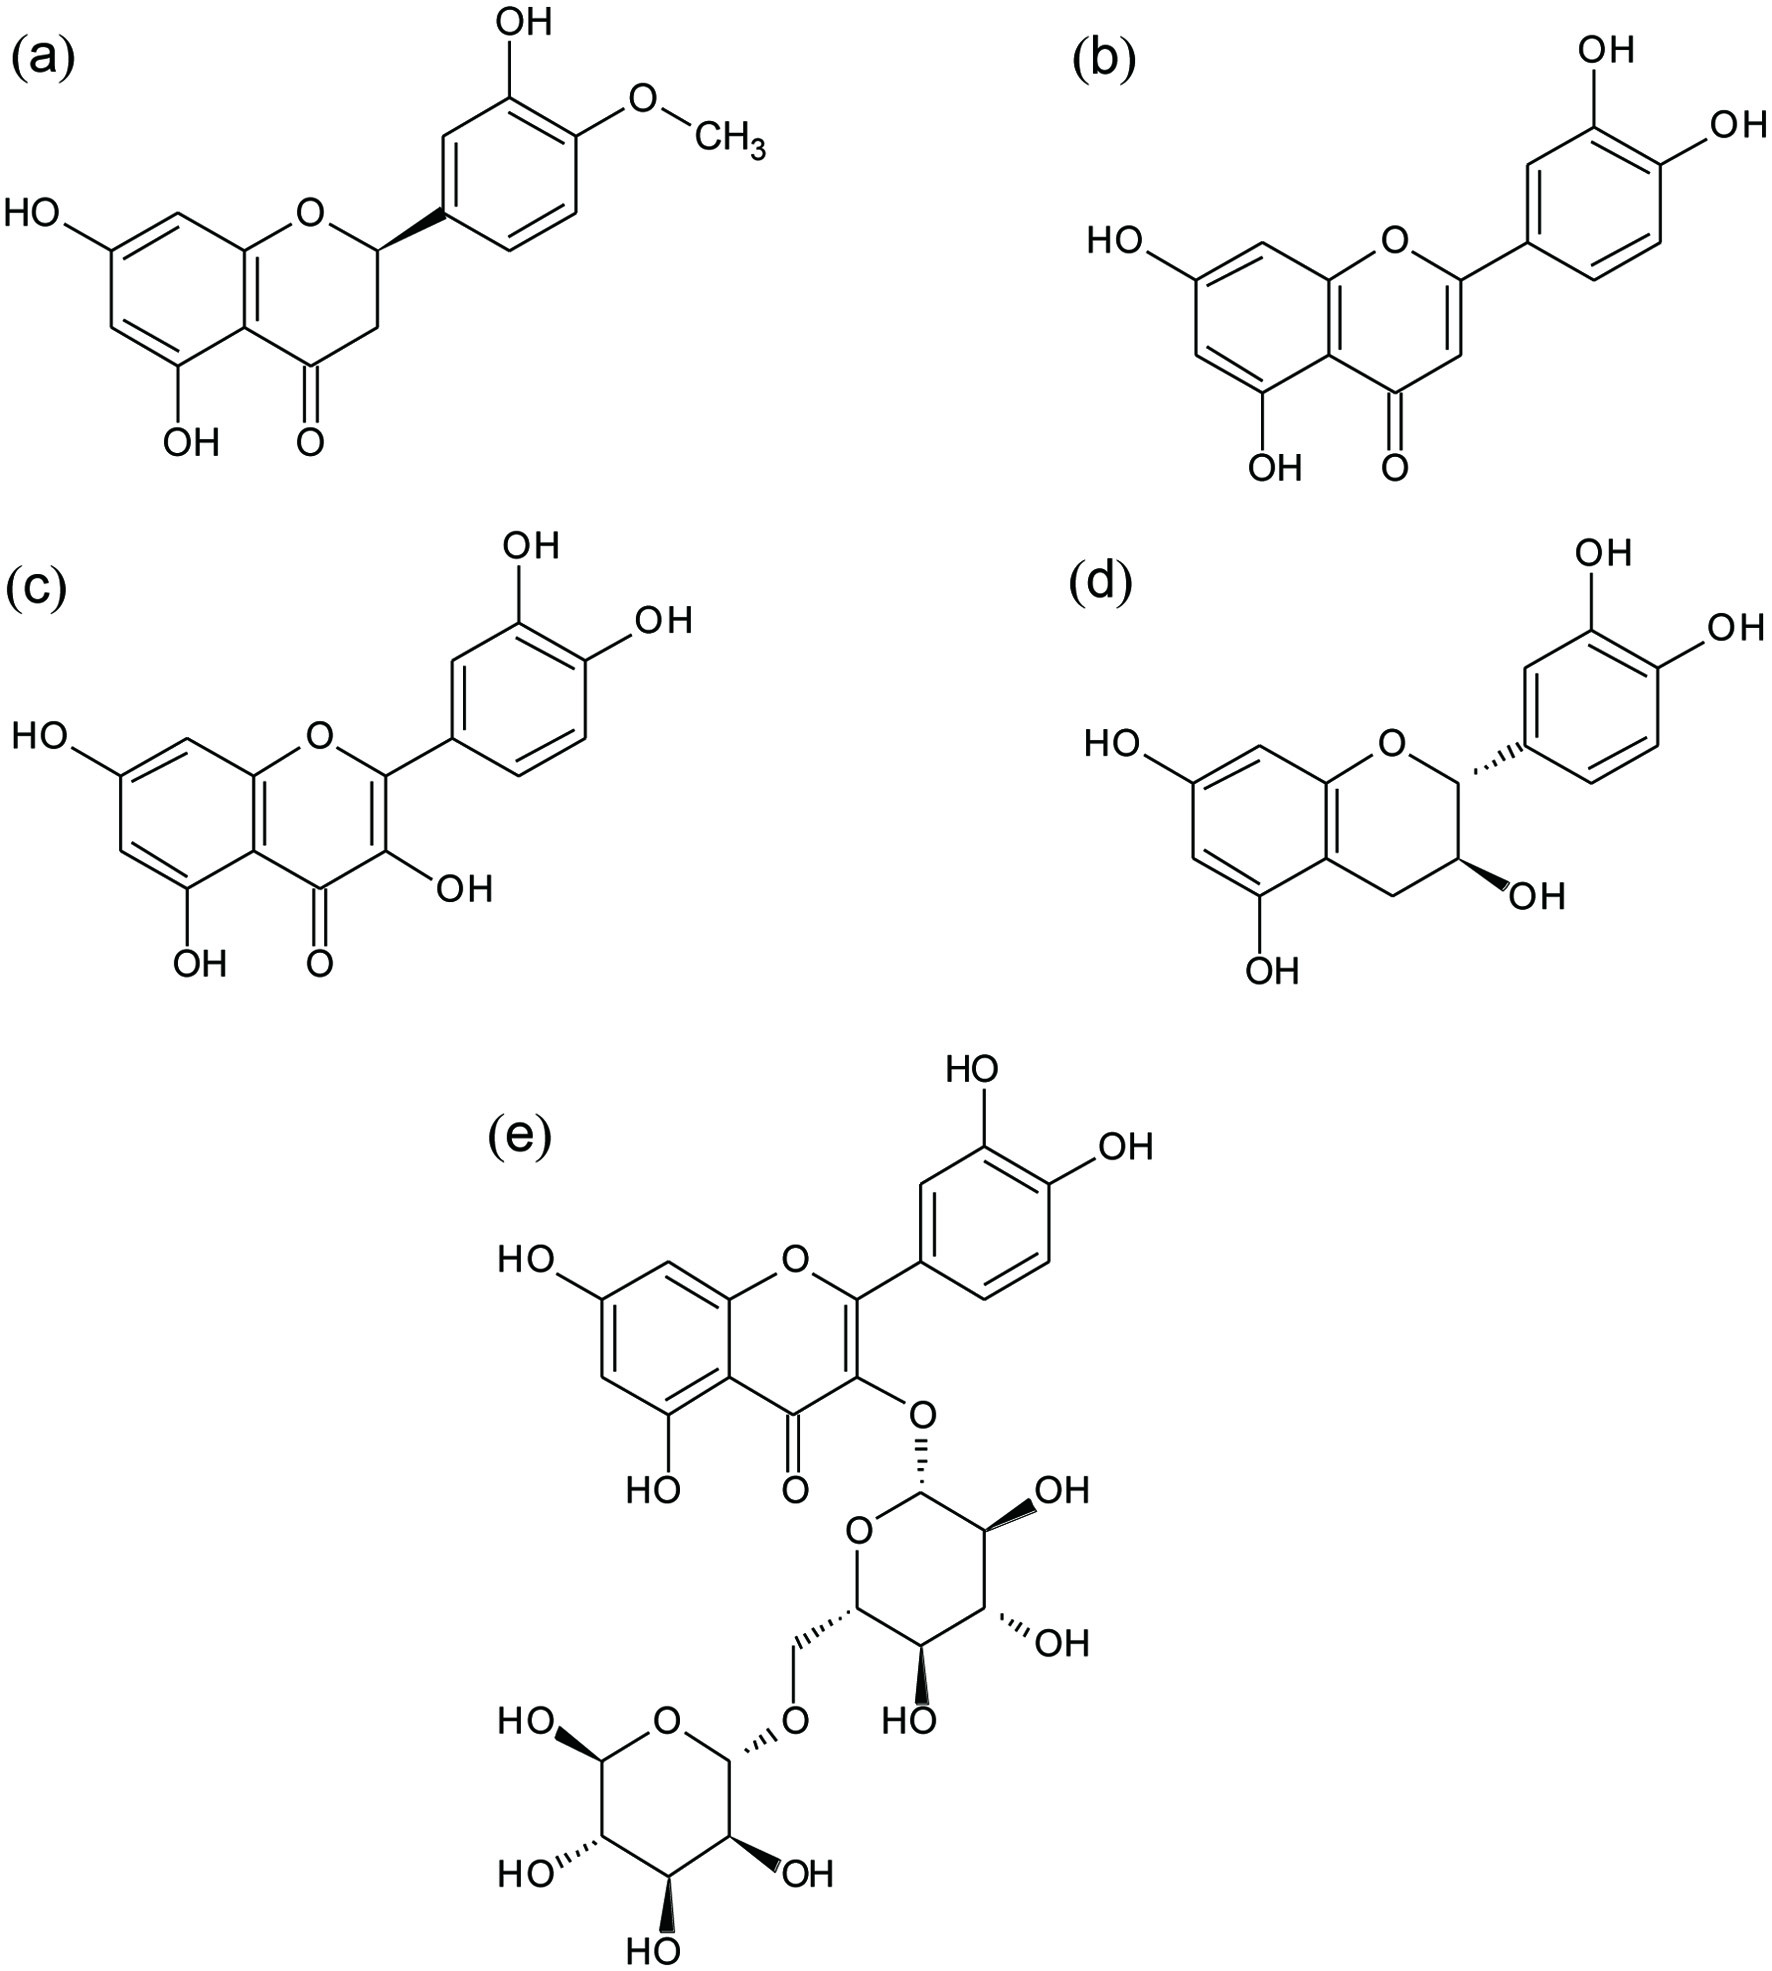 Click for large image | Figure 1. Chemical structures of evaluated flavonoids: (a) Hesperetin (HES), (b) luteolin (LUT), (c) quercetin (QUE), (d) catechin (CAT), and (e) rutin (RUT). |
Together with lipase and α-amylase, trypsin is produced by pancreas, and located at small intestine (Unajak et al., 2012). Trypsin is an enzyme of approximately 24 kDa within 231 amino-acid residues, mainly with β-sheet structures (Ibarz et al., 2009; Maximova and Trylska, 2015). It is one of the main proteases that catalyzes the hydrolysis of peptides and ester bonds on L-Lys and L-Arg; it possesses a catalytic triad (His57-Asp102-Ser195) within one subsite (Asp189), located inside of a pocket called S1, to make possible a salt bridge with the positively charged group from these amino acids residues (L-Lys and L-Arg); and it contains a Calcium ion (Ca2+) to stabilize the structure (Ibarz et al., 2009; Ma et al., 2005). Trypsin is synthetized as a zymogen with a molecular weight of 24.1–24.7 kDa (Kay et al., 1961), and it is stored separately from the rest of the pancreatic products, until it is released into the pancreatic duct that carries them to the duodenum (Rawn, 1989).
The inhibitory effect of flavonoids on trypsin has not been completely studied (Li et al., 2014; Maliar et al., 2004). There are some studies about the interactions between trypsin and polyphenols (Wu et al., 2013; Xiao et al., 2015), and only few once on the trypsin-flavonoids interactions (Li et al., 2014; Maliar et al., 2004). Authors mainly calculated inhibition percentages or IC50, observing that QUE, LUT and apigenin had presented 46%, 33% and 27% inhibition percentages, respectively (Li et al., 2014). However, the structure-activity relationship (SAR) of trypsin-flavonoids interactions behind these inhibitions has not been fully elucidated. Only some structural features were explained, such as flavanones had been pointed out as less effective trypsin inhibitors (Maliar et al., 2004). Trypsin inhibitory studies by polyphenolics compounds have been carried out together with pancreatic lipase or glucosidase inhibitory studies, in order to evaluate the possible antinutritional properties of these compounds (Xiao et al., 2015). Considering that previous studies have shown that flavonoids are good lipase and α-amylase inhibitors (Martinez-Gonzalez et al., 2019; Martinez-Gonzalez et al., 2020), in the present study, different flavonoids will be tested as trypsin inhibitors, to determine which structural features favors trypsin inhibition by flavonoid. For this, the effect of flavonoids on trypsin catalytic activity, intrinsic fluorescence, ANS-trypsin complex extrinsic fluorescence of trypsin-ANS, circular dichroism and molecular docking will be carried out to evaluate the SAR of trypsin-flavonoids interactions.
| 2. Materials and methods | ▴Top |
2.1. Samples and reagents
Pancreatic porcine trypsin (EC 3.4.21.4), and its chromophore substrate, Nα-benzoil-DL-arginine p-nitroanilide (BAPNA) were purchased from Sigma-Aldrich (Merck, Germany). Chloride acid, sodium hydroxide, bovine serum albumin (BSA), Bradford reagent, p-nitroaniline, sodium acetate, sulfoxide dimethyl (DMSO), ANS, monobasic sodium phosphate (KH2PO4), dibasic sodium phosphate (K2HPO4), sodium chloride (NaCl), imidazole, acrylamide, bis-acrylamide, sodium sulphate dodecyl (SDS), ammonium persulphate (PSA), 2-mercaptoethanol, Coomassie blue G250, N,N,N′,N′-tetramethylethylendiamine (TEMED), Tris, the flavonoids (HES, LUT, CAT, QUE and RUT) were also from Sigma-Aldrich. Methanol and Ethanol were purchased from J.T. BakerTM (Thermo Fisher Scientific, Spain). The Broad Range Protein Ladder was purchased from Thermo ScientificTM (Spain). All chemicals were of analytical-reagent grade.
2.2. Enzymatic solution preparation
Trypsin purification process was carried on a SuperdexMR 75 size exclusion column (Sigma-Aldrich, Germany), using phosphate buffer solution (20 mM, NaCl 150 mM, pH 7.0). Proteolytic activity fractions were concentrated through an Amicon Ultra-0.5 mL centrifugal filters (Millipore, USA), and purity was calculated to be 99% (data not shown). All employed solutions (enzymatic, flavonoids, ANS and buffer) were separately filtered through a 0.45 µm DuraporeTM filter before each assay.
2.3. Trypsin activity assay
Trypsin proteolytic activity was assayed through UV-Visible microplate spectroscopy according to (Orona-Tamayo et al., 2013; Unajak et al., 2012) with some modifications. 0.5 mg/mL trypsin solution (dissolved in Tris buffer, 50 mM, pH 8.0). The substrate, BAPNA, was dissolved (0.1–1.0 mM) in DMSO. The p-nitroaniline absorbance produced by trypsin hydrolytic activity on BAPNA was monitored at 410 nm during 2 min at 37 °C in a UV/Vis microplate spectrophotometer (Bio-Rad xMarkTM, USA). The trypsin activity assay duration was determined from a stability assay for the enzymatic solution (data not shown).
Control assay contained trypsin solution, distilled water, buffer solution, and BAPNA solution in a final volume of 250 µL. The BAPNA solution was added to start the reaction. For inhibition studies, different concentrations (1–50 µM) of each flavonoid (HES, LUT, CAT, and RUT) dissolved in methanol, except QUE which was dissolved in ethanol were added prior to the addition of BAPNA. Inhibition percentage was calculated from endpoint absorbance values, and IC50 was calculated from an inhibitor concentration versus inhibition percentage plot (Martinez-Gonzalez et al., 2019). All samples were assayed by triplicate.
The apparent catalytic parameters, maximal reaction rate (Vmax) and Michaelis-Menten constant (KM) were calculated by both non-linear (Michaelis-Menten) and linear (Lineweaver-Burk) analyses to obtain Ki according to (Martinez-Gonzalez et al., 2019). The non-linear analysis was performed at GraphPad Prism v. 6.0 using Equation 1.
The linear analysis was performed with Equation 2 as follows:
Ki and Ki′ (dissociation constant for free enzyme and enzyme-substrate complex, respectively) values for a mixed-type inhibition were obtained from for mixed-type inhibition) Equations 3 and 4 (Tipton, 1996).
2.4. Enzyme-flavonoid interaction measured by intrinsic fluorescence spectroscopy
The quenching effect of the flavonoids (HES, LUT, QUE, CAT and RUT) on trypsin intrinsic fluorescence intensity was assayed as previously described with some modifications (Li et al., 2014; Zeng et al., 2015). The trypsin (0.2 mg/mL) intrinsic fluorescence (Trp) intensity changes were performed in an ISS-PC1TM spectrofluorometer (Horiba Scientific®, Japan). Phosphate buffer (20 mM, pH 7.0) was employed for enzymatic and flavonoids solution. Flavonoid solutions (0–100 µM) were added, and fluorescence intensity changes were measured after 1-hour incubation at 37 °C, when the sample was excited at 290 nm, and the fluorescence emission was recorded from 300 to 700 nm, with 10 nm Entrance/Exit slits (Li et al., 2011). The maximum fluorescence emission was reached at 340 nm. All samples were assayed by triplicate. The flavonoids did not exhibit FRET at that excitation wavelength.
Fluorescence intensity changes were plotted against the flavonoid concentrations and fitted to Equation 5 as follows:
The fluorescence quenching parameters were calculated from the linear Stern-Volmer Equation 6 (Lakowicz, 1999) as follows:
A modification (Equation 7) of Stern-Volmer equation (Equation 6) was used to estimate the apparent values of the associative binding constant (Ka) of the enzyme-flavonoid complex, and the number of binding sites per protein (n) (Lakowicz, 1999).
2.5. Binding of flavonoids to enzyme by extrinsic fluorescence of ANS
The fluorescence intensity changes of trypsin-ANS complex were recorded according to (Sun et al., 2017) with some modifications. The assay was carried on in absence and presence of flavonoids (HES, LUT, QUE, CAT and RUT). The final concentrations of trypsin and ANS solutions, both dissolved in phosphate buffer (20 mM, pH 7.0), were 0.05 mg/mL and 150 µM, respectively. Sample were incubated 15 min at 37 °C, in the presence and absence of flavonoids (1–300 µM), and fluorescence measured at 380 nm excitation wavelength, and the fluorescence emission was recorded from 400 to 700 nm (monitored at 519 nm). The extrinsic fluorescence measurements were performed in a Shimadzu RF-5301 spectrofluorometer (USA) into a 1 cm path-length quartz cuvette. All samples were assayed by triplicate. The flavonoids did not exhibit FRET at that excitation wavelength. Values of apparent dissociation constant (KD) were calculated from Equation 5.
2.6. Binding of flavonoids to trypsin by circular dichroism
Circular dichroism spectra (CD) of trypsin in absence and presence of flavonoids (HES, LUT, QUE, CAT and RUT) were recorded according to (Zhang et al., 2013) with some modifications. The assay was performed on a JASCO® J-815 spectropolarimeter (Japan). Final concentration of enzymatic solution dissolved in phosphate buffer (20 mM, pH 7.0) was 1 µM, while flavonoids final concentrations were 1–100 µM. Measurements were performed in the near-UV region (300–450 nm), into a 1 cm path-length quartz cuvette. Ellipticity was recorded at a speed of 100 nm/min, 0.2 nm resolution, 11 accumulations, and 1.0 nm bandwidth. A control experiment with solvent at same volume was carried on and subtracted from the raw spectra. All samples were assayed by triplicate. Values of apparent dissociation constant (KD) were calculated from Equation 5.
2.7. Trypsin-flavonoids interactions by molecular docking
The analyses of possible interactions between trypsin and flavonoids (HES, LUT, QUE, CAT and RUT) were carried on according to literature with some modifications (Martinez-Gonzalez et al., 2019; Zeng et al., 2015). The three-dimension structure of trypsin was obtained from Protein Data Bank (code 1S18) and used as template. Flavonoid structures were generated and minimized using PyMOL software v. 1.3 (Schrodinger® USA). Automated molecular docking studies of the flavonoid and the trypsin were performed with AutoDock Vina using the interphase installed in USCF-Chimera v. 4 (Regents of the University of California, USA) run with the default parameters and a search volume of approximate the same size as enzyme. The three-dimensional structure of the enzyme was considered rigid, and the ligands structures were considered flexible during the performance. According to the scores and binding energy value (herein refers to ΔG value), the best pose for each flavonoid was obtained and analyzed. The best pose was also chosen by its root mean square deviation value (RMSD). Non-covalent interactions, such as Hydrogen bonding, were determined from analysis of the two atoms involved in it, their spatial positions, and distance between them.
2.8. Statistical analysis
All the experimental assays were run in triplicates. Results are expressed as mean values ± standard deviation. Analysis of variance and Fisher’s least significant difference analysis were performed by SPSS v. 20 software (IBM® USA) for the determination of statistically significant differences between treatments with a level of significance of 0.05.
| 3.. Results and discussion | ▴Top |
3.1. Inhibition of trypsin activity
The inhibitory capacity of flavonoids against trypsin activity are shown in Table 1. Kinetic parameters were calculated by linear (data not shown) and non-linear analyzes at three flavonoid concentrations, and inhibition pattern studies. IC50 values were also calculated, where LUT showed the lowest value (37.60 ± 0.50 µM), followed by QUE, RUT and HES (45.20 ± 1.00, 48.10 ± 1.80 and 60.50 ± 2.40 µM, respectively). The flavone LUT was observed to have the highest inhibition, while the flavan-3-ol CAT did not show any trypsin inhibition. When the inhibitory activity of QUE and RUT where compared, no effect of glycosylation was observed. The activity of RUT against trypsin has not been previously reported, but the activity of flavonoids such as QUE and apigenin has been compared (Li et al., 2014). Greater inhibitory activity was related to a larger number of hydroxyl groups (three) in the B and C rings of QUE, compared to the number of these groups in apigenin (one). Hydroxyl groups at the C3′ and C4′ positions of QUE were indicated as essential for trypsin inhibition (Li et al., 2014).
 Click to view | Table 1. Trypsin apparent catalytic parameters (V appmax, KappM, Ki and Ki′) and inhibition type for the hydrolysis of BAPNA in the presence of the flavonoids |
LUT and QUE showed the highest inhibitory capacity against trypsin. Apparently, the hydroxylation at the C3 position decreases the inhibitory activity of QUE with respect to LUT. The presence of this group in QUE could hinder the planar C ring structure for inhibition, as observed for α-amylase and lipase activity (Martinez-Gonzalez, et al., 2019, 2020), and a yeast α-glucosidase (Tadera et al., 2006). The substitution of a hydroxyl for carbohydrate in C3 for RUT could be related to its higher IC50 value compared to QUE. This substitution causes an increase in the polarity and molecular size of the flavonoid, and a steric hindrance is generated for its interaction with the protein (Gonzales et al., 2015).
The apparent catalytic parameters (Vappmax and KappM) are also reported in Table 1. All flavonoids, except CAT (which did not inhibit trypsin) showed mixed inhibition type. Flavanols such as CAT have been reported as ligands with low inhibitory activity, probably because they only interact with enzymes in the presence of substrate, as uncompetitive inhibitors (Tadera et al., 2006).
The mixed inhibition constants values, Ki and Ki′ (Table 1) indicate that all flavonoids, (except CAT), behaves mainly as competitive inhibitors, showing greater preference for the free enzyme than for the enzyme-substrate (ES) complex. This same mixed inhibition pattern for trypsin, has been observed for phenolic compounds such as tannic acid (Xiao et al., 2015). More studies are required on the inhibition pattern of phenolic compounds, since non-competitive inhibitions have also been reported (Wu et al., 2013). Phenolic compounds that inhibit trypsin activity can interact with the same substrate binding site. This agrees with the lack of significant changes (p < 0.05) for the Hill coefficient (h) value in the presence of flavonoids. The lower trypsin inhibitory capacity of HES can be explained by the lack of the double bond in C2-C3, and the presence of the methoxy group at the C3′ position instead of a hydroxyl group. Moreover, the effects of QUE and LUT on trypsin are less than those observed with other enzymes such as α-amylase and lipase (lower Ki values), and this can be attributed to the larger size (higher molecular weight) of these enzymes, compared to trypsin, and therefore more interactions could occur (He et al., 2006; Xiao et al., 2015). More studies are required to clarify whether the differential inhibitory power of flavonoids on digestive enzymes would be mainly related to the size of the protein.
3.2. Enzyme-flavonoid interaction analysis by intrinsic fluorescence spectroscopy
The intrinsic fluorescence associated with the four Trp residues of the enzyme was monitored. The effect of the presence of flavonoids at different concentrations (3–100 µM) is shown in Figure 2a–e. Corrections were made to eliminate internal filter effects. A quenching effect was observed at the maximum fluorescence emission intensity (FI) recorded for trypsin (329 nm), in the presence of all flavonoids. The greatest effect was observed for LUT and QUE, followed by RUT and HES. Trypsin fluorescence quenching has been reported for QUE and other flavonoids such as apigenin (Li et al., 2014). HES showed a large bathochromic effect (Figure 2a, from 329 to 350 nm). This bathochromic effect may be due to a change in the polarity of the environment surrounding the Trp in the presence of HES, which may leave them exposed, and could be related to a deployment of the polypeptide chain (Wu et al., 2013; Wu et al., 2011). The bathochromic shift is also related to an unfolding of the protein structure that covers the indole group of Trp (Lakowicz, 1999).
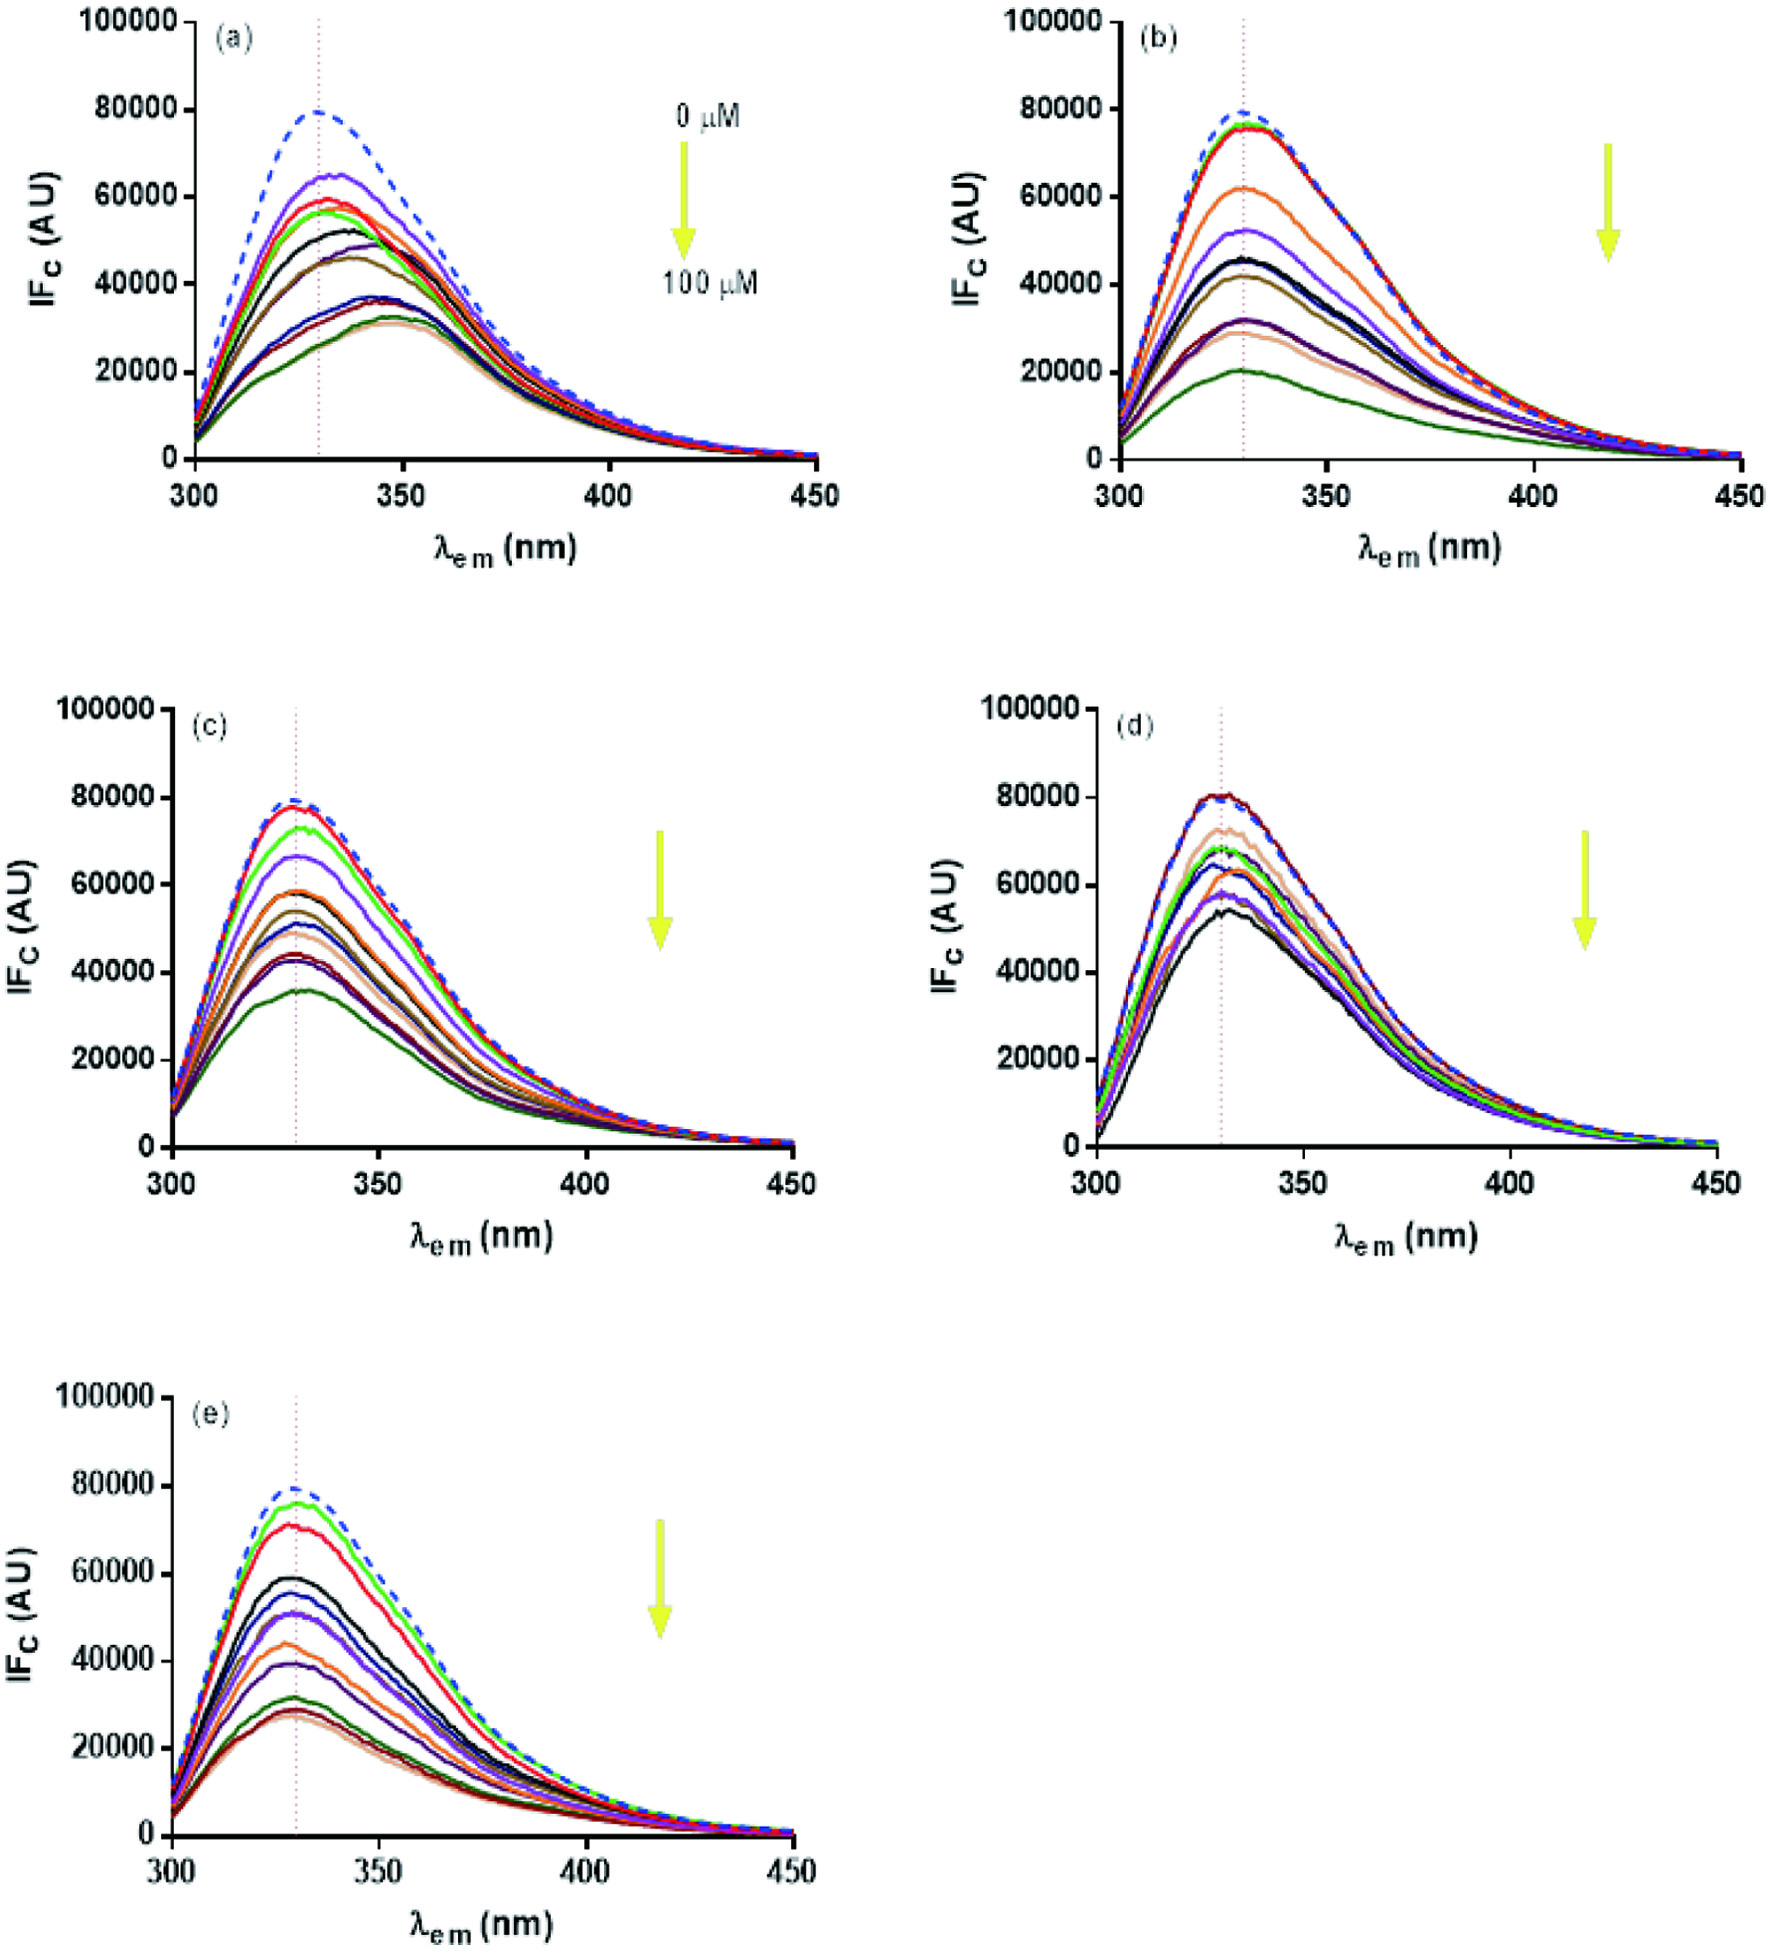 Click for large image | Figure 2. Quenching of intrinsic trypsin fluorescence in the presence of different concentrations of flavonoids (3.0–100.0 µM). (a) HES, (b) LUT, (c) QUE, (d) CAT, and (e) RUT. Fluorescence was recorded after 60 min of incubation with the flavonoid, at an excitation wavelength of 290 nm. Data represent the average of three experimental replicates. |
The FI values were adjusted by non-linear (Equation 5) and linear (Equations 6 and 7) analysis to calculate the KD, Ksv, kq, n and Ka values, and results are shown in Table 2. Only for kq and Ka, the differences between LUT values, compared to the rest of the flavonoids were remarkable. CAT presented lower trypsin fluorescence quenching effect, in agreement with its null inhibitory activity. In the case of KD value (Table 2) LUT and QUE showed the lowest values (p < 0.05). Both flavonoids have the highest affinity for the enzyme, which agrees with their highest Ka values, and with their high enzymatic inhibitory activity. QUE results are in agreement with those previously published, where authors attributed its high affinity to the ability of the hydroxyl groups in B ring to interact with trypsin moieties (Li et al., 2014) similar to those observed for catechol structures (Gonzales et al., 2015).
Click to view | Table 2. Fluorescence quenching parameters (KappD, Ksv, kq, n and Ka) of trypsin in the presence of flavonoids |
LUT had significantly higher Ksv and kq values compare to the other flavonoids (Table 2). Higher Ksv values correspond to thermodynamically more spontaneous enzyme-ligand interactions, and to higher affinity (Zhang et al., 2013). After LUT, QUE and HES, showed similar results, followed by RUT. HES presented Ksv values like those of QUE, but their affinity (Ka and KD) was smaller. The kq values for all flavonoids indicated a static quenching mechanism, that is, there is a formation of a non-fluorescent enzyme-flavonoid complex.
The calculated n values (Table 2) for all flavonoids indicate approximately one binding site per trypsin, in agreement with the calculated Hill coefficient value for catalytic enzyme activity assays. QUE and HES ligands did not show significant differences between them for the value of n. Greater flexibility of the B ring in flavonoids, such as HES, is associated with less interaction with enzymes (Lo Piparo et al., 2008). HES interacted with the enzyme in a manner comparable to QUE, but this interaction could be affected by its flexibility. In the case of RUT, the presence of glycosylation prevents interaction with the enzyme (Costamagna et al., 2016) comparable to that of LUT.
3.3. Enzyme-flavonoid binding by extrinsic fluorescence spectroscopy
The change on fluorescence emission of the ANS-trypsin complex was analyzed in the presence of flavonoids, after eliminating the effects of the internal filter (corrected FI or FIc) (Figure 3). QUE exhibited the greatest decrease in FI of the ANS-trypsin complex, followed by RUT and LUT (Figure 3c, e and b, respectively). These results indicate that flavonoids and ANS compete for the same binding site in the enzyme. HES and CAT (Figure 3a and d, respectively) showed an FI increase of the ANS-trypsin complex, indicating that both flavonoids interact with the enzyme in a different site respect to ANS. These results were similar to those reported for the interactions of the same flavonoids with the ANS-α-amylase complex (Martinez-Gonzalez et al., 2019). QUE showed the greatest effect on the stability of the enzyme-ANS complex, competing with ANS for the same binding site (Halim et al., 2017). The calculated KD (Equation 5) values for QUE, RUT, and LUT were 126.10 ± 10.05, 61.70 ± 3.20, and 30.90 ± 2.80 µM, respectively. The large difference on KD values observed for QUE and RUT, can be attributed to the glycosylation at C3 (RUT), in agreement with Wu et al. Wu et al., (2013). The extra hydroxyl group of QUE, compared to LUT, gives it a greater ability to interact with the enzyme. The low quenching effect of LUT over the ANS-trypsin complex, may be explained considering the flat structure of B ring, which allows it to easily interacts with its binding site, without obstructing the binding of ANS to the enzyme (Tadera et al., 2006; Wu et al., 2013).
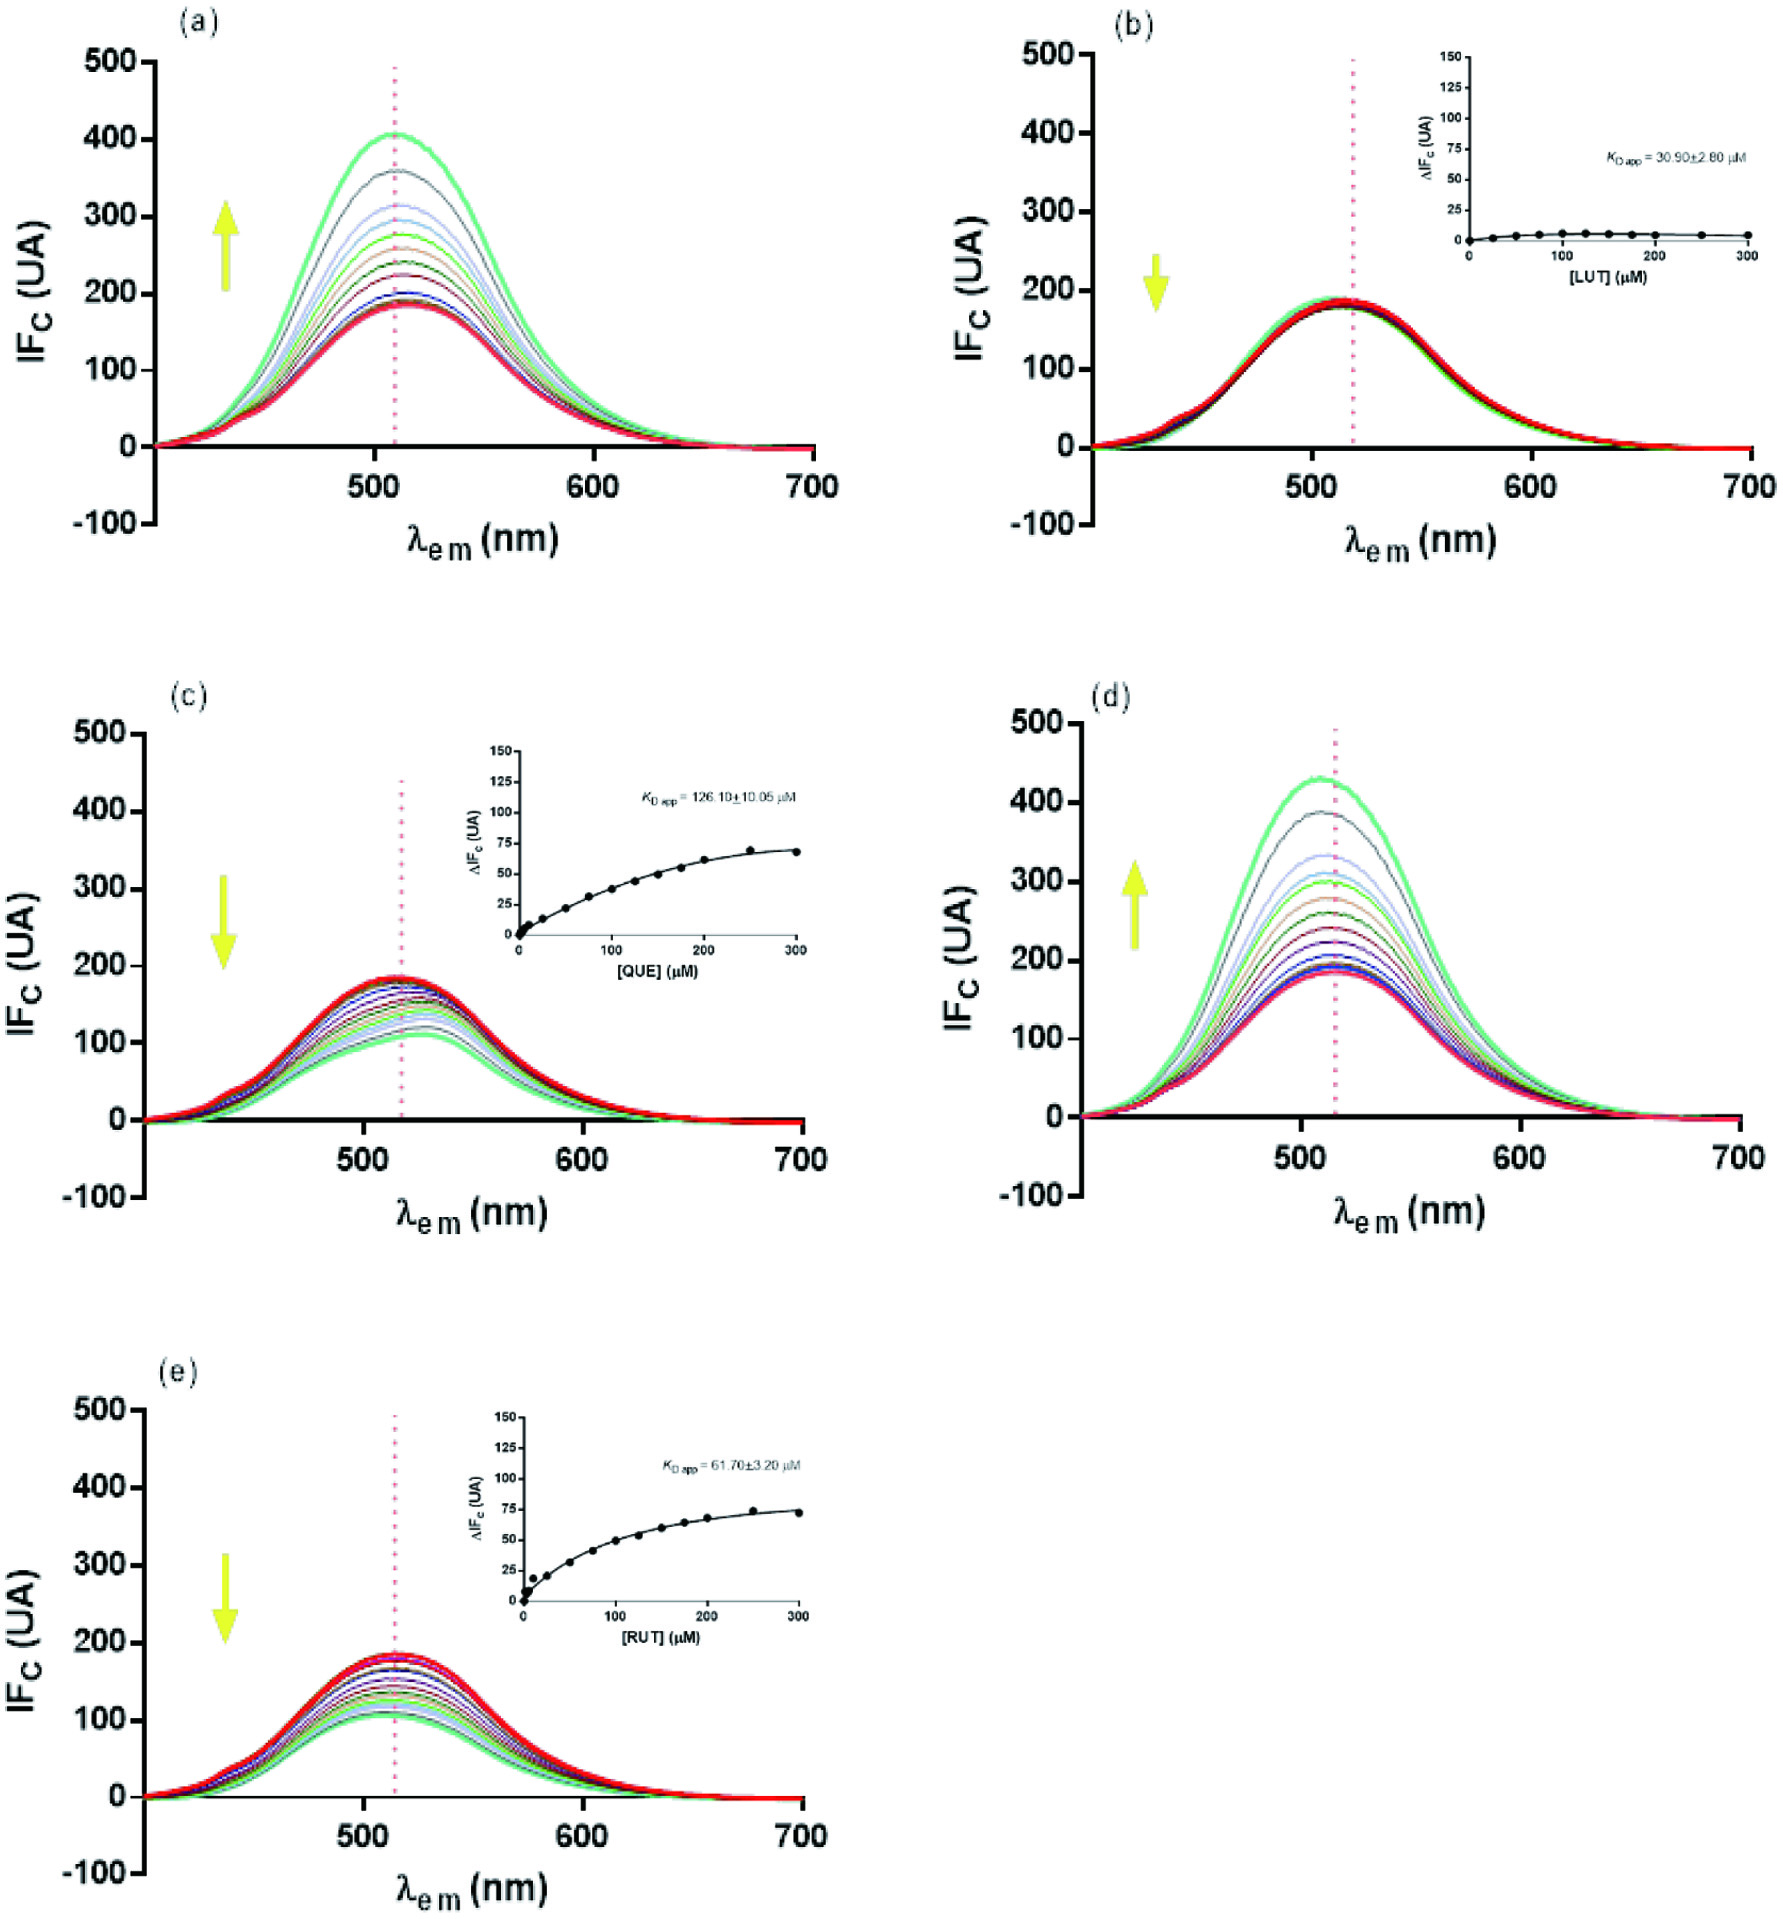 Click for large image | Figure 3. Fluorescence spectra of trypsin-ANS complex in the absence and presence of different concentrations (up to 300 µM) of flavonoids: (a) HES, (b) LUT, (c) QUE, (d) CAT, and (e) RUT. Insert shows plot of flavonoid concentration (mM) versus corrected fluorescence intensity change DF. Samples were excited at a wavelength of 290 nm. Yellow arrows indicate the trend of fluorescence change as the concentration of flavonoids increases. |
3.4. Binding between enzyme and flavonoid by circular dichroism
The absorption spectra (near UV) of trypsin were analyzed in the presence of the flavonoids, HES, LUT, QUE, CAT and RUT (Figure 4). Maximum ellipticity values for trypsin are observed at 270 and 290 nm. HES and RUT (Figure 4a and e, respectively) showed the greatest effect over the Trp moieties at 290 nm. No effect of LUT, and CAT over the CD absorption spectra of trypsin were observed (Figure 4b–d, respectively). The lack of DC activity of LUT agrees with the little effect observed in the far-UV region for the interaction between LUT and BSA (Yang et al., 2008), or in the near-UV for the interaction between type B DNA and LUT (Bhuiya et al., 2019). More studies are required to explain this lack of observed interactions between LUT and trypsin.
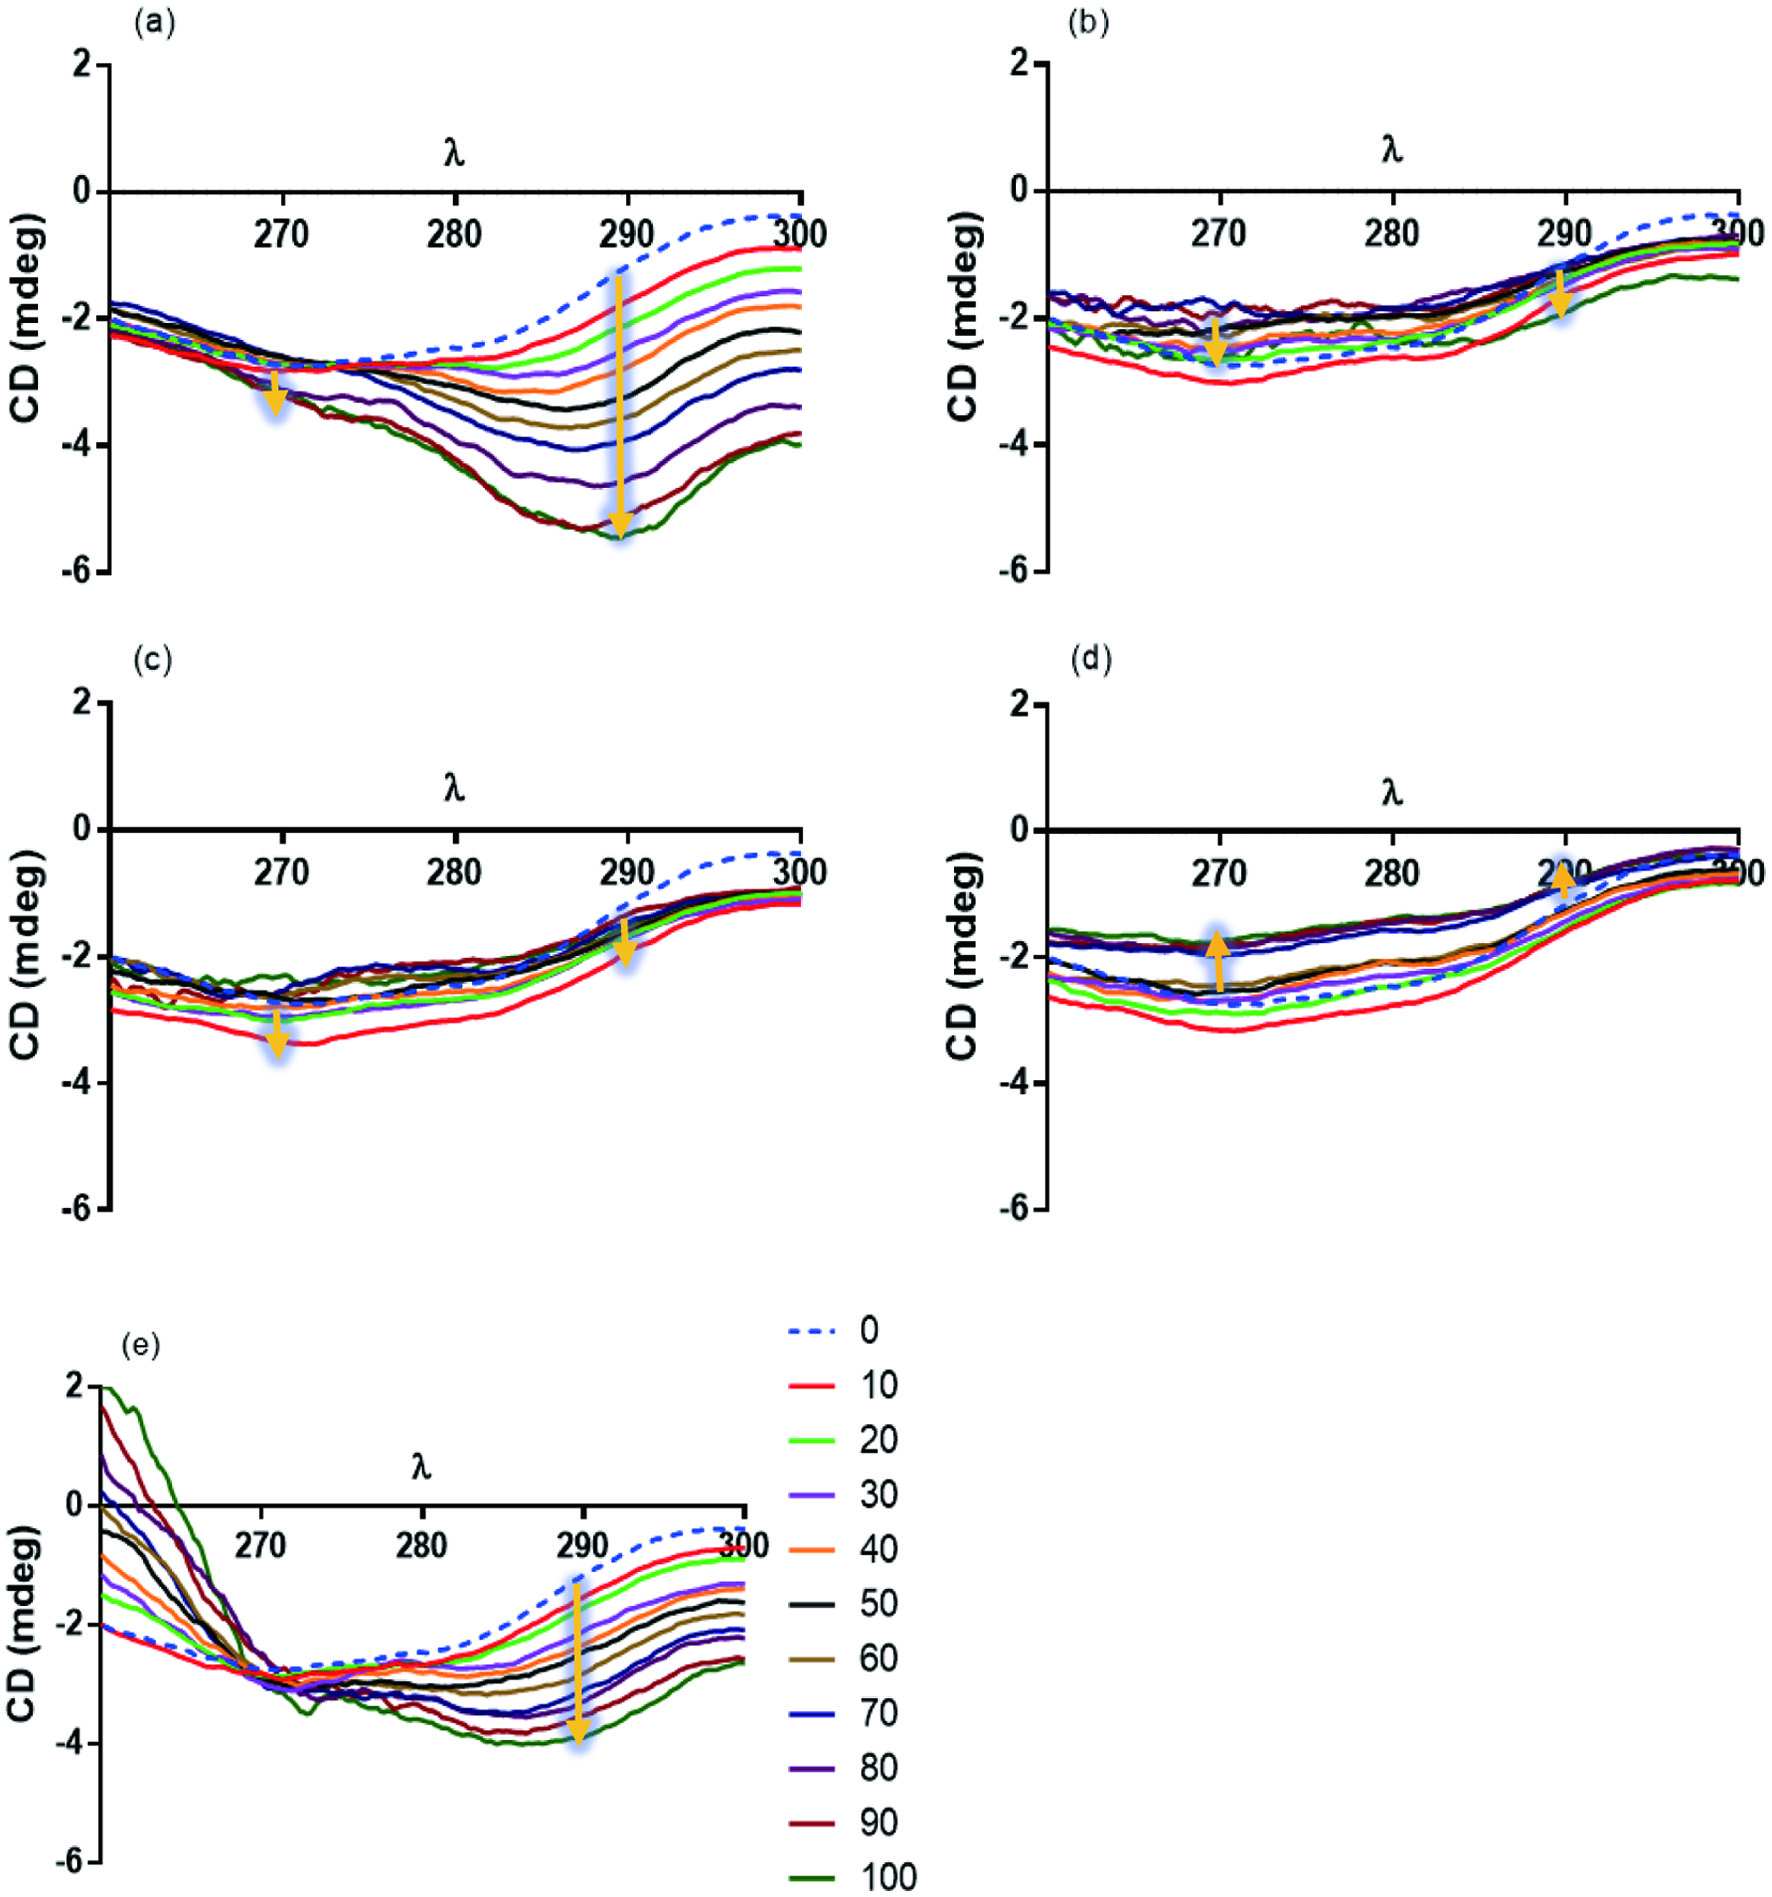 Click for large image | Figure 4. Circular dichroism absorption spectra (CD) of trypsin in the presence of different concentrations (10–100 µM) flavonoids: (a)HES, (b) LUT, (c) QUE, (d) CAT, and (e) RUT. Absorption wavelength (λ), and degrees of ellipticity, are in nanometers (nm), and in milligrade ellipticity (mdeg), respectively. Yellow arrows indicate changes in the spectrum (increase or decrease), as the concentration of flavonoids increases. |
KD values were calculated for the trypsin-flavonoid complex. The results were 16.05 ± 1.25, 33.00 ± 4.80, and 23.05 ± 0.70 µM for HES, QUE, and RUT, respectively. KD values at 290 nm were not determined for LUT and CAT. The greatest effect of HES and RUT can be associated with their structures. HES behavior can be explained considering its greater flexibility, which could interact with a larger region of trypsin increasing the expose of Trp moieties, which will agree with the observed extrinsic ANS-trypsin fluorescence results. The larger size (higher molecular weight) of RUT compared to the rest of the flavonoids could be responsible for the observed effect in this assay, increasing the affinity for the enzyme, and exposure of Trp moieties. The RUT lower CD results can be related to its lower Ksv value compared to the other flavonoids. A lower Ksv value indicates that the polypeptide chain is less accessible to the quencher, as in this case RUT. This relationship between the lowest Ksv value and the highest effect on the tertiary structure has been evaluated for type B DNA structures and flavonoids (Bhuiya et al., 2019).
The effect of flavonoids on trypsin inhibition and interactions, compared to other enzyme such as α-amylase can be related to the size of both enzymes (approximately 23.3 and 55.4 kDa, respectively). It has been reported that the interaction of phenolic compounds shows a larger effect on the secondary structure of high molecular weight proteases (pepsin, 41 kDa), compared to lower molecular weight proteases (trypsin and chymotrypsin, 23.3 and 28 kDa, respectively) (Wu et al., 2013). Similar results have been reported for the inhibition of α-amylase, lipase compared to trypsin, which has lower molecular weight, by flavonoids (Martinez-Gonzalez et al., 2019; Martinez-Gonzalez et al., 2020). In another study, the effect of tannic acid on the inhibition of α-glucosidase and trypsin, was evaluated, observing greater inhibitory activity against α-glucosidase, which possess higher molecular weight (Xiao et al., 2015).
3.5. Analysis of enzyme-flavonoids complexes interactions by molecular docking
The analysis of the possible binding sites for trypsin-flavonoids complexes was carried out in silico by docking studies (Figure 5, Table 3). Three binding sites were identified (Figure 5a). One for HES, LUT and QUE, another for RUT, and the third for CAT. All flavonoids, except CAT, bind near the active site. Due to the smaller size of trypsin, in contrast with α-amylase or lipase these binding sites are located in the surface of the enzyme and not in cavities (Martinez-Gonzalez et al., 2019; Martinez-Gonzalez et al., 2020). The site where the CAT is located (Figure 5f) does not allow any interaction with the catalytic triad of the enzyme. This result may explain the lack of inhibitory activity of this flavonoid. Even though, CAT showed the highest spontaneity (ΔG° = −7.5 kJ/mol), of all flavonoids, indicating that the inhibitory activity of flavonoids will depend not only in its affinity toward the enzyme, but the region where they bind to the enzyme. Due to its larger size, RUT, despite of binding farther away from the catalytic triad, it exhibited a mixed-type inhibition, possibly because it prevents the coupling of the substrate into the active site, and because it binds with Ser195 which is part of the catalytic triad (Figure 5g).
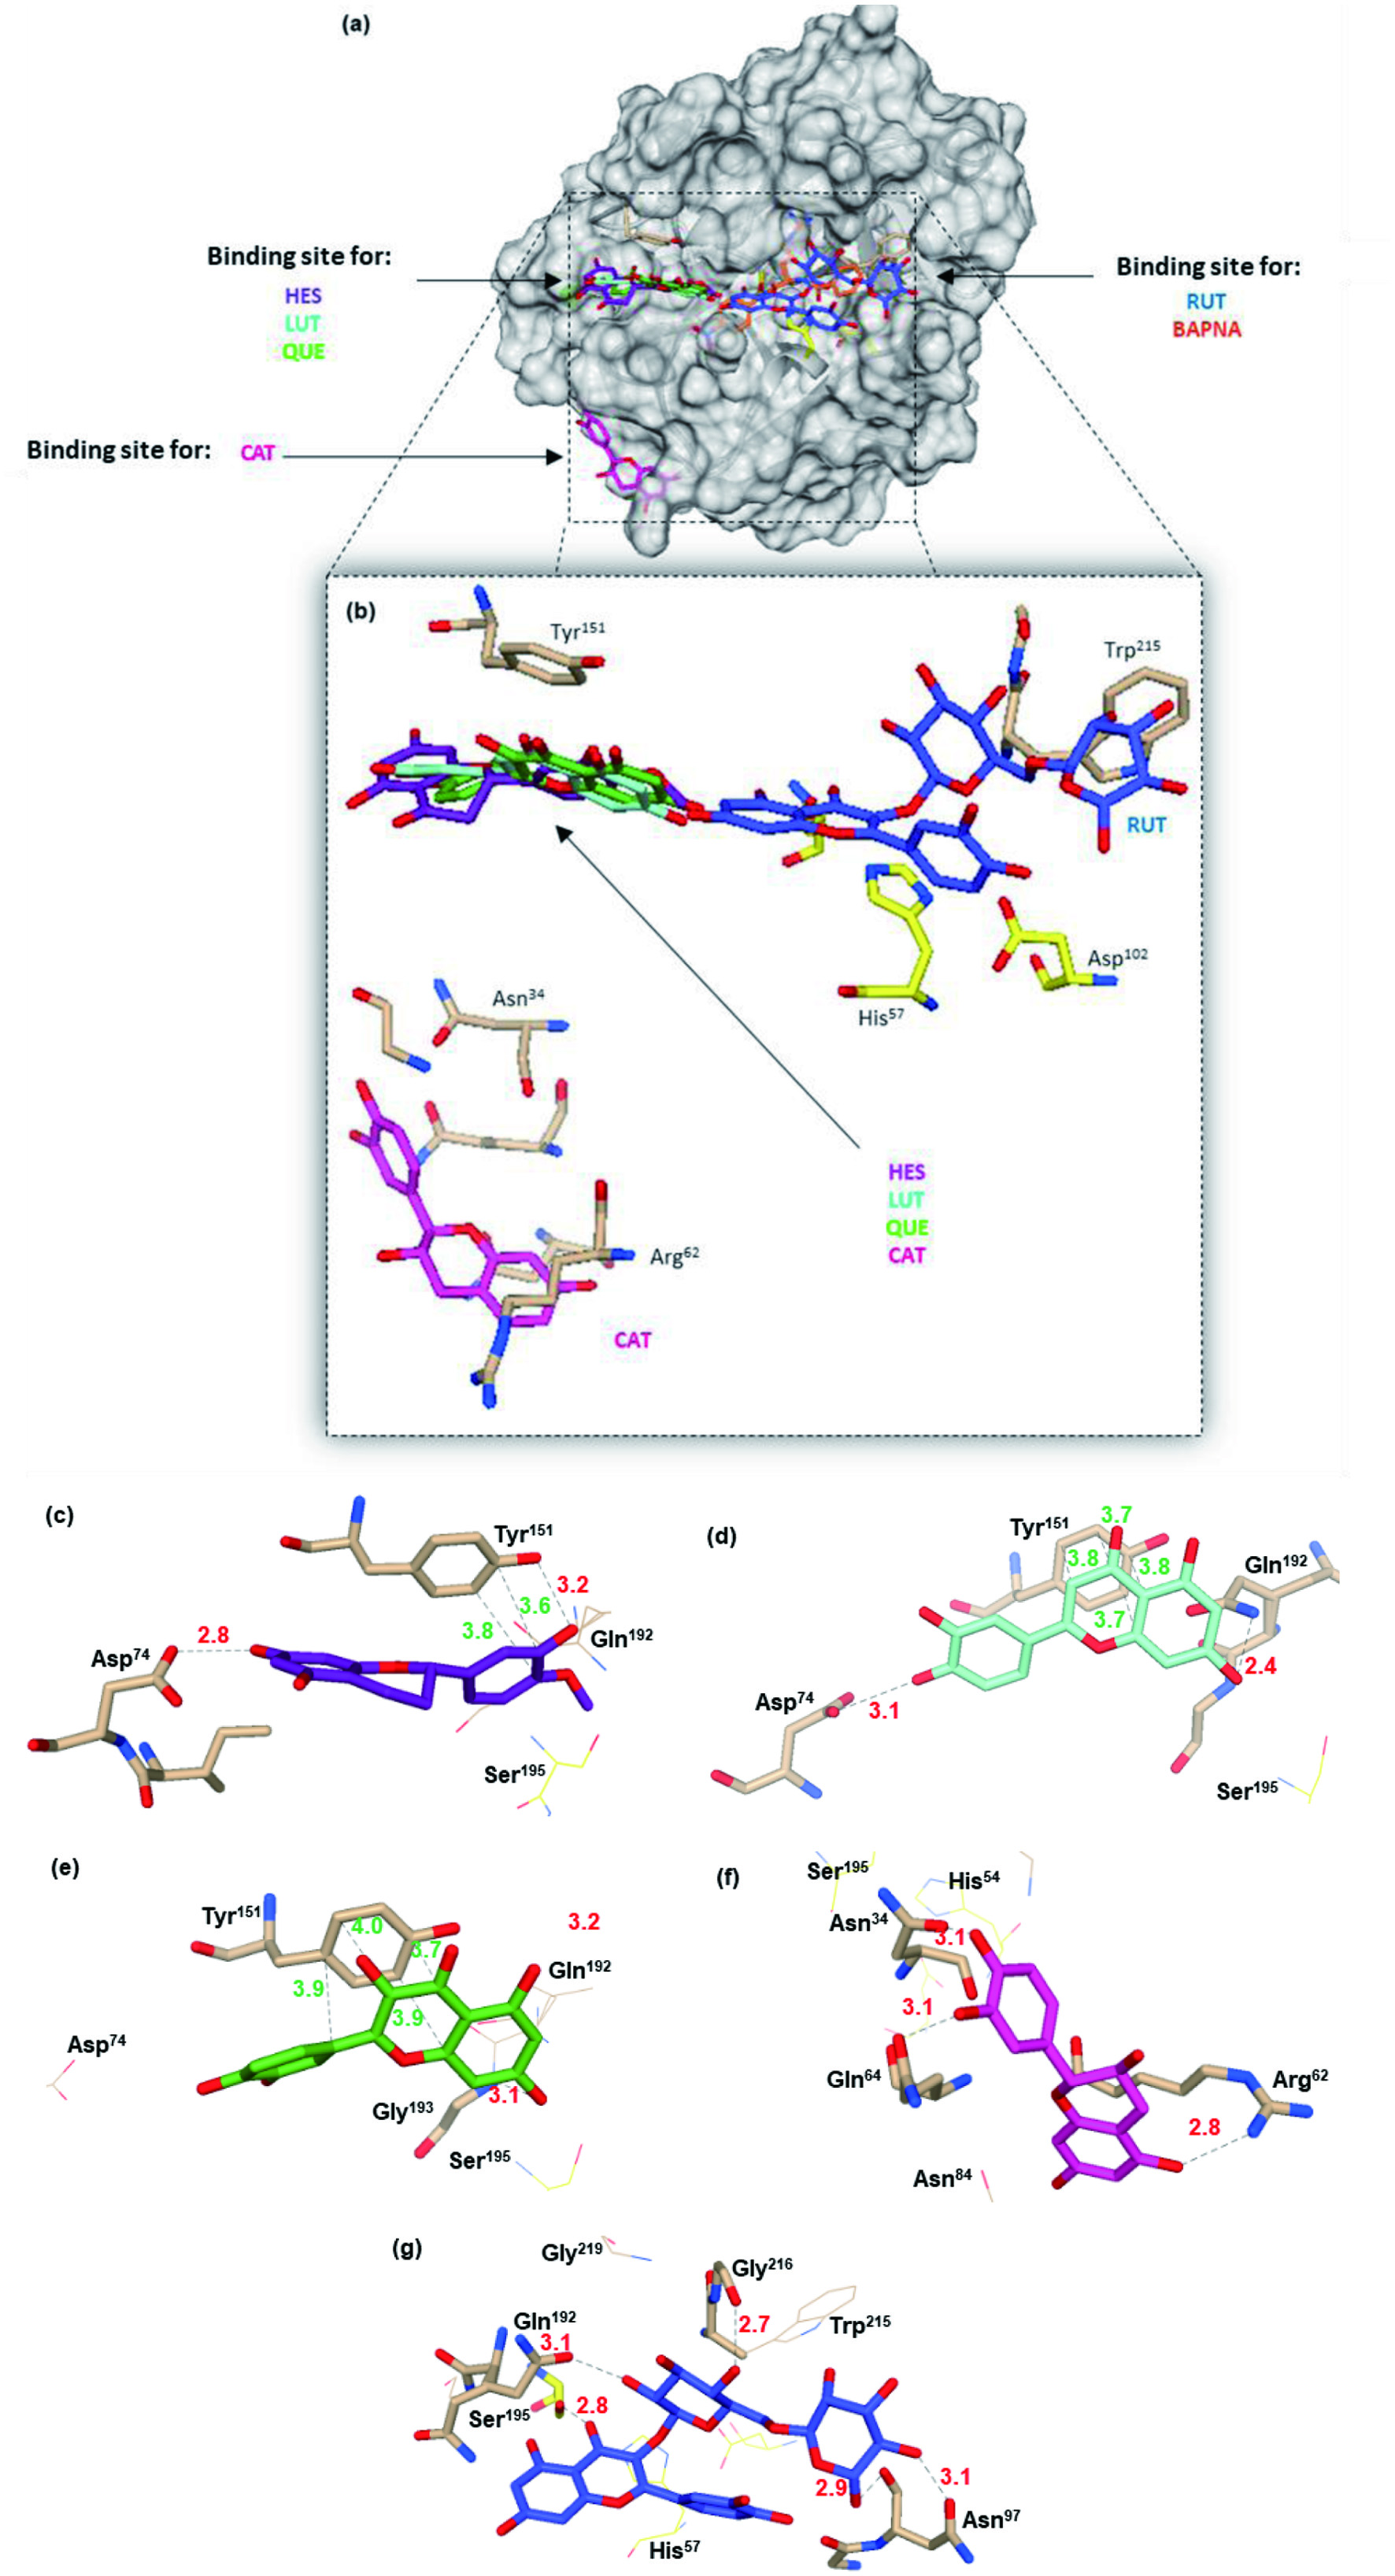 Click for large image | Figure 5. Molecular docking of trypsin and potential binding sites for the flavonoids HES, LUT, QUE, CAT, RUT, and the substrate, BAPNA. Surface representation for the full tridimensional structure of trypsin (dark gray), the amino acids of the active site are represented in yellow and the possible binding sites for the ligands (a). Flavonoids binding sites and the main amino acids residues (sticks) are shown (b), as well as the main for the flavonoids and the main specific interactions for HES (c), LUT (d), QUE (e), CAT (f), and RUT (g) are noted. The dot lines and distances (Å) with colors correspond to different interactions such as hydrogen (red), and hydrophobic binding(green). |
Click to view | Table 3. Gibbs free energy (ΔG°, kCal/mol), the trypsin amino acid residues interacting with flavonoids, and the distance (Å) for the possible enzyme-flavonoid conformations |
π-stacking hydrophobic and Hydrogen bondings were the main observed interactions for all flavonoids. HES, LUT and QUE (Figure 5c–e) showed hydrophobic π stacking interactions with Tyr151, in agreement with those reported for the interaction of phenolic compounds with trypsin and pepsin (Wu et al., 2013; Xiao et al., 2015). Trypsin interactions with CAT and RUT were only through hydrogen bonding, with residues such as Asn34, and Asn97, respectively. Hydrogen bonding interactions have been reported for CAT and trypsin (Cui et al., 2015).
LUT and QUE, which were the best trypsin inhibitors, bind in the same enzyme region. There appears to be a relationship between its binding to this site and its ability to inhibit catalytic activity. LUT, due to its hydroxyl group at C7, can bind with Gln192. In the case of QUE, its A ring binds with Gly193, forming an additional hydrogen bonding, compared to LUT. HES, also binds to this site, however, the lack of the double bond in ring C, gives a certain torsion of this ring, while the oxo group in C4 can help stabilize the HES spatial arrangement on this site. This difference in the spatial arrangement explains its different inhibitory activity compared to LUT and QUE. It has been described that the hydroxyl at C5′ of HES facilitates a better interaction, and greater inhibition, with larger enzymes such as α-amylase and α-glucosidase, compared to the interaction of naringenin, which has only one hydroxyl group at C4′ (Tadera et al., 2006). The participation of other characteristics of HES such as the methoxy group, which could prevent its adjustment in the binding site (avoiding its interaction with Gln192), and cause changes in the conformation of the enzyme, observed in the extrinsic fluorescence assays, should be evaluated. In vitro studies on digestion models, and in vivo studies, both with trypsin and other pancreatic enzymes must be done to completely elucidated the interaction mechanism of flavonoids to trypsin.
| 4. Conclusion | ▴Top |
LUT showed the largest trypsin inhibitory capacity, followed by QUE, RUT and HES, while no inhibition was observed with CAT. π-stacking hydrophobic and Hydrogen binding were the main non-covalent forces involved in the flavonoid-trypsin complex formation. These interactions showed a structure-activity relationship, such as the double bond between C2 and C3. The flavonoid backbone (two aromatic rings and one heterocyclic) allowed links with aromatic rings of the protein. In general, flavonoids bind to the same site in trypsin, which is close to the catalytic site, except for CAT, which did not present any inhibitory activity. Flavonoids exhibited a mixed inhibition, which depends on their interaction with the residues at this site.
Acknowledgments
The authors are grateful for the financial support from CONACYT, Mexico (CB-2016-01-286449). A.I.M.G. is thankful for the PhD scholarship from CONACYT and the support from UACJ.
| References | ▴Top |