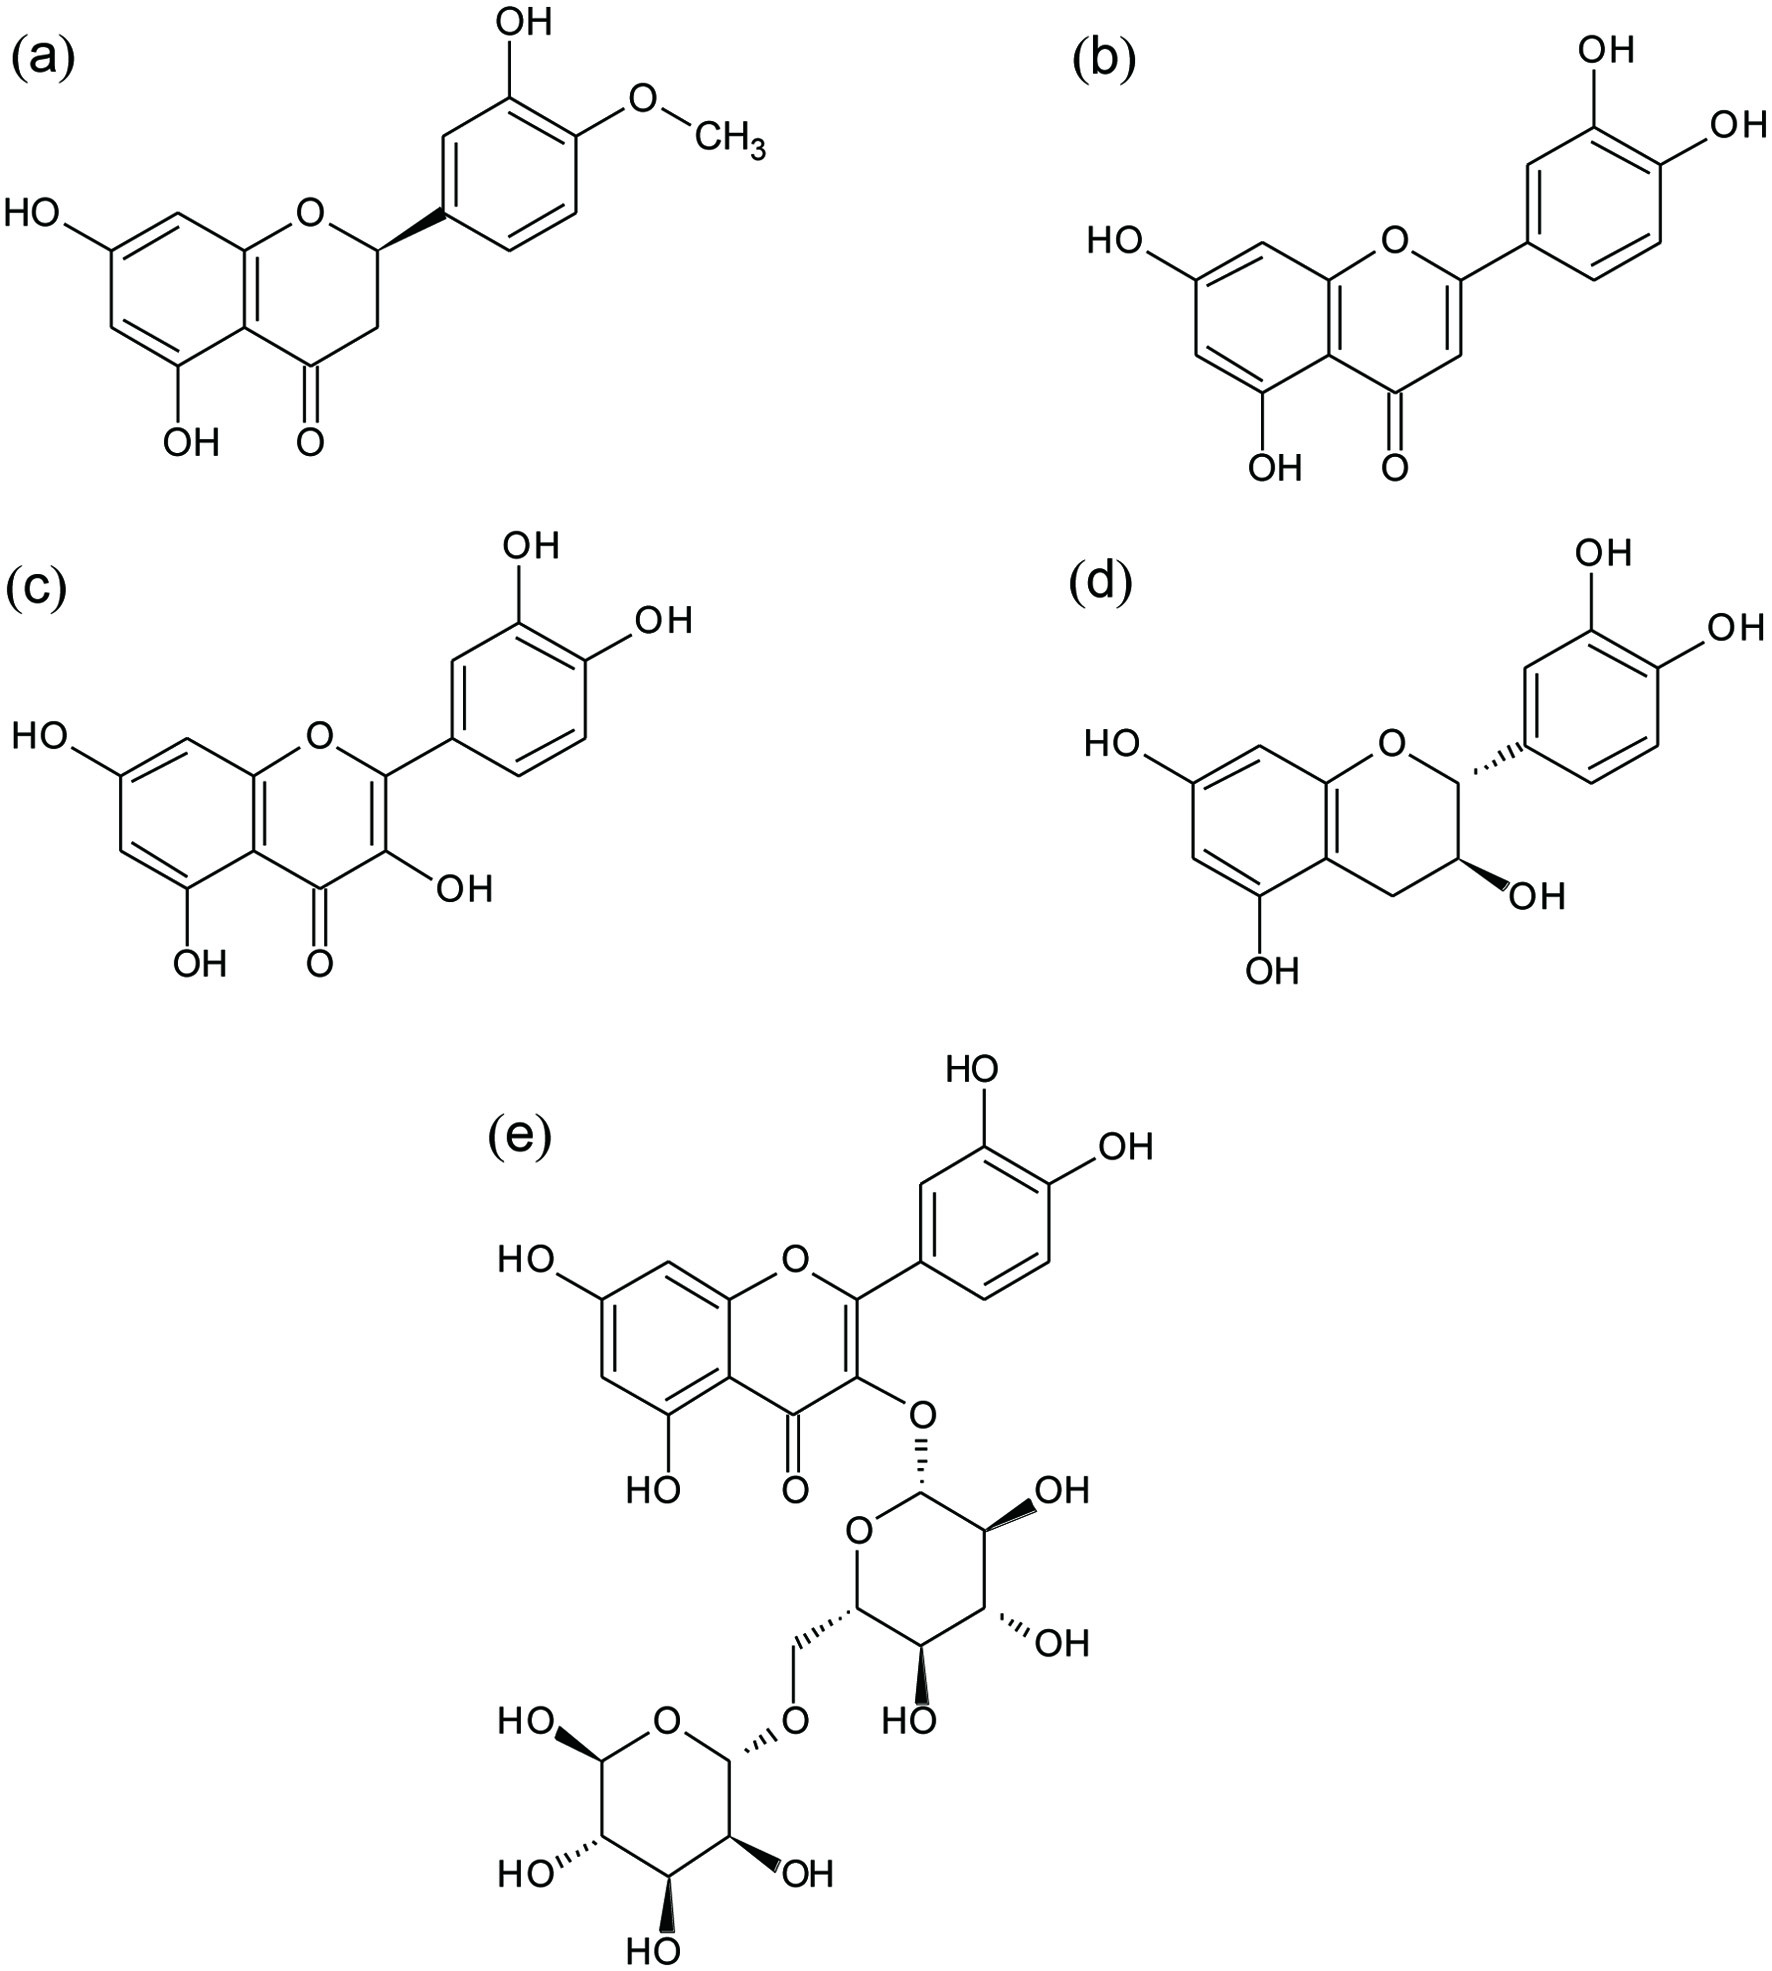
Figure 1. Chemical structures of evaluated flavonoids: (a) Hesperetin (HES), (b) luteolin (LUT), (c) quercetin (QUE), (d) catechin (CAT), and (e) rutin (RUT).
| Journal of Food Bioactives, ISSN 2637-8752 print, 2637-8779 online |
| Journal website www.isnff-jfb.com |
Original Research
Volume 14, June 2021, pages 102-113
A novel approach to trypsin inhibition by flavonoids
Figures
Tables
| Flavonoid | Concentration (μM) | V appmax (10−2 mM/min) | KappM (mM) | Inhibition type | Ki and K′i (mM) | |
|---|---|---|---|---|---|---|
| Data are represented as mean value ± standard deviation of triplicate analysis. Different letters in the same column indicate statistically significant values (Fisher's least significant difference analysis, p < 0.05) respect to control, or between treatments for free enzyme or enzyme substrate dissociation constants (Ki and Ki′, respectively). Vmax and KM correspond to maximal rate and Michaelis-Menten constant, respectively. n.d. means not determined. | ||||||
| CONTROL | 0.00 | 3.75 ± 0.20a | 0.35 ± 0.05fg | None | 0.00 | 0.00 |
| HES | 12.55 | 3.60 ± 0.10a | 0.35 ± 0.01g | Mixed | 73.15 ± 1.90a | 78.05 ± 2.50a |
| 25.10 | 3.60 ± 0.05a | 0.40 ± 0.05fg | ||||
| 50.09 | 3.40 ± 0.70b | 1.00 ± 0.10d | ||||
| LUT | 12.70 | 3.05 ± 0.50ab | 1.00 ± 0.00d | Mixed | 42.05 ± 0.70d | 44.50 ± 0.85c |
| 25.45 | 2.10 ± 0.00e | 2.40 ± 0.15b | ||||
| 50.20 | 1.40 ± 0.70f | 5.60 ± 0.95a | ||||
| QUE | 12.56 | 3.60 ± 0.15a | 0.40 ± 0.00f | Mixed | 58.90 ± 0.10c | 61.00 ± 1.30b |
| 25.08 | 3.40 ± 0.10b | 0.80 ± 0.18d | ||||
| 50.32 | 2.65 ± 0.20d | 1.25 ± 0.05c | ||||
| CAT | 12.49 | 3.80 ± 0.25a | 0.35 ± 0.00g | None | n.d. | n.d. |
| 25.07 | 3.70 ± 0.00a | 0.35 ± 0.00g | ||||
| 50.91 | 3.70 ± 0.15a | 0.35 ± 0.05g | ||||
| RUT | 12.56 | 3.70 ± 0.05a | 0.40 ± 0.10fg | Mixed | 68.20 ± 2.10b | 75.00 ± 8.00a |
| 25.00 | 3.40 ± 0.20a | 0.50 ± 0.00e | ||||
| 50.54 | 3.00 ± 0.05c | 1.05 ± 0.30cd | ||||
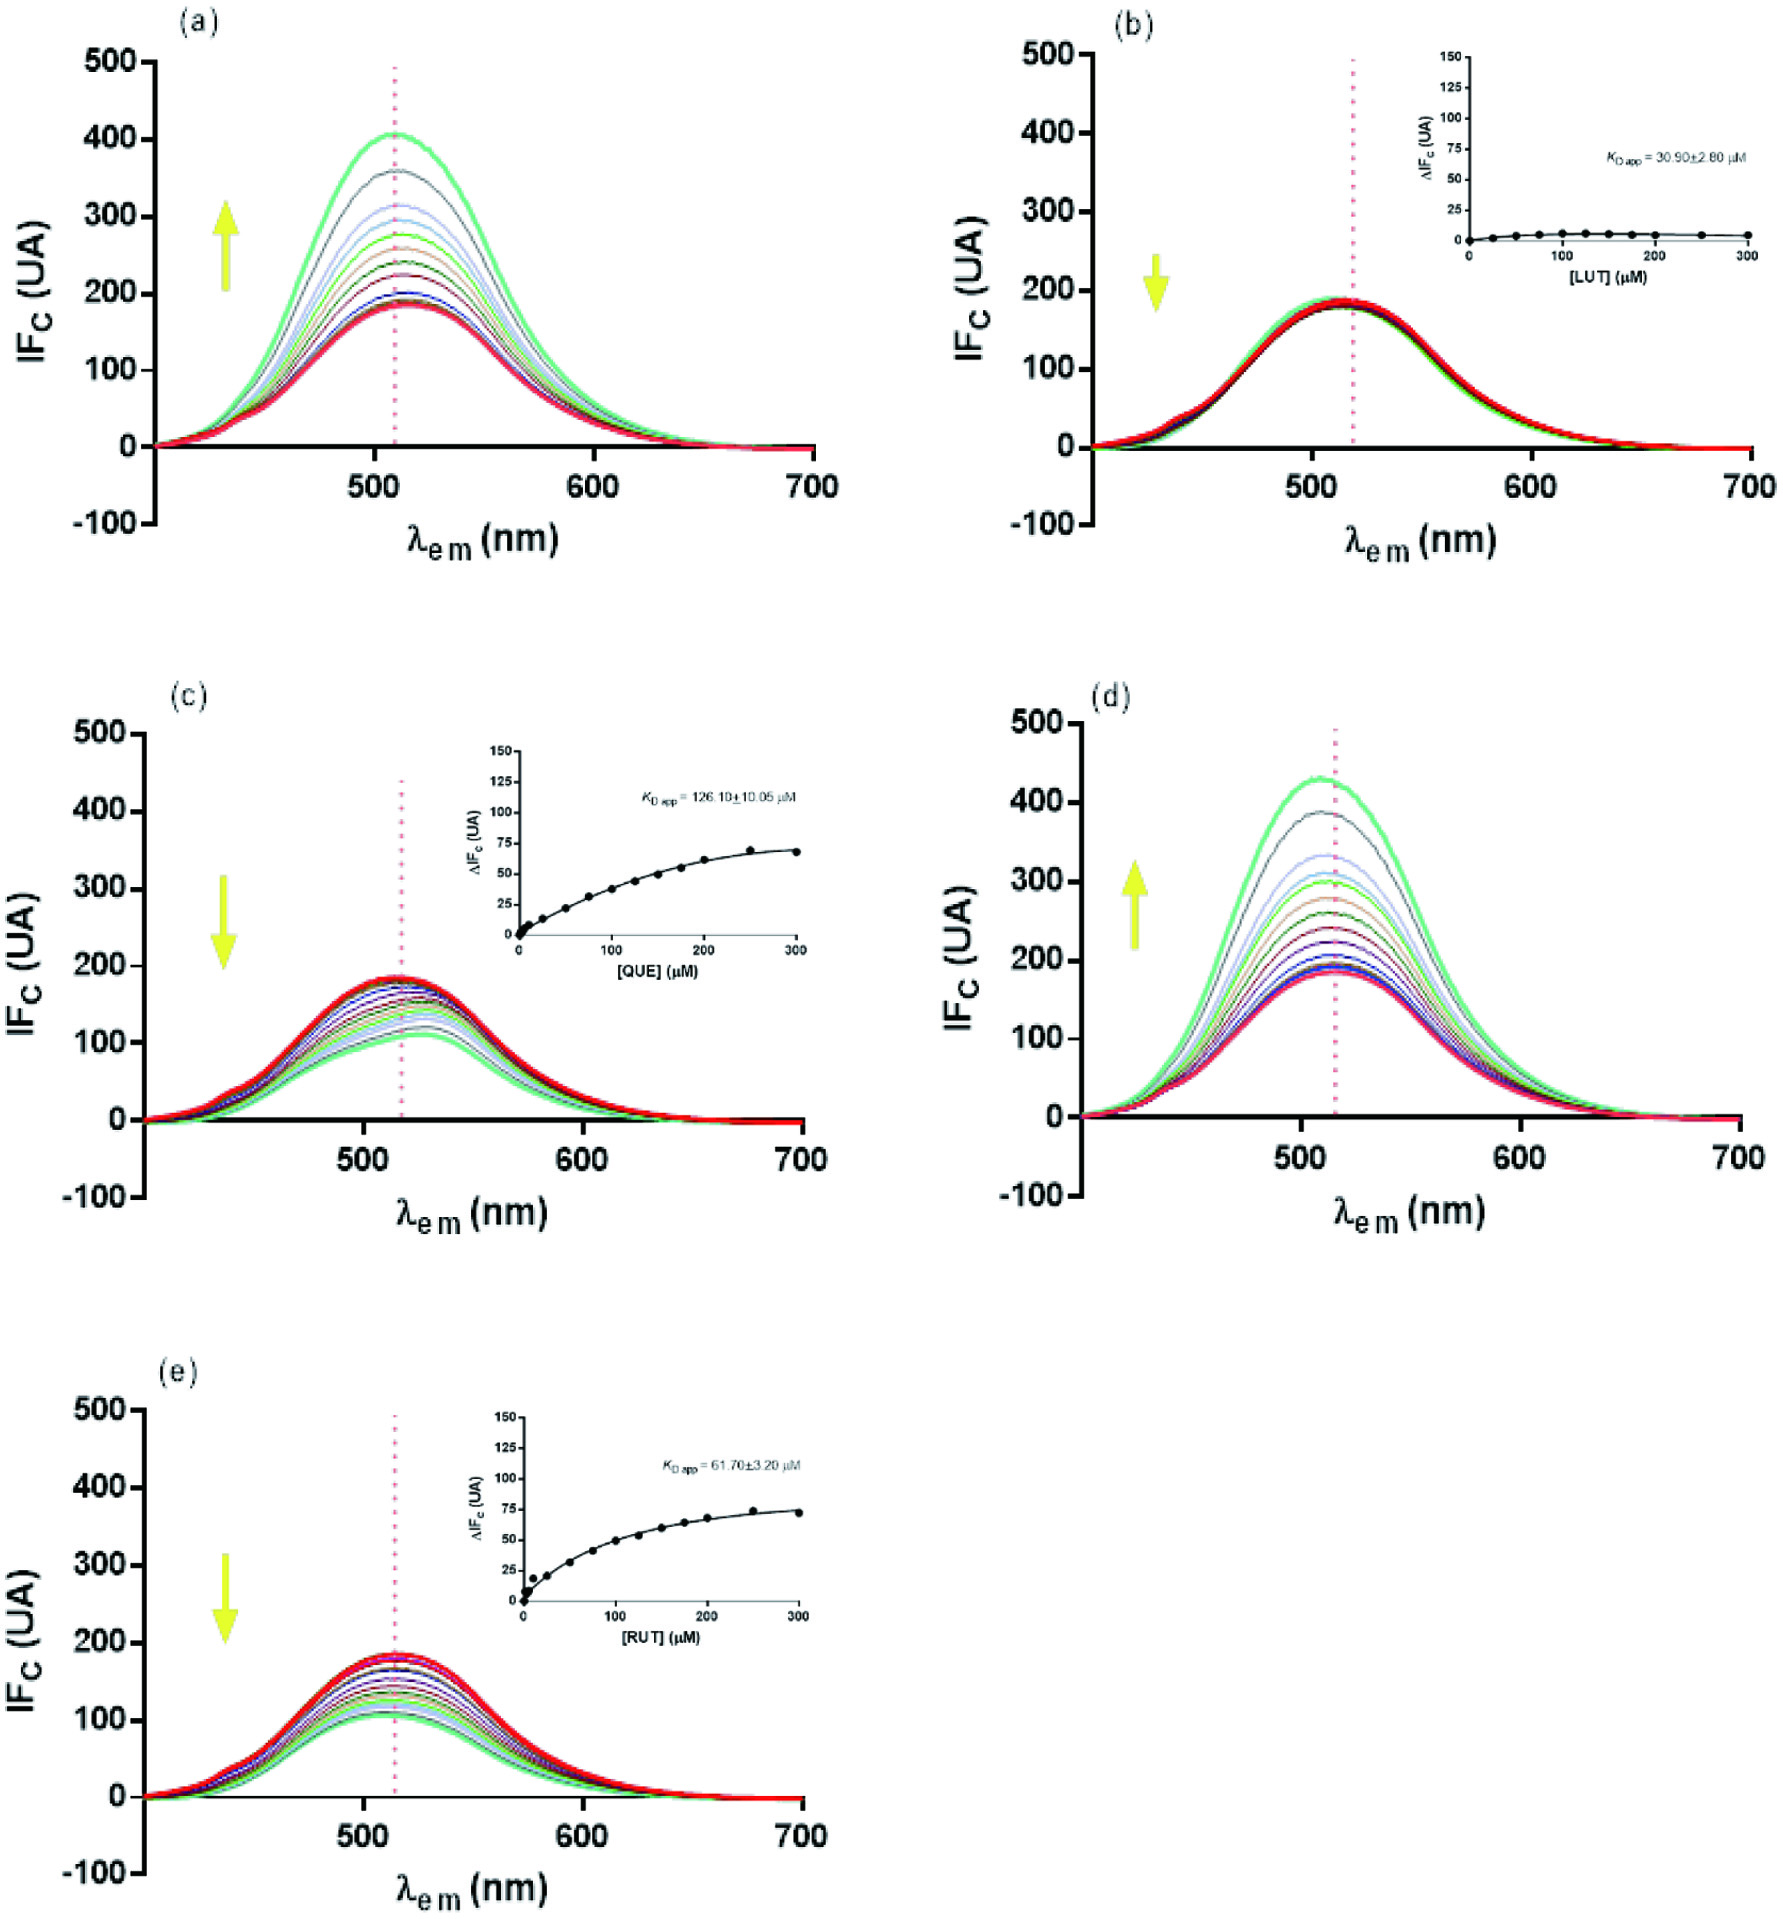
| Flavonoid | KappD (µM) | Ksv (10−1 mM−1) | kq (10−12 mM−1 s−1) | n | Ka (10−1 mM−1) |
|---|---|---|---|---|---|
| Data are the mean value ± standard deviation of triplicate analysis. Different letters in the same column indicate statistically significant values (Fisher's least significant difference analysis, p < 0.05) respect to control. n.d. means not determined. | |||||
| HES | 38.00 ± 4.02a | 0.96 ± 0.05b | 0.10 ± 0.01c | 0.70 ± 0.15b | 0.60 ± 0.00d |
| LUT | 16.10 ± 3.00c | 1.87 ± 0.10a | 9.86 ± 1.05a | 0.90 ± 0.01a | 1.60 ± 0.22a |
| QUE | 17.50 ± 1.50c | 1.22 ± 0.30b | 6.43 ± 0.40b | 0.80 ± 0.20ab | 0.90 ± 0.14b |
| CAT | n.d. | 0.00 ± 0.00d | 0.00 ± 0.00d | 0.00 ± 0.00d | 0.00 ± 0.00e |
| RUT | 31.00 ± 2.67b | 0.51 ± 0.00c | 6.61 ± 0.15b | 0.60 ± 0.03c | 0.70 ± 0.01c |
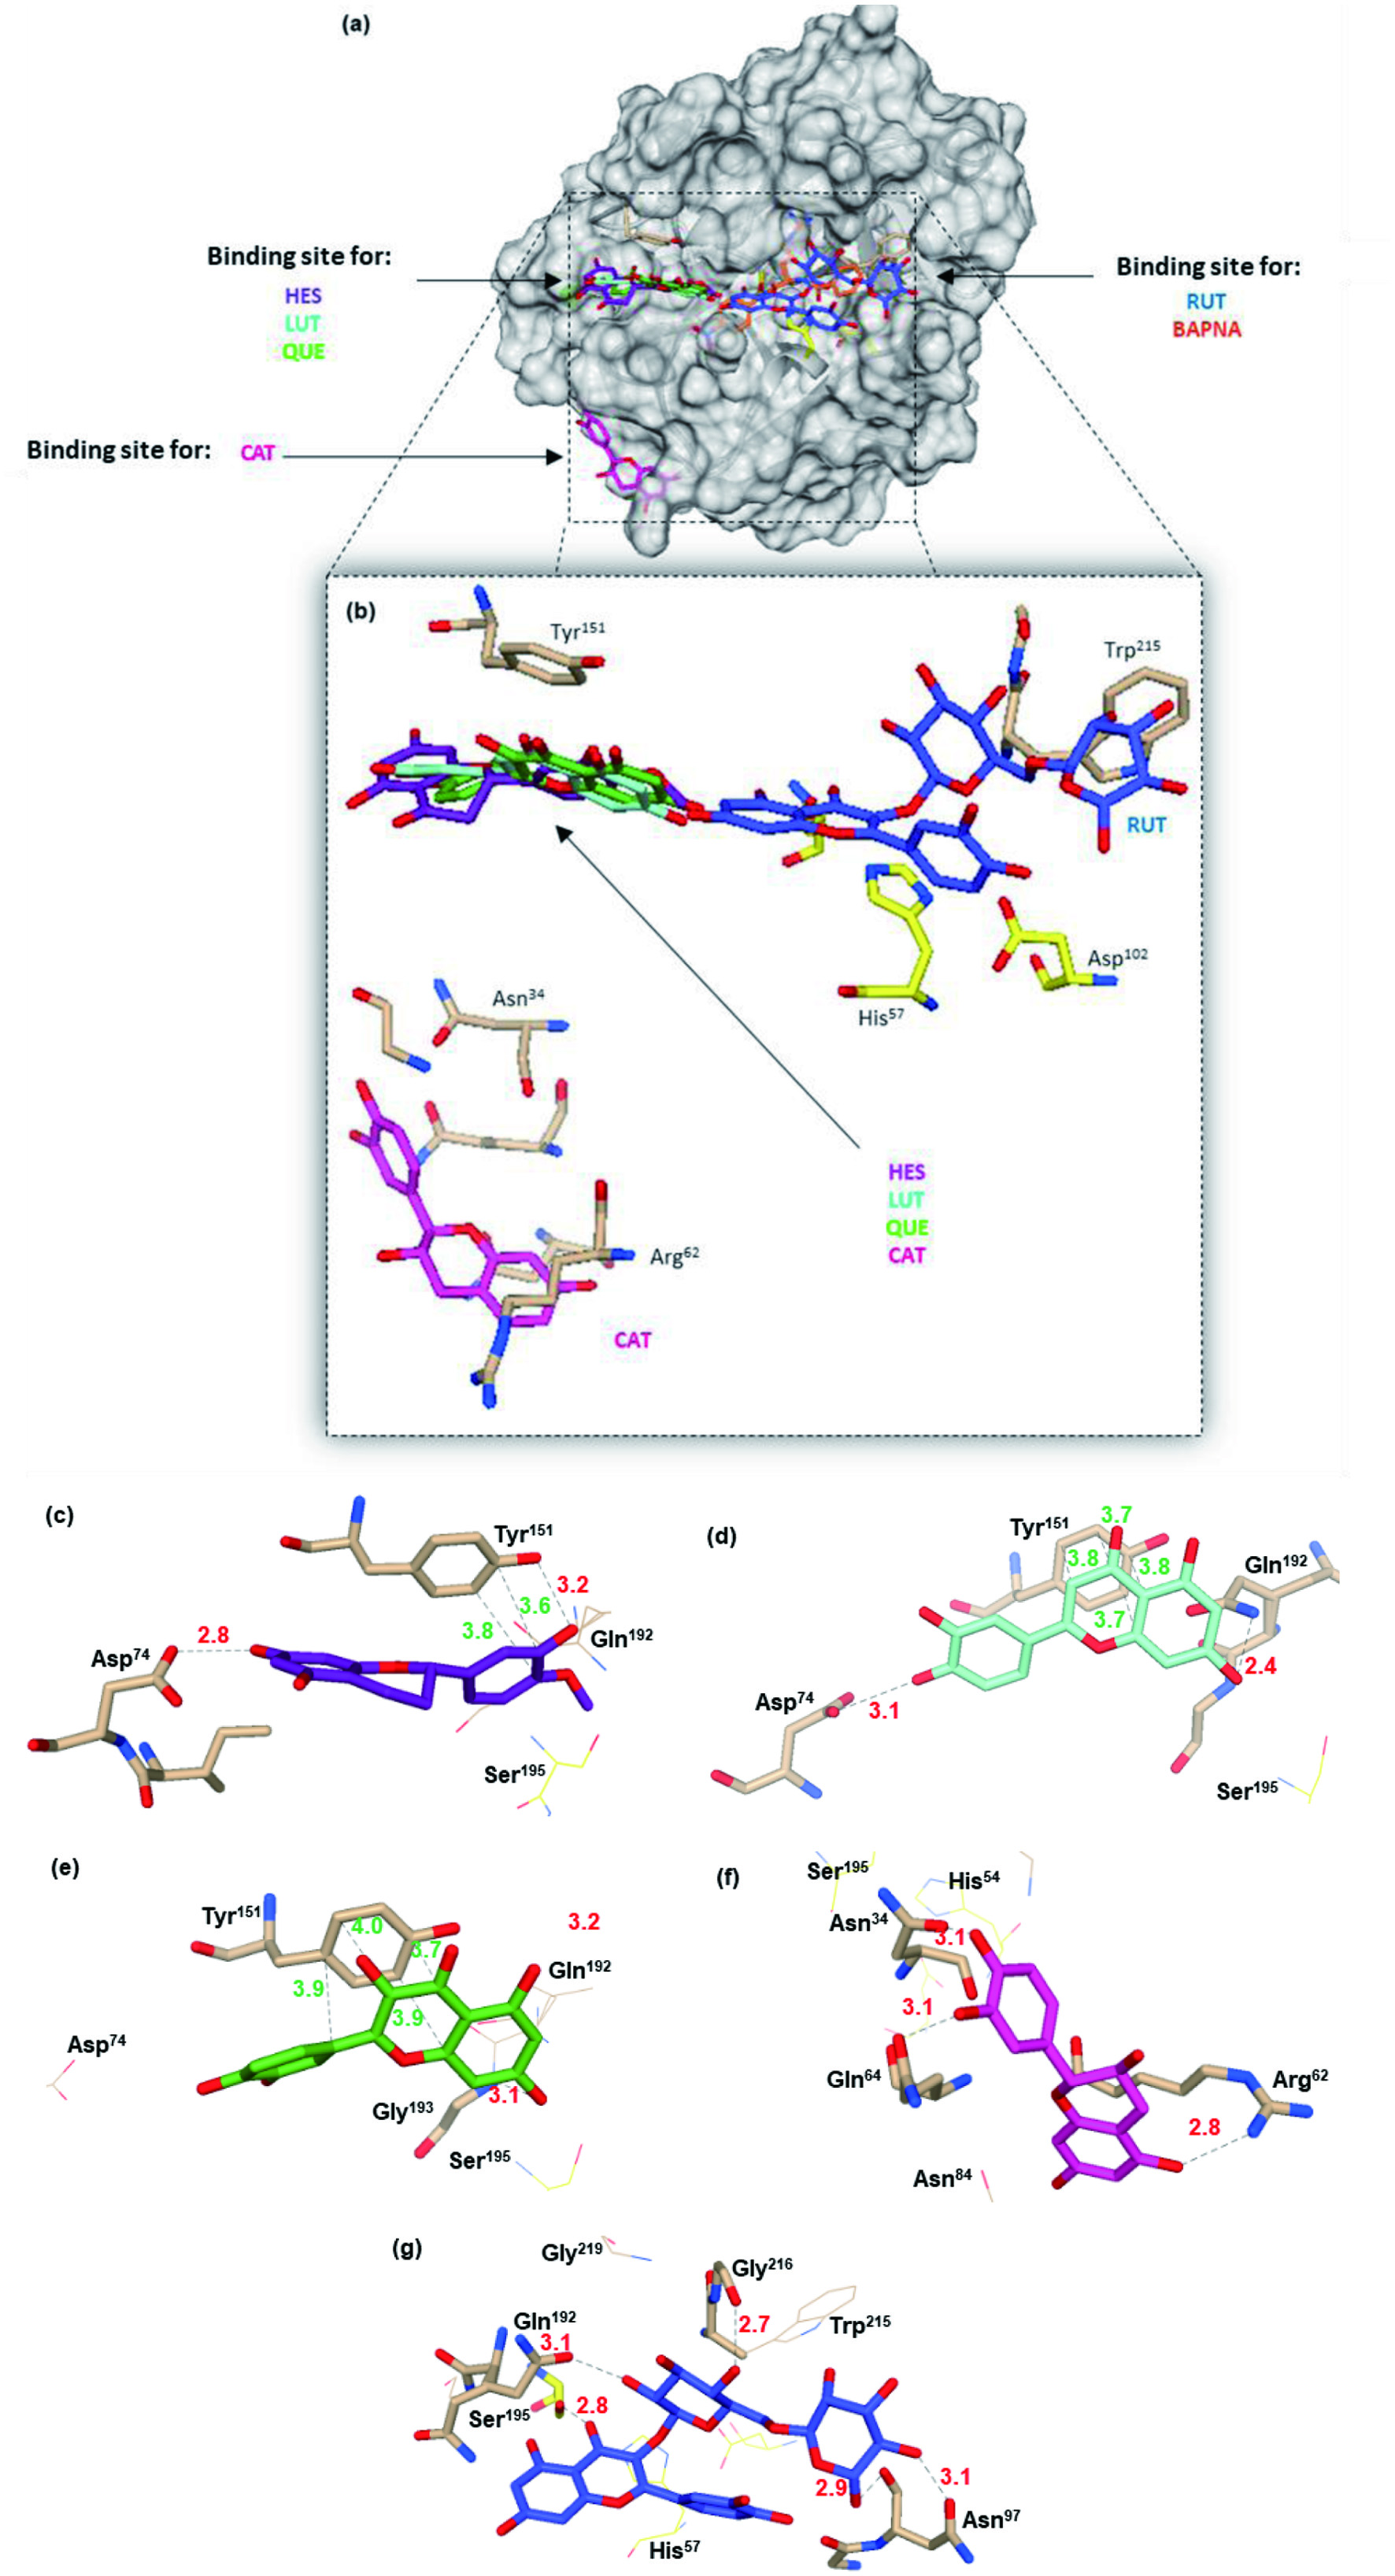
| Flavonoids | Amino acid residues lining the binding site, distance and binding energy interaction | ||
|---|---|---|---|
| Hydrophobic | Hydrogen Binding | ΔG° | |
| HES | Tyr151 (3.6; 3.8) | Asp74 (2.8), Tyr151 (3.2) | −6.7 |
| LUT | Tyr151 (3.8; 3.7; 3.7; 3.8) | Asp74 (3.1), Gln192 (2.4) | −7.3 |
| QUE | Tyr151 (3.9; 3.7; 4.0; 3.9) | Gly193 (3.1) | −6.5 |
| CAT | Ninguna | Asn34 (3.1), Arg62 (2.8), Gln64 (3.1) | −7.5 |
| RUT | Ninguna | Asn97 (2.9; 3.1), Ser195 (2.8), Gln192 (2.7), Gly216 (2.7) | −7.0 |