| Journal of Food Bioactives, ISSN 2637-8752 print, 2637-8779 online |
| Journal website www.isnff-jfb.com |
Original Research
Volume 14, June 2021, pages 75-80
Phenolic profiles and antioxidant activities of exocarp, endocarp, and hypanthium of three pear cultivars grown in China
Bin Dua, Fei Penga, Caihong Chenga, Yuqin Chenb, Jinhui Wua, Fengmei Zhu a, Yuedong Yanga, *
aHebei Key Laboratory of Active Components and Functions in Natural Products, Hebei Normal University of Science and Technology, Qinhuangdao 066004 Hebei, P.R. China
bYunnan Dehong Institute of Tropical Agricultural Science, Dehong Yunnan, P.R. China
*Corresponding author: Yuedong Yang, Hebei Key Laboratory of Active Components and Functions in Natural Products, Hebei Normal University of Science and Technology, Qinhuangdao 066004 Hebei, P.R. China. Tel: +86 0335 8387040; E-mail: bindufood@aliyun.com; kycyyd@126.com
DOI: 10.31665/JFB.2021.14269
Received: May 17, 2021
Revised received & accepted: June 19, 2021
| Abstract | ▴Top |
The phenolic composition of the exocarp, hypanthium, and endocarp from three pear cultivars: Jingbai, Korla and Crystal were measured by high-performance liquid chromatography method with diode array detection (HPLC-DAD), while antioxidant activities were investigated using DPPH radical and ABTS radical cation scavenging activity, and FRAP. Ferulic acid, chlorogenic acid, and caffeic acid were detected as major components. The exocarp of the Jingbai pear had a relatively high chlorogenic acid content (0.691 mg kg−1) while the hypanthium and endocarp had the high chlorogenic acid content of the three pear varieties. The exocarp of the Korla pear had the highest ferulic acid and rutin content. The exocarp, hypanthium, and endocarp of the Crystal pear had the highest content of chlorogenic acid of the three pear varieties. The Crystal pear presented the highest total phenolic and flavonoid contents and had the highest antioxidant activities in terms of FRAP. The Jingbai pear exocarp presented the highest ABTS value, 83.62 ± 0.08%. The endocarp of the Crystal pear had the highest DPPH value, 87.30 ± 0.03%. Positive correlations were detected among chlorogenic acid, TPC, TFC, and FRAP. The results reveal that the different parts of Pyrus communis L. have effective antioxidant activity for the pharmaceutical application.
Keywords: Pyrus communis L.; phenolic compounds; exocarp; hypanthium; endocarp; HPLC-DAD; TPC; DPPH
| 1. Introduction | ▴Top |
Pear (Pyrus communis L.) is one of the most common and widely consumed fruits in the world (Lin and Harnly, 2008; Peng et al., 2018). The desirable taste and high digestibility of pear fruits make them very popular among consumers (Salta et al., 2010). Fruits in general contain a wide array of dietary phytonutrients such as sugars, organic acids (Hudina et al., 2012), dietary fiber (Hussain et al., 2015), flavonoids, phenolic acids (Peng et al., 2015), carotenoids, and vitamins with strong antioxidant capacities (Oliveira et al., 2009). The health benefits, such as would healing effects (Ma et al., 2015) and antioxidant activity (Liaudanskas et al., 2017; Alipoorfard et al., 2020), are attributed to the dietary phytonutrients in pear. Among fruits, the pear is reported to contain a considerable large number of valuable compounds such as natural antioxidants and in turn, impart health-promoting effects to consumers (Barroca et al., 2006). The distribution of antioxidants may vary among different parts of the same fruit, such as the exocarp and hypanthium (Manzoor et al., 2012). Several studies have focused on phenolic composition and antioxidant activity of exocarp and pulp of the Pakistani pear varieties Nakh and Naspati (Manzoor et al., 2013) and the Portuguese Rocha pear (Singleton et al., 1999). However, the phenolic composition and antioxidant activity of the exocarp, hypanthium, and endocarp of the Chinese pear cultivars: Jingbai, Korla, and Crystal have not been evaluated.
The goal of this work is to investigate and analyze the phenolic composition and antioxidant activity of the exocarp, hypanthium, and endocarp of three different Chinese pear cultivars (Jingbai, Korla, and Crystal), and to provide scientific support to produce an enhanced value-added fruit and a source of a low-cost functional food.
| 2. Materials and methods | ▴Top |
2.1. Materials and chemicals
Jingbai, Korla, and Crystal pears were purchased from a local supermarket in Qinhuangdao, Hebei Province, China. Before analysis, all samples were frozen at −20 °C. Folin-Ciocalteu reagent was purchased from Beijing Aoboxing Biotechnology Co., Ltd. (Beijing, China). Gallic acid, catechin, chlorogenic acid, caffeic acid, ferulic acid, rutin, morin, 1,1-diphenyl-2-picrylhydrazyl (DPPH), 2,4,6-tri(2-pyridyl)-s-triazine (TPTZ), and 2,2-azino-di-(3-ethylbenzothialozine-sulphonic acid) (ABTS) were purchased from the National Standard Samples Center (Beijing, China). All other reagents were of analytical grade.
2.2. Sample preparation
After washing thoroughly with tap water, the fruits were separated into exocarp, hypanthium, and endocarp parts. The different portions recovered were sliced into cubes approximately 1× 1 cm using a steel knife. The exocarp, hypanthium, and endocarp parts (each 5 g) were extracted with 70% ethanol (v/v) using a KQ5200DB sonicator (Kunshan, China) at 40 kHz and 100 W for 30 min at room temperature. The exocarp, hypanthium, and endocarp extracts were filtered through Whatman filter paper and filtrates were evaporated to dryness in an EYEL4N-1100 vacuum rotary evaporator (EYELA Corp., Tokyo, Japan). The extracts were used in a radical scavenging assay. The extracts were prepared in methanol and passed through 0.45 μm polyether sulfone filter (Millipore Corp., Bedford, North Dakota, USA) for HPLC analysis.
2.3. HPLC-DAD analysis
For quantification purposes, the external standard methodology was performed in which the solute chosen as the reference is chromatographed separately from the sample. Stock solutions of individual standards (gallic acid, catechin, chlorogenic acid, caffeic acid, ferulic acid, and rutin) were prepared in methanol and used to make the standard mixtures at the desired concentration. Calibration standard solutions had concentrations ranging from 9.5 to 380.0 mg L−1 for gallic acid, 10.6 to 424.0 mg L−1 for catechin, 10.2 to 408.0 mg L−1 for chlorogenic acid, 10.0 to 400.0 mg L−1 for caffeic acid and ferulic acid, and 9.8 to 392.0 mg L−1 for rutin. HPLC-DAD analyses were carried out with an Agilent-1200 series instrument equipped with a UV-Vis photodiode array detector (DAD). After injecting 5 μL of a sample, separation was performed in an Agilent-Eclipse XDB C18 (4.6 × 150 mm; 5 μm) column. The column temperature was set at 30 °C. Two solvents were used for the gradient elution: A-(H2O containing 1% acetic acid) and B-(methanol). The elution program used was as follows: from 0 to 3 min, 85% B, flow rate of 1.2 mL min−1; from 3 to 7 min, 70% B, flow rate of 1.2 mL min−1; from 7 to 8 min, 55% B, flow rate of 0.6 mL min−1; from 8 to 14 min, 40% B, flow rate of 1.2 mL min−1; from 14 to 14.1 min, 85% B, flow rate of 1.2 mL min−1. For identification purposes, the standard addition was used by spiking the samples with pure standards, as well as by comparing the retention parameters and UV-Vis spectral reference data. The concentration of the identified phenolic compounds, expressed in mg per kg of fresh fruit weight (FW), was obtained by calibration plots using external standard methodology.
2.4. Determination of total phenolic content (TPC)
The TPC of samples was determined using the Folin-Ciocalteu reagent-based colorimetric assay as described by Singleton, Osirthofer, & Lamuela-Raventos (Singleton et al., 1999). Phenolic content was calculated as gallic acid equivalents (GAE) and reported as mg 100 g−1 sample. Briefly, a 0.5 mL appropriately diluted sample (or gallic acid standard at 0, 50, 100, 150 or 200 mg/L) was mixed with 0.5 mL of 2 N Folin-Ciocalteu reagent and 7.5 mL deionized water and allowed to stand for 10 min at room temperature. Then, 3 mL of 20% (w/v) Na2CO3 was added to the reaction mixture, and it was placed in a 40 °C water bath for 20 min. After the 20 min reaction period, the samples were cooled to room temperature, and the absorbance was measured at 760 nm (Dong et al., 2013).
2.5. Determination of total flavonoid content (TFC)
The TFC of samples was determined using a modified colorimetric method (Jia et al., 1999). Briefly, a 0.25 mL pear sample extract was mixed with 1.25 mL of distilled water and subsequently with 0.075 mL of 5% sodium nitrite solution, and was allowed to react for 5 min. Then, a 0.15 mL of 10% aluminum chloride was added and allowed to further react for 6 min before 0.5 mL of 1 M sodium hydroxide was added. Distilled water was added to bring the final volume of the mixture to 3 mL. The absorbance of the mixture was immediately measured at 510 nm wavelength against a prepared blank using a SHIMADZU UV-2201 spectrophotometer. The flavonoid content was determined by a rutin standard curve and expressed as the mean (milligrams of rutin equivalents (RE) per 100 g pear sample) ± standard deviation (SD) for three replications.
2.6. DPPH free radical scavenging capacity assay
DPPH radical scavenging capacity of samples was evaluated according to the method of Xu & Chang (Xu and Chang, 2007) with slight modifications. DPPH radicals have an absorption maximum at 515 nm, which disappears due to reduction by an antioxidant compound. The DPPH• solution in methanol (6 × 10⁻⁵ M) was prepared daily, and 3 mL of this solution was mixed with 100 μL of the sample solution. The mixture was incubated for 20 min at 37 °C in a water bath, and then the decrease in absorbance at 515 nm was measured (AS). A blank sample containing 100 μL of methanol in the DPPH• solution was prepared daily, and its absorbance was measured (AB). The experiment was carried out in triplicate. Radical scavenging activity was calculated using the following formula:
2.7. Ferric reducing antioxidant power (FRAP) assay
This method is based on the reduction, at low pH, of a colorless ferric complex (Fe3+-tripyridyltriazine) to a blue-colored ferrous complex (Fe2+-tripyridyltriazine) by the action of electron-donating antioxidants. The reduction was monitored by measuring the change of absorbance at 593 nm. The working FRAP reagent was prepared daily by mixing 10 volumes of 300 mM acetate buffer, pH 3.6, with 1 volume of 10 mM TPTZ in 40 nm hydrochloric acid and with 1 volume of 20 mM ferric chloride. A standard curve was prepared using various concentrations of FeSO4·7H2O. All solutions were used on the day of preparation. 100 μL of sample solutions and 300 μL of deionized water were added to 3 mL of freshly prepared FRAP reagent. The reaction mixture was incubated for 30 min at 37 °C in a water bath. Then, the absorbance of the samples was measured at 593 nm. A sample blank reading using acetate buffer was also taken. The difference between sample absorbance and blank absorbance was calculated and used to calculate the FARP value. The reducing capacity of the sample tested was calculated with reference to the reaction signal given by a Fe2+ solution. FRAP values were expressed as mmol Fe2+ g−1 of sample. All measurements were done in triplicate (Xu and Chang, 2007).
2.8. ABTS assay free radical scavenging capacity assay
ABTS was dissolved in deionized water to a 7 mM concentration. ABTS radical cation (ABTS•+) was produced by reacting ABTS solution with 2.45 mM potassium persulfate (final concentration) and allowing the mixture to stand in the dark at room temperature for 12–16 h before use. For the study, the ABTS•+ solution was diluted in deionized water or ethanol to an absorbance of 0.7 (±0.02) at 734 nm. An appropriate solvent blank reading was taken (AB). After the addition of 100 μL of sample solutions to 3 mL of ABTS•+ solution, the absorbance reading was taken at 30 °C, 10 min after initial mixing (AS). All solution was used on the day of preparation, and all determinations were carried out in triplicate (Jia et al., 1999). The percentage of inhibition of ABTS•+ was calculated using the following formula:
2.9. Statistical analysis
All results were expressed as mean ± SD of three replicates. Data in triplicate were analyzed by one-way analysis of variance (ANOVA) and post-hoc test using SPSS 11.5 software package for Windows (IBM Corporation, Armonk, NY, USA).
| 3. Results and discussion | ▴Top |
3.1. HPLC-DAD analysis of pear phenolics
High performance liquid chromatography-diode array detection (HPLC-DAD) chromatogram of the individual phenolic mixture standard is shown in Figure 1. The mixed standard substances were separated at various scanning wavelengths, and the wavelength selected can simultaneously determine a variety of phenolics. After analysis and comparison of the spectra at each wavelength, it has been found there was no wavelength at which seven types of phenols can be simultaneously determined. This problem can be overcome using a multiple wavelength scanning program capable of monitoring several wavelengths simultaneously in which seven phenolics were able to achieve maximum absorption, the baseline was stable, and separation and repeatability was good. These results allowed us to conclude that good accuracy was reached in pear fruit phenolic compounds determination.
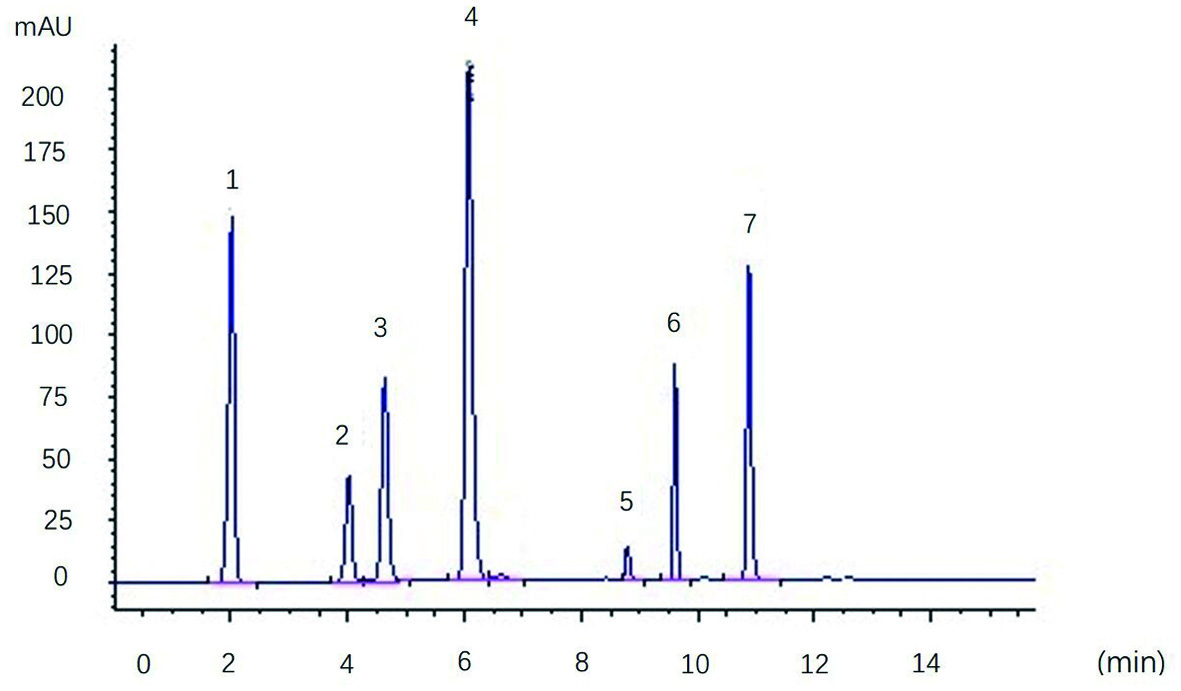 Click for large image | Figure 1. HPLC-DAD chromatogram of the individual phenolic compounds mixture standard. Peak identification: (1) Gallic acid, (2) Catechin, (3) Chiorogenic acid, (4) Caffeic acid, (5) Ferulic acid, (6) Rutin and (7) Morin |
The content of gallic acid, catechin, chlorogenic acid, caffeic acid, ferulic acid, and rutin in pear samples is shown in Table 1. Morin was not found in the exocarp, hypanthium, or endocarp of pear fruit. Ferulic acid, catechin, gallic acid, chlorogenic acid, caffeic acid, and rutin were determined in the exocarp of all three varieties. Gallic acid, chlorogenic acid, caffeic acid, and rutin were determined in the endocarp of all three varieties. Gallic acid, chlorogenic acid, and caffeic acid were determined in the hypanthium of all three varieties. Chlorogenic acid and ferulic acid, which belong to hydroxycinnamic acid, were detected as the major phenolics. Ferulic acid is an abundant phenolic phytochemical found in plants. Kikuzaki et al., (2002) suggested that ferulic acid was most effective radical-scavenging activity among the tested phenolic acids. The exocarp of the Jingbai pear had the highest chlorogenic acid content (0.691 mg kg−1). The exocarp of the Korla pear presented the highest ferulic acid content (1.405 mg kg−1). The content of chlorogenic acid in the Jingbai pear was in descending order, as follows: exocarp > endocarp > hypanthium. The endocarp from the Korla pear and the Crystal pear had the highest chlorogenic acid content, followed by exocarp and hypanthium. Other reports have reported a similar phenomenon. Sanchez, Gil-Izquirdo & Gil (Sanchez et al., 2003) suggested that chlorogenic acid content was higher in the exocarp than in the hypanthium from six pear cultivars.
 Click to view | Table 1. : Individual phenolics content in exocarp, hypanthium and endocarp from 3 varieties of pear (mg kg−1) |
3.2. Total phenolic content (TPC) and total flavonoid content (TFC)
TPC and TFC of exocarp, hypanthium, and endocarp from three varieties of pear fruit are shown in Table 2. TPC and TFC in all three varieties are in descending order as follows: exocarp > endocarp > hypanthium. These results are in accordance with previous studies in which TPC and TFC results for both the varieties of pear fruit (Nakh and Nashpati) showed that the exocarp contained higher phenolic contents than the pulp (Manzoor et al., 2013). Oztürk et al. (2015) determined the phenolic compounds and some chemical characteristics at flesh and peel in some pear cultivars. They also found the phenolic compounds were generally higher in the peel than in the flesh (Oztürk et al., 2015). The exocarp of the Crystal pear presented the highest TPC content (153.44 ± 2.60 mg GAE 100g−1) and TFC content (3.04 ± 0.86 mg RE 100g−1). The antioxidant activity of plant phenolics is due to the reactivity of phenol moieties (hydroxyl group on aromatic ring) which have the ability to scavenge free radicals via hydrogen-atom transfer (HAT) or single-electron transfer (SET).
Click to view | Table 2. : TPC, TFC, FRAP, ABTS and DPPH in exocarp, hypanthium and endocarp from 3 varieties of pear |
3.3. DPPH radical scavenging activity
DPPH is a stable free radical, which decreases significantly on exposure to proton radical scavengers (Sun et al., 2011). As a rapid and simple measure of antioxidant activity, the DPPH radical scavenging capacity has been widely used. It also has an advantage of polyphenolic compounds. The scavenging effect of different part from all three varieties on the DPPH radical decreased in the order of endocarp > exocarp > hypanthium (Table 2). This is in agreement with the result obtained by Manzoor, Anwar, Bhatti & Jamil (Barroca et al., 2006), who suggested that the exocarps extracts of the Nakh and Nashpati pears exhibited higher DPPH scavenging activity ranging from 49.71–49.94% compared to those of the pulp extract 27.89–28.29%. The endocarp from the Crystal pear had the highest DPPH radical scavenging activity (87.30 ± 0.03%). The hypanthium from the Jingbai pear had the lowest DPPH radical scavenging activity (4.32 ± 0.05%). The exocarp, endocarp, and hypanthium of the Crystal pear exhibited higher DPPH scavenging activity compared to the Jingbai and Korla pears.
3.4. FRAP values
The FRAP assay is often used to measure the antioxidant capacity of foods, beverages and nutritional supplements containing polyphenols. The antioxidant capacities of pear fruits using the FRAP assay are shown in Table 2. The scavenging effect of different parts from all three varieties on FRAP decreased in the order of exocarp > endocarp > hypanthium. The exocarp from the Crystal pear had the highest FRAP (329.82 ± 5.03 mmol Fe2+ g−1). The hypanthium from the Korla pear had the lowest FRPA (57.55 ± 9.39 mmol Fe2+ g−1). It has been reported that the antioxidant activity of many compounds of botanical origin is proportional to their phenolics contents, suggesting a causative relationship among TPC, TFC, and FRAP. Interestingly, the Crystal pear, which exhibited the highest chlorogenic acid, TPC, and TFC, registered the highest FRAP. This is in agreement with the results obtained by Loots, Van Der Westhuizen & Jerling (Loots et al., 2006) who suggested that the FRAP of Kei-apple juice correlated well with the polyphenol concentrations.
3.5. ABTS radical scavenging activity
The ABTS assay is applicable on both lipophilic and hydrophilic compounds (Sasidharan and Menon, 2011). This ABTS method determines the antioxidant activity of hydrogen-donating antioxidants and of chain-breaking antioxidants. The antioxidant capacities of three pear varieties using the ABTS assay are shown in Table 2. In the present study, the pear fruit samples showed notable ABTS•+ cation radical scavenging activity. The scavenging effect of different parts of the Jingbai and Crystal pears on ABTS•+ scavenging activity decreased in the order of exocarp > endocarp > hypanthium. However, as for the Korla pear, the endocarp had the highest ABTS•+ scavenging activity, followed by the exocarp and hypanthium. The exocarp from the Jingbai pear presented the highest ABTS•+ scavenging activity (83.62 ± 0.08%).
| 4. Conclusions | ▴Top |
The present results describe TPC, TFC, and individual phenolic compounds in exocarp, hypanthium, and endocarp from three different varieties from China. Ferulic acid, catechin, gallic acid, chlorogenic acid, caffeic acid, and rutin were determined in the exocarp of three pear varieties. These pear varieties also showed higher antioxidant activity when evaluation by FRAP, DPPH, and ABTS assays. The Crystal pear presented the highest content of total phenolic and total flavonoids as well as the highest results of FRAP. This work has shown that phenolics in different pear varieties have potent antioxidants, and that the antioxidant activity in pear fruit was positively correlated with chlorogenic acid, TPC, and TFC. Our results have found that the exocarp of three pear varieties analyzed is rich in antioxidants. From a nutritional point of view, the consumption of unexocarped pears if recommended to maximize the dietary intake of antioxidant compounds.
Acknowledgments
This research is supported by Hebei province’s key research and development program (project code: 20322803D).
Conflict of interest
The authors declare no conflict of interest
| References | ▴Top |