| Journal of Food Bioactives, ISSN 2637-8752 print, 2637-8779 online |
| Journal website www.isnff-jfb.com |
Original Research
Volume 11, September 2020, pages 110-118
Antioxidant capacity of Lathyrus sativus seeds
Wojciech Rybińskia, Magdalena Karamaćb, Michał Janiakb, Andreas Börnerc, Natalia Płatoszb, Ryszard Amarowiczb,
a, Instutute of Plant Genetic, Polish Academy of Sciences, Strzeszyńska 34, 60-479 Poznań, Poland
bInstitute of Animal Reproduction anf Food Research, Polish Ascademy of Sciences, Tuwima 10, 10-748 Olsztyn, Poland
cLeibniz Institute of Genetics and Crop Plant Research (IPK), 06466 Gatersleben, Germany
*Corresponding author: Ryszard Amarowicz, Institute of Animal Reproduction and Food Research, Polish Academy of Sciences, Tuwima Street 10, 10-748 Olsztyn, Poland. E-mail: r.amarowicz@pan.olsztyn.pl
DOI: 10.31665/JFB.2020.11242
Received: July 3, 2020
Revised received & accepted: September 28, 2020
| Abstract | ▴Top |
Grass pea seeds of 30 varieties from Poland, Slovakia, Czech, Russia, Ukraine, Hungary, Bulgaria, India, Iran, Tunisia, Ethiopia, Canada, and Chile were investigated. Phenolic compounds were extracted from seeds into 80% (v/v) methanol. The total phenolics compounds content of the extracts was determined using Folin-Ciocalteu’s phenol reagent. The antioxidant activity was determined using ABTS and FRAP assays. Total phenolic contents ranged from 2.72 to 10.7 mg/g extract and from 35.9 to 144.7 mg/100 g seeds. The extracts and seeds were characterized using Trolox equivalent antioxidant capacity values of 0.014–0.060 mmol Trolox/g extract and 0.188–0.866 mmol Trolox/100 g seeds, and FRAP values of 0.188–0.866 mmol Fe2+/g extract and 0.541–1.398 Fe2+/100 g seeds. The total phenolics content of grass pea extract was correlated with the results of the ABTS (r = 0.854) and FRAP (r = 0.958) assays. A similar correlation existed between the results of both assays (r = 0.890). Phenolic acids were the dominant phenolic compounds of two cultivars of grass pea. Syringic and sinapic acids had the highest amounts while ferulic, p-hydroxybenzoic, protocatechuic, and p-coumaric acids were present in much lower quantities. Phenolic acids were present in the form of free compounds, esters, and glycosides.
Keywords: Grass pea; Legume; Antioxidant activity; Phenolic compounds; Phenolic acids
| 1. Introduction | ▴Top |
Grass pea (Lathyrus sativus) is cultivated in India, Ethiopia, Australia, and other countries from North Africa, Asia, and Europe (Hanbury et al., 2000). It is drought tolerant and thrives with minimal external input of water (Hillocks and Maruthi 2012). Therefore, grass pea is an ideal legume for resource-poor farmers.
Currently grass peas, like lentil, vetch, and chickpea is being cultivated in Europe (Mikić et al., 2011). The reason for the increase acreage of grass pea is the high nutritional value of its seeds (Ennenking 2011). According to Mullan et al (2009), grass pea is characterized by the content of its starch, protein, lipid, and minerals which are similar to those of faba bean and peas.
Grass pea seeds have a high nutritional value (Ennenking 2011). Palmitic and linoleic acids are the major fatty acids of grass pea (Pastor-Cavada et al., 2009). However, grass pea seeds contain a neurotoxin, β-N-oxalyl-1-α,β-diamino-propionic acid (β-ODAP). This non-protein amino acid causes neurolathyrism, a neurological disease in both humans and domestic animals (Getahun et al., 2002). Fortunately, plant geneticists have managed to produce varieties with β-ODAP content of <0.10% (Kumar et al., 2011). In turn, food technologists have shown that soaking and cooking reduce the content of β-ODAP in grass pea seeds (Srivastava and Khokhar, 1996; Getahun et al., 2002).
Grass pea seeds after removal of anti-nutritional compounds can be a material for obtaining protein preparations (Pastor-Cavada et al., 2010). Grass pea proteins possess suitable functional properties like water and oil absorption capacity, foaming ability, and foaming stability (Aletor et al., 2011).
Phenolic compounds of plant origin play an important role in human nutrition as natural antioxidants. They act as protectors of lipids, proteins and DNA against reactive oxygen and nitrogen species. The results of many studies confirm the high antioxidant potential of legume seeds. It seems that they can play an important role in cardio- and cancer-protection (Shahidi and Ambigaipalan, 2015; Alshikha, et al., 2015; Bouchenak and Lamri-Senhadji, 2013; Yeo and Shahidi, 2020).
The protective effect of consumption of phenolic-rich grains, legumes, berries, nuts, and oilseeds against several chronic diseases was demonstrated by several researcher groups (Valdez et al., 2019; Shahidi et al., 2019a, 2019b).
The present study was aimed to determine the content of total phenolics in grass pea extracts and seeds as well their antioxidant activity.
| 2. Materials and methods | ▴Top |
2.1. Materials
Seeds of 30 grass pea varieties from Poland, Slovakia, Czech, Russia, Ukraine, Hungary, Bulgaria, India, Iran, Tunisia, Ethiopia, Canada, and Chile were obtained from field experiments conducted in Cerekwica (Poland). For phenotypic features the data from descriptors for Lathyrus sativus were used (IPGRI 2000). After harvest, ten randomly selected plants from each accession were selected for estimation of yield and structure parameters). One hundred seed weight was calculated from weighing and counting at least 200 seeds. The characteristics of those seeds are reported in Table 1.
 Click to view | Table 1. Characteristic of grass seeds investigated in this study |
2.2. Chemicals and standards
Organic solvents, the Folin-Ciocalteu’s phenol reagent, (+)-catechin, sodium persulfate, 2,2′-azinobis-(3-ethylbenzothiazoline-6-sulfonic acid) (ABTS), 2,4,6-tri(2-pyridyl)-S-triazine (TPTZ), ferrous chloride, and 6-hydroxy-2,5,7,8-tetramethyl-chroman-2-carboxylic acid (Trolox), were purchased from Sigma (Poznań, Poland).
2.3. Extraction
Phenolic compounds were extracted from defatted seed samples with hexanes into 80% methanol (v/v). Condition of extractions were as follows: 3 × 30 min, 50 °C, a solid-to-solvent ratio of 1:10 (w/v) (Amarowicz and Shahidi, 2017). Extraction was carried out at 50 °C for 30 min in flasks placed in a shaking water bath (Elpan 357, Wrocław, Poland). Methanol from the combined extract was evaporated using a Büchi R-210 rotary evaporator. The sample was then freeze-dried.
2.4. Total phenolic compounds
The content of total phenolics in the extracts was determined using Folin-Ciocalteu’s phenol reagent (Naczk and Shahidi, 1989). The results were expressed as (+)-catechin equivalents/g extract and as (+)-catechin equivalents/100 g seeds.
2.5. ABTS assay
The Trolox equivalent antioxidant capacity (TEAC) was determined using a method described by Re et al. (1999). For the colorimetric measurement, 2 mL of ABTS radical cation solution were mixed with 20 μL of grass pea extract (5 mg/mL) and after 6 min the absorbance was read at 734 nm. A calibration curve was plotted using Trolox solution. The results were expressed as mmol Trolox equivalents (TE)/g extract and mmol Trolox equivalents (TE)/100 g seeds.
2.6. FRAP assay
The ferric-reducing antioxidant power (FRAP) assay was performed according to Benzie and Strain (1990). The working FRAP reagent (2.25 mL) was mixed with 75 μL of the sample and 225 μL of deionized and the absorbance was measured at 593 nm against a reagent blank after 30 min incubation. The FRAP values were expressed as mmol of Fe2+/g extract and as mmol of Fe2+/100 g seeds.
2.7. Sample preparation for LC-MS analysis
2.7.1. Phenolic acids
For analysis of free phenolic acids extract was dissolved in aqueous methanol (50%, v/v) with addition of 0.95% formic acid and mixed for 24 h at 10 °C in a ThermoMixer (Benchmark Scientific, Saryeville, NJ, USA) and centrifuged at 13,200 g for 20 min at 4 °C. The supernatant was collected and the solvent evaporated under a flow of nitrogen.
The extract so obtained was suspended in water, acidified to pH 2, carefully vortexed and sonicated. Free phenolics were extracted using 2 mL of diethyl ether with sonication. The mixture was centrifuged and the organic layer collected. Extraction was repeated three times and diethyl ether layers were combined, dried under a flow of nitrogen and stored under −20 °C. Water residue was kept under a flow of nitrogen for 5 min to remove any traces of diethyl. Water residue was mixed with 1 mL of 4 M NaOH. The mixture was hydrolysed for 4 h at room temperature under a nitrogen atmosphere with magnetic stirrer. Subsequently, the pH of the solution was adjusted to 2 with 6 M HCl. Phenolic acids liberated from esters were extracted using diethyl ether as described above The water layer was subjected to acid hydrolysis using 0.2 mL of 6 M HCl and the mixture was incubated at 100 °C for 60 min. After cooling, the pH was adjusted to 2 with 6 M NaOH. Extraction of phenolic acids liberated from glycosides into diethyl ether was conducted in the same way as described above.
The fractions of phenolic acids were dissolved in 80% methanol and centrifuged at 13,200 g for 20 min at 4 °C. The HPLC-MS analysis was subsequently performed.
2.7.2. Flavonoids
The extract before LC-MS analysis was prepared like as the fraction of phenolic acids.
2.8. LC-MS analysis
Phenolic acids and flavonoids were separated using the HPLC system (LC-200, Eksigent, Vanghan, ON, Canada). They were identified and quantified using a mass spectrometer (QTRAP 5500, AB Sciex, Vaughan, ON, Canada). The system was equipped with triple quadrupole, ion trap and ion source of electrospray ionization (ESI). Separation was conducted using HALO C18 column (50 mm × 0.5 mm × 2.7 m, Eksigent, Vaughan, ON, Canada); the temperature of 45 °C was maintained, flow rate was 15 µl /min. Solvent A was water with formic acid (0.9%, v/v) and solvent B was acetonitrile with formic acid (0.9%, v/v). Binary gradient was employed and was set up as follows: 0.5% B for 0.5 min, 0.5–90% B in 1.5 min, 90% B for 0.5 min, 90–0.5% B in 0.2 min, and 0.5% B for 0.3 min. Identification was conducted using ESI-MS/MS detector under the following conditions: negative ionization, curtain gas: 20 L/min, collision gas: ion spray voltage: 5,300 V, temperature: 350 °C, 1 ion source gas: 35 L/min, 2 ion source gas: 30 L/min, declustering potential: 100 V, entrance potential: 10 V, collision energy: 40 eV, and collision cell exit potential: 20 V. Identification and quantitation of the phenolic acids and flavonoids were based on the comparison of their retention times and the presence of the respective parent and daughter ion pairs (Multiple Reaction Monitoring method, MRM), with data obtained after analysis of the authentic standards. The external standards (0.01–0.5 g/mL) had linear calibration curves with a coefficient of determination of 0.997–0.999. The results were expressed in mg/g of extract and mg/100 g seeds. All analyses were conducted in triplicate.
2.9. Statistical analysis
The results are reported as the mean values of three estimates ± SD. The relationship between total phenolics content, TEAC, and FRAP determined using Pearson’s correlation. The results were described using principal component analysis (PCA) and hierarchical cluster analysis (HCA) with Ward’s method and Euclidean distances. Statistical and chemometric data analyses were performed using Statistica (Windows software package 8.0, Dell Inc., Tulsa, OK, USA).
| 3. Results and discussion | ▴Top |
3.1. Content of total phenolics
The contents of total phenolics in the extracts obtained from grass pea ranged from 2.72 (LAT 494) to 10.07 mg/g extract (LAT 451) (Table 2). The results expressed per seed weight ranged from 35.9 (LAT 476) to 144.7 mg/100 g seeds (LAT 451) and these were lower than those for red bean, lentil, faba bean, and adzuki bean (Amarowicz and Pegg, 2008). Similar results were obtained for white bean by Orak et al. (2016) and for pea by Amarowicz and Troszyńska (2003). Fratianni et al (2014) reported similar content of total phenolics in two Italian varieties of grass pea (20.6 and 21.3 mg/100 g). In the study of Wang et al. (1998), the content of total phenolics in Canadian grass pea ranged from 16.2 to 37.5 mg/100 g. Seeds of Spanish, Italian, French, Polish, and German lines of Lthyrus sativus were characterized by the content of total phenolics that ranged from 20.3 to 70.3 mg/100 g (Rybiński et al., 2018). However, the higher contents of total phenolic compounds in grass pea were reported by Carbonaro et al. (2015) and Wiszniewska and Piwowarczyk (2015).
Click to view | Table 2. Characteristics of the grass pea seeds and their extracts: content of total phenolics and antioxidant activity |
3.2. Antioxidant activity
The results of the ABTS and FRAP assays are presented in Table 2. The results for the extracts were reported as Trolox equivalent antioxidant capacity (TEAC) values, ranging from 0.014 (LAT 494) to 0.060 mmol Trolox/g extract (LAT 451) and by FRAP values that ranged from 0.025 (Canada C) to 0.082 mmol Fe2+/g extract (LAT 440).
For seeds the results of TEAC and FRAP ranged from 0.188 (LAT 494) to 0.866 mmol TE/100 g seeds (LAT 4076) and from 0.541 (UACH 2) to 1.398 mmol Fe2+/100 g seeds, respectively. Similar results of TEAC and FRAP were reported for white bean (Amarowicz and Pegg, 2008). Lower results were reported earlier for the European lines of grass pea: 0.158–0.372 mmol Trolox/100 g seeds and 0.487–1.189 Fe2+/100 g seeds, respectively (Rybiński et al., 2018).
The antioxidant potential of grass pea seeds has earlier been reported by several authors (Stanisavljević et al., 2013; Tamburino et al., 2012; Talukdar, 2012; Starzyńska-Janiszewska et al., 2011). In these determinations, FRAP, DPPH, and ABTS assays, as well as H2O2 scavenging, and β-carotene bleaching methods were employed.
3.3. Content of individual phenolic compounds
HPLC-MS was used for determination of phenolic compounds in grass pea. Results exhibited high (LAT 451) and low (LAT 494) antioxidant potential. Phenolic acids were the dominant phenolic compounds of grass pea (Table 3). The highest amounts found were syringic and sinapic acids. Ferulic, p-hydroxybenzoic, protocatechuic, and p-coumaric acids were present in much lower amounts. Only traces of gentisic acid were found. Phenolic acids were present in the form of free, esters, and glycosides. Syringic acid was determined mostly as free phenolic acid. Basic hydrolysis liberated the highest amount of sinapic acid from its esters. Relatively high amounts of p-hydroxybenzoic and syringic acids were liberated from glycosides after acidic hydrolysis. The contents of phenolic acids in the extract and seeds of LAT 451 were greater than those of LAT 494 (Table 3) Meanwhile the content of flavonoids in grass pea was very low. The presence of catechin, rutin, and isorhamnetin was confirmed using LC-MS (Table 4).
Click to view | Table 3. Content of phenolic acids in extracts and seeds from two grass pea cultivars |
Click to view | Table 4. Content of flavonoids in extracts and seeds from two grass pea cultivars |
The presence of phenolic acids is typical for legume seeds. Ferulic acid was previously determined in broad bean, red bean, green lentil, and red lentil; p-coumaric acid in adzuki bean, broad bean, faba bean, red bean, green lentil, and red lentil; protocatechuic acid in adzuki bean and faba bean; p-hyrdoxybenzoic acid in faba bean and red bean; sinapic in red bean and red lentil (Amarowicz and Shahidi, 2017, 2018; Amarowicz et al., 2008, 2009, 2010, 2017). In terms of flavonoid content, grass pea is clearly different from other legumes which are generally rich in flavonoids (Amarowicz et al., 2009).
3.4. Statistical analysis
The antioxidant activity of the grass pea extracts was correlated with the content of total phenolics (Figure 1). The correlation coefficients between total phenolics and the results of ABTS and FRAP assays were 0.854 and 0.958, respectively. This correlation was also observed in the results of both assays (r = 0.890). It is interesting that in the study of European lines of grass pea correlation between total phenolics and FRAP was much lower (r = 0.781). Amarowicz et al. (2004) and Orak et al. (2015, 2016) previously reported previously similar correlation between the content of total phenolics in leguminous extracts.
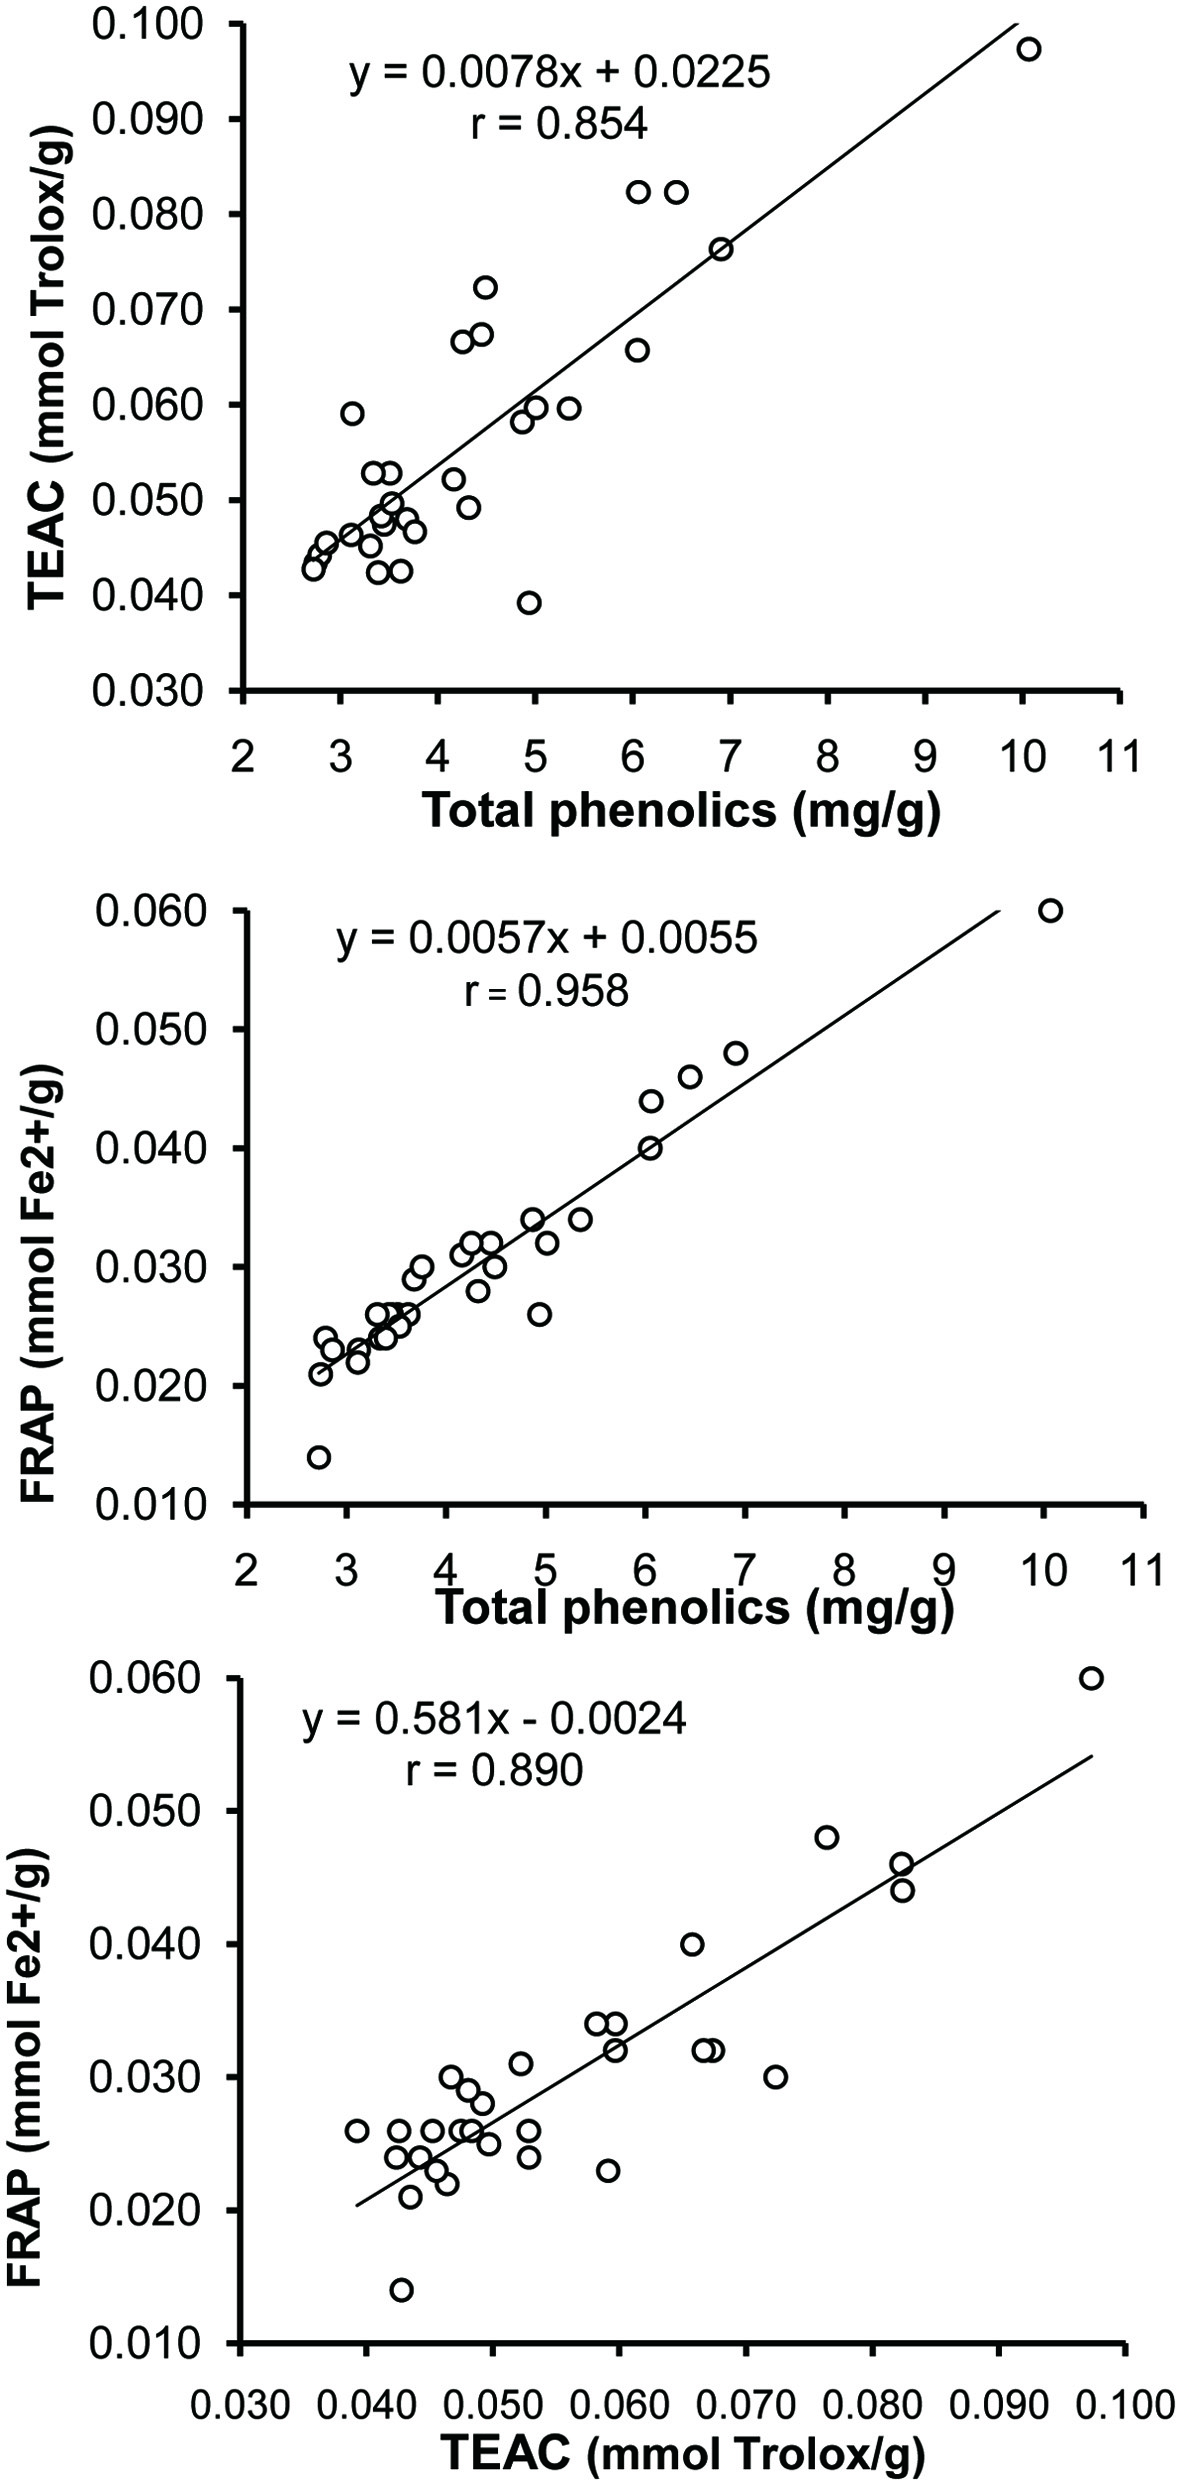 Click for large image | Figure 1. Correlation between the total phenolics content and the results of ABTS and FRAP assays and results of the two antioxidant assays. |
In the principal component analysis (PCA) (Figure 2), the two first components accounted for 99.0% of the total variability between the Lathyrus sativus varieties. The greatest Mahalanobis distance was recorded for grass pea from Iran (25-LAT 451), Canada (29-Canada C), Hungary (20-LAT 494), and Slovakia (5-LAT 470 and 4-LAT 469). Taken under consideration grass pea seeds from Slovakia (samples 4–11 in Figure 2), discrimination of the sample geographical origin by PCA was rather difficult.
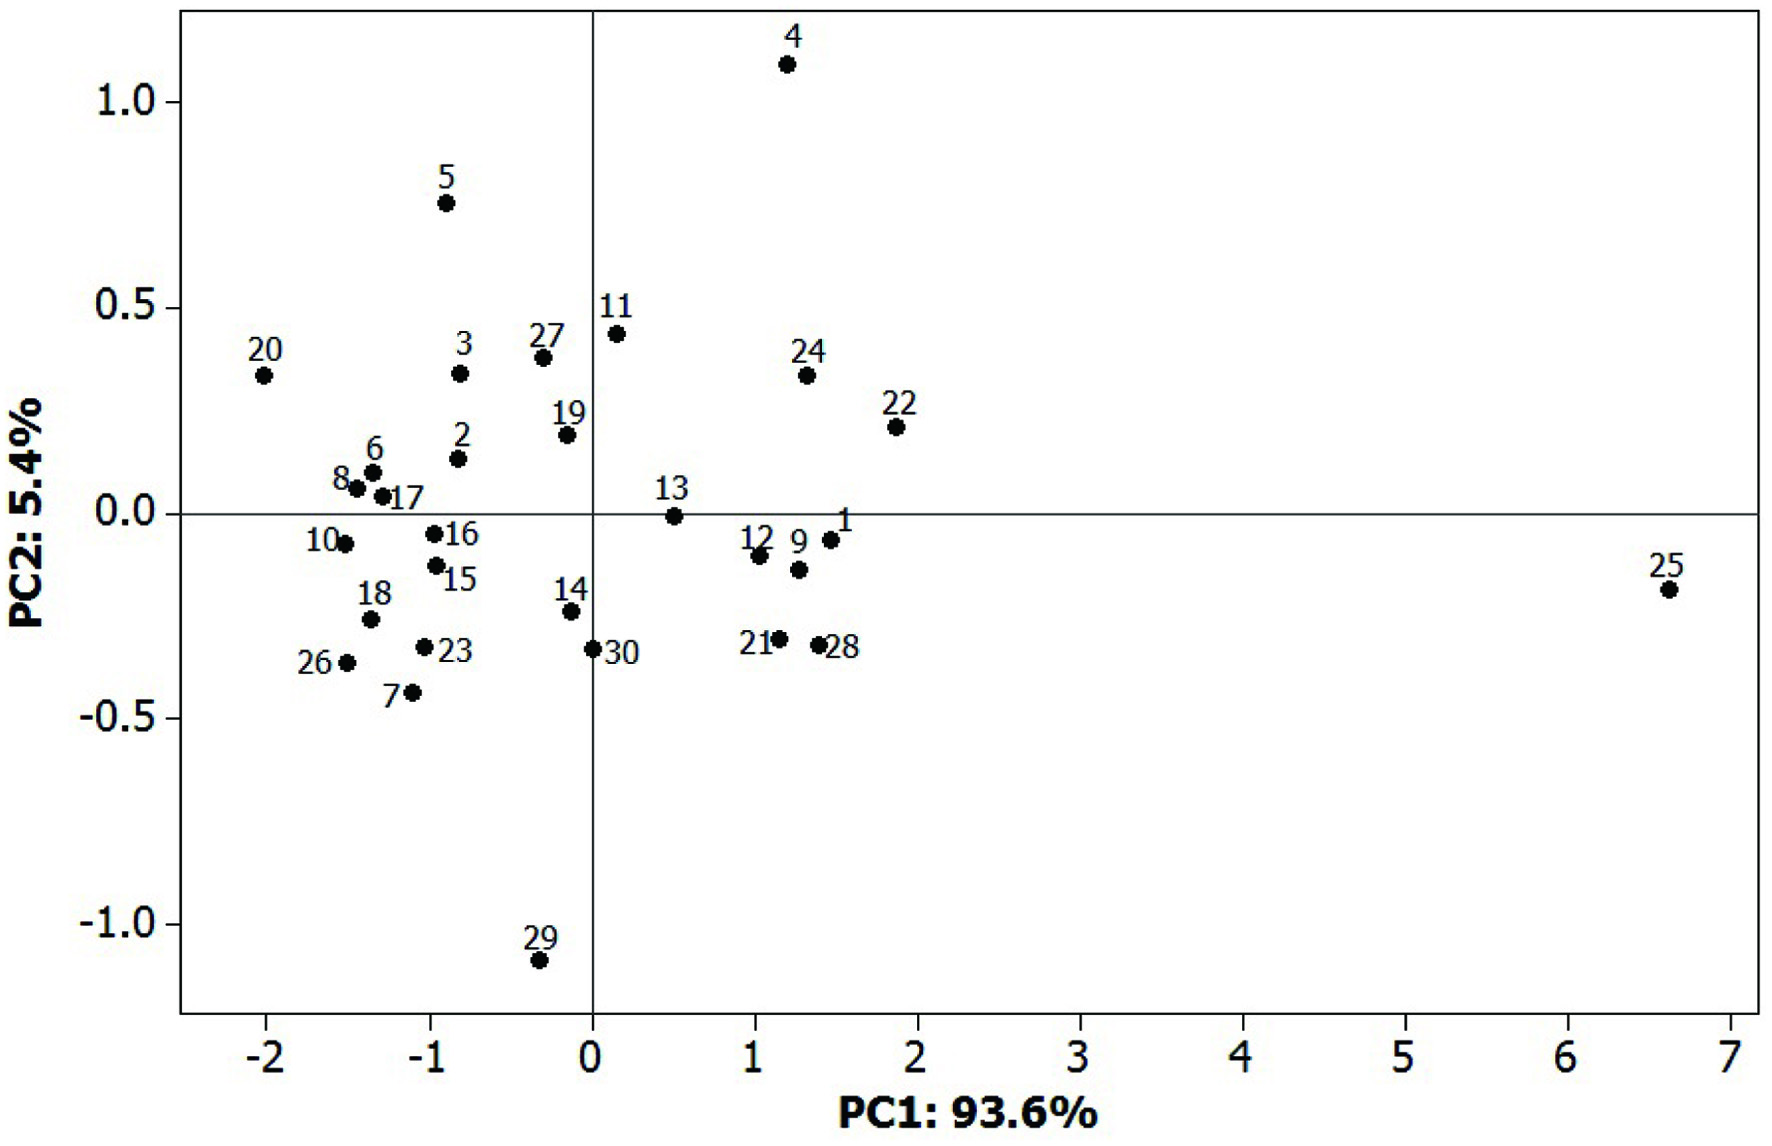 Click for large image | Figure 2. Results of the principal component analysis (PCA). |
The hierarchical cluster analysis (Figure 3) confirmed that grass pea from Iran (25-LAT 451) was different from other samples. The presence of similar pairs of grass peas accessions from different countries (e.g., 24 from Bulgaria and 29 from Canada; 14 from Russia and 30 from Chile; 22 from India and 28 from Ethiopia) confirms the limitation of the hierarchical cluster analysis for the discrimination of the geographical origin of grass pea sample.
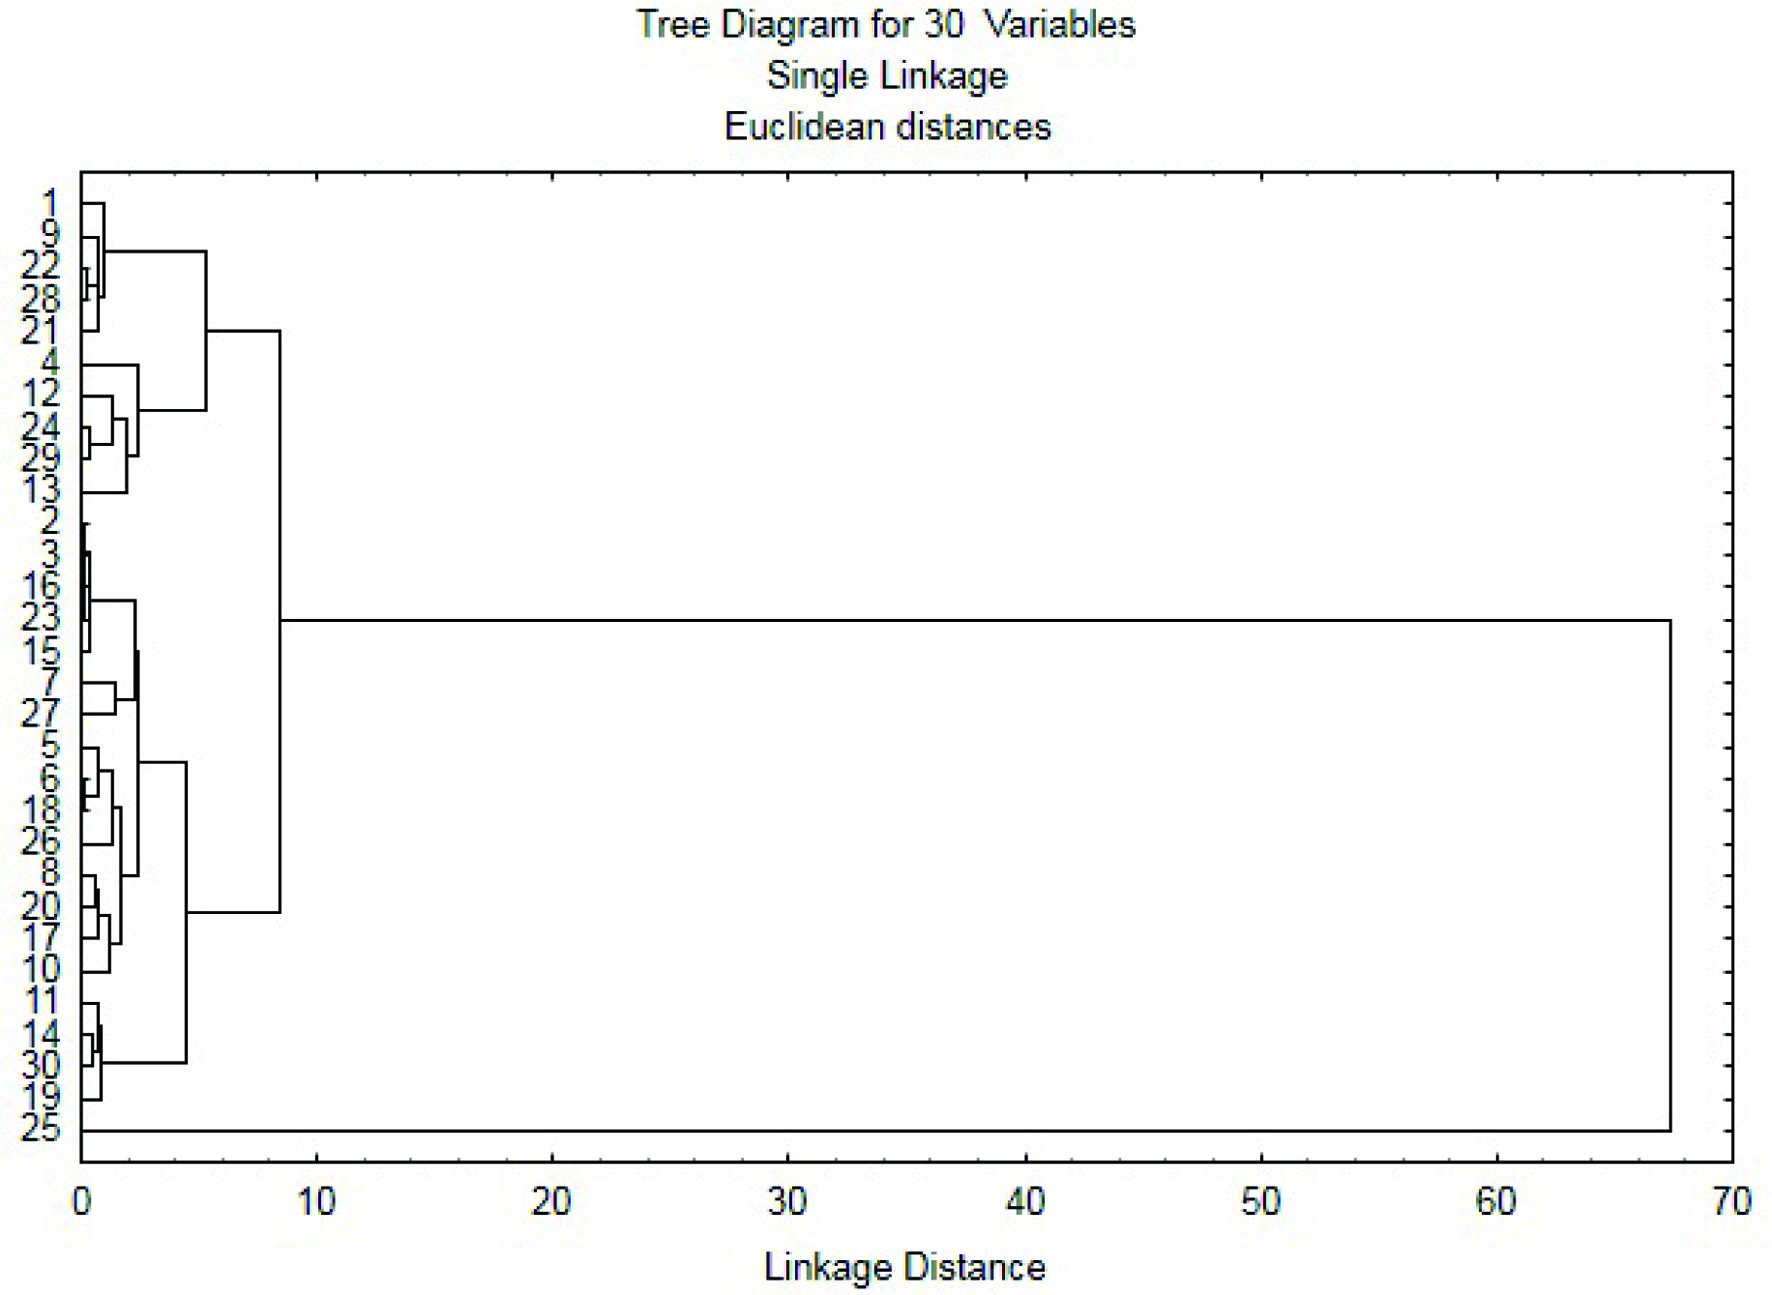 Click for large image | Figure 3. The hierarchical cluster analysis. |
| 4. Conclusion | ▴Top |
Grass pea is a potential legume crop with antioxidant potential similar to that of white bean and pea. Antioxidant activities of grass pea extracts (results of ABTS and FRAP assays) are strong correlated with the content of total phenolics. Application of the PCA and hierarchical cluster analysis for the discrimination of the grass pea sample geographical origin is limited.
| References | ▴Top |