| Journal of Food Bioactives, ISSN 2637-8752 print, 2637-8779 online |
| Journal website www.isnff-jfb.com |
Original Research
Volume 9, March 2020, pages 58-69
Low frequency, high power ultrasound: a non-thermal green technique improves phenolic fractions (free, conjugated glycoside, conjugated esters and bound) in fermented seabuckthorn beverage
Kelly Dornana, Aynur Gunenca, Azza Ferichichib, Farah Hosseiniana, c*
aFood Science, Chemistry Department, Carleton University, Ottawa, ON, Canada
bUniversity of Tunis El Manar, Tunis, Tunisia
cInstitute of Biochemistry, Carleton University, Ottawa, ON, Canada
*Corresponding author: Farah Hosseinian, Food Science, Chemistry Department, Carleton University, Ottawa, ON, Canada. Tel: +1 613 520-2600, ext. 2048; Fax: +1 613 520-3729; E-mail: farah.hosseinian@carleton.ca
DOI: 10.31665/JFB.2020.9219
Received: March 4, 2020
Revised received & accepted: March 31, 2020
| Abstract | ▴Top |
Phenolic compounds were characterized after traditional extraction method (TEM) and ultrasound-assisted extractions (UAEs) for 10 min (US10) and 15 min (US15). Four fractions (free, bound, conjugated esters, and conjugated glycosides) were obtained and characterized using RP-HPLC-PDA. The US10 extracted 22.1% (454.3 mg/kg) phenolic compounds while US15 extracted 66.6% (1,369.7 mg/kg) phenolic compounds compared to traditional extraction method (TEM) after 1 hr of extraction. US10 and TEM extracted a similar amount of aglycones (112.3 ± 4.0 and 109.0 ± 12.9 mg/kg, respectively) while US15 showed a significant decrease in aglycone extraction (58.9 ± 4.1 mg/kg) (P < 0.05). In seabuckthorn kombucha, US decreased initial microbial load by 2.6 log CFU/mL, increased ORAC value by 3% and increased water solubility index (WSI) by 40% (from 6.64 to 9.29 g/g) without syneresis. Results from this study suggest that application of US can enhance phenolic functionality during fermentation and is capable of decreasing syneresis, increasing oil yield, decreasing microbial load, and increasing ORAC with minimal loss of nutritional quality.
Keywords: Kombucha; Phenolics; Rancimat; SCOBY; Seabuckthorn; Ultrasound
| 1. Introduction | ▴Top |
Seabuckthorn berries (SB) are small-sized berries that grow on deciduous shrubs, with some varieties capable of surviving Canadian winters (Schroeder et al., 2014). The health promoting property of SB is attributed to their high antioxidant content, including ascorbic acid, tocopherols, carotenoids, anthocyanins and other phenolic compounds (Chauhan et al., 2001). Phenolic compounds, secondary metabolites in plants, exists in free, bound or conjugated (glycoside or ester) form. The free, or aglycone, form is typically more bioavailable due to its low molecular weight and lipophilicity making it ready for passive diffusion across the intestinal membrane (Bilal Hussain et al., 2018).
SB have been shown to increase probiotic viability when added to yogurt (Gunenc et al., 2016). Its functional phenolics and high antioxidant content make SB an ideal starting ingredient for production of a health promoting kombucha-like beverage. Kombucha (K) is a fermented beverage traditionally made with sweetened tea and a symbiotic culture of bacteria and yeast (SCOBY) (Chakravorty et al., 2015). There are products on the market using SB juice and leaves and SCOBY to create a semi-clear sparkling K beverage. The oil from the seed and pulp of SB are commercially available and highly sought after for their, high unsaturated fatty acids, phytosterols, and fat soluble vitamins A and E content (Olas, 2018). In this study, we investigated the use of whole SB, including pulp and seeds, in the fermentation process.
Application of ultrasound (US) to a liquid acoustic cavitation generates micro-bubbles that grow rapidly and collapse, producing an area of high temperature and high pressure that leads to production of a shockwave capable of disrupting the biological cell wall (Cruz-Cansino et al., 2016). Through this same phenomenon, US has been shown to be a promising and versatile nonthermal technology for increase extraction of phenolics; as an emerging preservation technique to decrease spoilage and pathogenic microorganisms in fruit juice with minimal nutritional loss; and can also be used as an emulsifier by promoting of small and even sized crystals which was of particular interest in this study due to the high oil content of SB.
Our aim was to investigate use of US for phenolic extraction and characterization of whole SB and for fermentation of diluted whole SB and its effects on physicochemical properties. Moisture content, juice yield, pH, acidity, and total phenolics content (TPC) of SB were measured before and after US. Moisture, protein, ash and fat content were determined for dilute SB puree without (P) and with US (P+US). Total microbial count, oxidative stability, oxygen radical absorbance capacity (ORAC), vitamin C concentration, water solubility index (WSI), and water absorption index (WAI), were also determined for P and P+US, as well as for fermented diluted seabuckthorn purée (K), fermented diluted seabuckthorn purée with US (K+US), fermented diluted seabuckthorn purée with sugar (K+S), and fermented diluted seabuckthorn purée with sugar and US (K+S+US).
| 2. Materials and methods | ▴Top |
2.1. Chemicals and reagents
Sodium chloride, sodium hydroxide, phenolphthalein, agar, and ascorbic acid were from Bioshop Canada Inc. (Burlington, ON, Canada). Nutrition broth with 1% peptone was from HeMedia Laboratories (West Chester, PA, USA). Trolox, fluorescein, rutin, AAPH, potassium iodide, potassium iodate, N-hexane (99%), Folin-Ciocalteu reagent, sodium carbonate, and chlorogenic acid were from Sigma (Canada Ltd., Oakville, ON, Canada). Sulfuric acid, methanol, acetonitrile were from VWR International (Radnor, PA, USA). Hydrochloric and formic acid were from Anachemia (Montreal, QC, Canada) Ethyl ether was from Fisher Chemical (Ottawa, ON, Canada). Phenolic acid standards (over 98% pure): gallic, proto-catechuic, chlorogenic, caffeic, vanillic, syringic, p-coumaric, ferulic, o-coumaric, trans-cinnamic; and flavonoid standards: catechin, rutin, myricetin, quercetin, apigenin and kaempferol, were purchased from Sigma-Aldrich (St. Louis, MO, USA).
2.2. Chemical properties: pH, % acidity, total soluble solids, total phenols content
The pH of pureed SB before and after US was measured using a bench top pH-meter (Thermo Scientific, United States). Titratable acidity was determined using a sodium hydroxide standard solution and phenolphthalein indicator and results are expressed as % acidity (Vitas et al., 2018). Total soluble solids (TSS), expressed as °Brix, were measured using a refractometer (Erma, Japan). Total phenolic content (TPC) was determined using the Folin-Ciocalteu method (Kostecka-Gugala et al., 2015; Vitas et al., 2018) by mixing 0.1 mL of samples with 7.9 mL of distilled water, 0.5 mL of Folin-Ciocalteu reagent and 1.5 mL of sodium carbonate (20%, w/w). Absorbance was measured at 750 nm after a 1 hr incubation at room temperature. Blank consisted of the same reaction mixture with distilled water replacing sample. A chlorogenic standard curve was prepared. Results are expressed as chlorogenic acid equivalents per mL of sample (mg CAE/mL).
2.3. Fractionation and characterization of phenolic compounds in SB
2.3.1. Extraction of crude phenolics
Whole SB (H. rhamnoides cv. Sunny) kindly provided by Omega Fruit (Magog, QC, Canada), were freeze-dried and powdered using a grinder. Free, conjugated and bound phenolics were extracted according to a method used by Gunenc et al. (2015) and Arimboor et al. (2008). Two grams of powdered whole berries were defatted by mixing with 10 mL of hexane for 1 hr at room temperature. The mixture was filtered, and the extraction was repeated. The residue was dried in an oven at 40 °C and then extracted with 70% methanol (1:10 w/v) traditionally for 1 hr at room temperature; with direct high power, high intensity, low frenquency ultrasound treatment (90 W, 20 kHz) using a UIP500hd ultrasonic processor (Hielscher, Germany) for 10 min and 15 min, respectively. The mixture was filtered, and the extraction was repeated one more time. The filtrates were combined, dried under vacuum at <50 °C and referred to as crude phenolic extracts.
2.3.2. Fractionation of phenolic compounds
The residue from the previous extraction was dried in an oven at 40 °C, re-dissolved in 40 mL 2 M NaOH and mixed for 4 hr at room temperature. The mixture was then acidified to pH 2 using 6 N HCl and extracted with ethyl ether (3 × 40 mL) at room temperature. The ethyl ether extracts were combined and evaporated under vacuum at <40 °C and referred as the bound phenolics fraction. For extraction of free and conjugated phenolics, crude phenolic extracts were dissolved in 10 mL of water, acidified with 6 N HCl to pH 2, and extracted with ethyl ether (3 × 10 mL) at room temperature. The ethyl ether extracts were combined and evaporated under vacuum at <40 °C and referred to as the soluble free phenolics fraction. The water phase was neutralized using 2 M NaOH and dried to near dryness under vacuum at <40 °C, dissolved in 10 mL of 2 M NaOH and mixed for 4 hr at room temperature. The solution was then acidified to pH 2 and extracted with ethyl ether (3 × 10 mL). The ether phase was dried as before and analyzed as phenolics liberated from esters. The water phase was neutralized, dried as before and then hydrolyzed with 50 mL 2 M HCl for 30 min at 95 °C, cooled and extracted with ethyl ether (3 × 50 mL). The water phase was discarded while the ether phase was combined, dried as before and analyzed as phenolics liberated from glycosides. Samples were re-dissolved in methanol and filtered through 0.45 μm membrane filters (Celltreat scientific product, China) for HPLC analysis.
2.3.3. Chromatographic conditions
The Alliance® HPLC system e2695, Separation Module with the 2998 Photodiode Array Detector (PDA) from Waters (Milford, MA, USA) and Empower 3 software was used. A reverse phase (RP) column (Atlantis R T3, 150 × 4.6 mm, 5 μm) was used as the stationary phase with the column temperature maintained at 30 °C. A gradient elution was used for the mobile phase with 0.5% (v/v) formic acid in water (Solvent A) and 100% acetonitrile (Solvent B) at flow rate rate of 1 mL/min. The gradient program for solvent A was as follows: 0 min, 95% A; 0–35 min, 50% A; 35–40 min, 90% A; 40–50 min, 95% A. Chromatograms were recorded at 280 and 320 nm for phenolic acids and flavonoids, respectively.
2.4. Application of US for SB kombucha beverage
2.4.1. Sample preparation
Fresh whole SB (H. rhamnoides cv. Sunny) were puréed using a Vitamix blender for 2 min (Vitamix®, USA). A volume of dH2O equal to 30% of the original purée volume was added and blended. US (90 W, 20 kHz, 10 min) was applied to 200 mL of the diluted purée using a UIP500hd ultrasonic processor (Hielscher, Germany). Treatment time was chosen to limit degradation of nutrients and keep the sample fresh-like based on our preliminary optimization of ultrasound treatment. The diluted SB purée (P) and the diluted SB purée with ultrasonic treatment (P+US) were then stored at 4 °C. Some sample was also freeze-dried for analysis. Freeze drying was done using a Labconco freeze dryer/lyophilizer (Kansas CIty, MO, USA). The samples were first frozen at −80 °C and then freeze dried at −50 °C for 3 days using vacuum pressure and sublimation to remove unbound water without the use of heat.
2.4.2. Moisture content
Moisture content was determined by lyophilization and calculated according to the AOAC official method 930.04 (AOAC, 1998a). After preparation, P and P+US were weighed and freeze dried at −50 °C for 3 days. After freeze-drying the samples were weighed again and water content was calculated and expressed as % moisture.
2.4.3. Protein content
Dumas method was used to determine protein content for P and P+US. The protocol was based on the AOCS official method Ba 4e-93 (AOCS, 2017a). After freeze-drying, 1 mg of sample was added to tin weigh boats. Apple leaves were used as the standard. Samples were combusted in an oxygen-enriched atmosphere at a high temperature using N-cube. Vario Micro software was used to measure % N in the sample. Assuming that nearly all nitrogen in the sample is present as amino acids in proteins, a default Jones factor of 5.6, as proposed by Mariotti et al. (2008), was used to calculate protein content (% protein) on a dry basis.
2.4.4. Fat content
Seeds were separated from pulp and crushed using a mortar. Lipids were extracted according to the method of Ferreira-Dias et al. (2003). Lipid extracts were obtained in a Soxhlet apparatus for 5 h at the boiling point (67–69 °C) of n-hexane. A ratio of crushed sample to solvent of 1:6 (m/v) was used. The solvent was evaporated using a rotary evaporator at 40 °C (Kozlowska et al., 2016). The oil samples were weighed, and fat content was calculated and expressed as % fat.
2.4.5. Ash content
Dry ash method was used based on the AOAC official method 930.05 (AOAC, 1990). Freeze-dried samples of P and P+US were used to determine ash content. Samples were weighed and pre-ignited using a muffle furnace at 550 °C and left overnight. Remaining ash was weighed, and ash percentage was calculated.
2.4.6. Fermentation protocol for SB kombucha
Four samples of kombucha (K) were made: K, K+US, K+S, and K+S+US. All samples were prepared using 200 mL of P or P+US and 12.5 g of SCOBY. K consisted of P and SCOBY. K+US consisted of P+US and SCOBY. K+S consisted of P, 15.0 g of sucrose and SCOBY. K+S+US consisted of P+US, 15.0 g of sucrose and SCOBY. All samples were left to ferment in a dark place at room temperature for five days. A second US treatment (90 W, 20 kHz,10 min) was applied to K+US and K+S+US to halt fermentation on day 5. All samples were then stored at 4 °C. Part of the samples were freeze-dried, at −50 °C for 3 days, on day 5 of fermentation and stored at −20 °C for further analysis (WSI and WAI).
2.4.7. Total microbial count
The total microbial count, based on the ISO method 4833 (1991), was used to determine the log colony forming units (log CFU/mL). Samples were diluted in saline solution and plated on nutrient broth agar. Plates were incubated at 30 °C for 48 hr before enumeration. Total count was determined on day 0, 2, 5, 14 and 21 for all samples.
2.4.8. Oxidative stability
Oxidative stability was determined, according to the AOAC official method Cd12b-92 (AOCS, 2017b), on day 0 for P and P+US, and on day 5 of fermentation for K, K+US, K+S, K+S+US using Rancimat (Metrohm, Switzerland). For this, 3 g of sample was used and Rancimat was set at 120 °C with air flow at 20 L/h.
2.4.9. Oxygen radical absorbance capacity (ORAC)
ORAC was used to determine the antioxidant activity on day 0, 7, and 21 for P and P+US and on day 2, 5, and 21 for kombucha samples (K, K+US, K+S, K+S+US) based on protocol adapted from Huang et al. (2002). Antioxidant standard was trolox, peroxyl radical generator was AAPH, positive control was rutin, and probe was fluorescein. Samples were centrifuged at 4,000 RPM for 20 min and the supernatant was used to measure ORAC. The standards, samples and rutin were placed in a 96-well fluorometric microplate. Fluorescein was added to each well. The plate was incubated at 37 °C for 20 min before adding AAPH. Absorbance was read using the FLx800TM Multi-Detection Microplate Reader with Gen5TM software (excitation wavelength=485 nm; emission wavelength= 525 nm) for 60 min. Final ORAC values were calculated using a Trolox standard curve and the measured net AUC for each sample. Values are expressed as µmol Trolox equivalent per L of sample (µmol TE/L).
2.4.10. Vitamin C
Vitamin C concentration was determined on day 0 for P and P+US, and on day 5 of fermentation for K, K+US, K+S, K+S+US using protocol adapted from Sapei and Hwa (2014). Direct titration was used with a vitamin C standard solution, a 3% starch solution as indicator, and an iodine solution as titrant.
2.4.11. Water solubility index (WSI) and water absorption index (WAI)
WSI and WAI was determined using protocol adapted from Kyriakopoulou et al. (2013) on day 0 for P and P+US, and day 5 of fermentation for K, K+US, K+S, K+S+US by dissolving 1.00 g of freeze dried sample in 25.00 mL of ddH2O, and then centrifuging at 4,000 RPM for 20 min. Supernatant was separated and freeze dried at −50 °C for 3 days. Remaining hydrogel was weighted, and the WAI was calculated as:
2.5. Statistical analysis
All trials were done in triplicates and results presented as means ± standard deviations. One-way ANOVA was performed for each set of results using Statistical Analysis System (SAS) software (SAS Institute Inc., Cary, NC, USA). Statistical significance was set at P < 0.05.
| 3. Results and discussion | ▴Top |
3.1. Chemical properties
Chemical properties for SB with and without US are presented in Table 1. Moisture content of SB was 80% and juice yield was 66.10%. SB are acidic with a pH between 2.60 and 2.80 and acidity between 2.80 and 2.90% measured in this study. TSS in fresh SB was measured as 8.20 °Brix. These results are similar to those published by Beveridge et al. (1999). Sonication of SB had no effect on moisture content, juice yield, pH, % acidity, and/or TSS with only slight variations observed, as seen in Table 1. TPC of SB measured in this study was 550 mg chlorogenic acid equivalent/100 g, higher than 175.25 mg gallic acid equivalent/100 g reported by Araya-Faria et al. (2011) but lower than 964 to 10 704 mg gallic acid equivalent/100 g reported by Korekar et al. (2014). Phenolics are secondary metabolites produced by plants that defend against oxidative stress, considered antioxidants capable of scavenging free radicals (Vitas et al., 2018). US led to a 9% increase in TPC (600 mg CAE/100 g) compared to SB without US (550 mg CAE/100 g) possibly through disruption of cell wall, by acoustic cavitation, and release of phenolic compounds into the solution (Golmohamadi et al., 2013).
 Click to view | Table 1. Chemical and nutritional analysis of seabuckthorn berries |
3.2. Fractional extraction of phenolic compounds from SB
UAE can be used to decrease the time required for extraction of phenolics compounds compared to traditional methods. The phenomenon of acoustic cavitation, as a result of repeated compression and expansion of bubbles when acoustic waves propagate through an aqueous medium, increases extraction power. The rarefaction of sound waves in an aqueous medium produce bubbles that compress and expand creating an area of high temperature and pressure leading to implosion of the bubble. This implosion creates microstreams within the solvent capable of penetrating and disrupting cell walls ultimately increasing solvent penetration and release of solutes within cells (Ashokkumar, 2015). In this study we used high power (90 W) low frequency (20,000 kHz) direct US with two different treatment times (10 min & 15 min) to compare and characterize different fractions (bound, conjugated esters, conjugated glycosides, and free) of phenolic compounds found in defatted whole SB with a traditional extraction method (1 hr). The results are presented in Figure 1 and Table 2, and are expressed as mg/kg of dry sample.
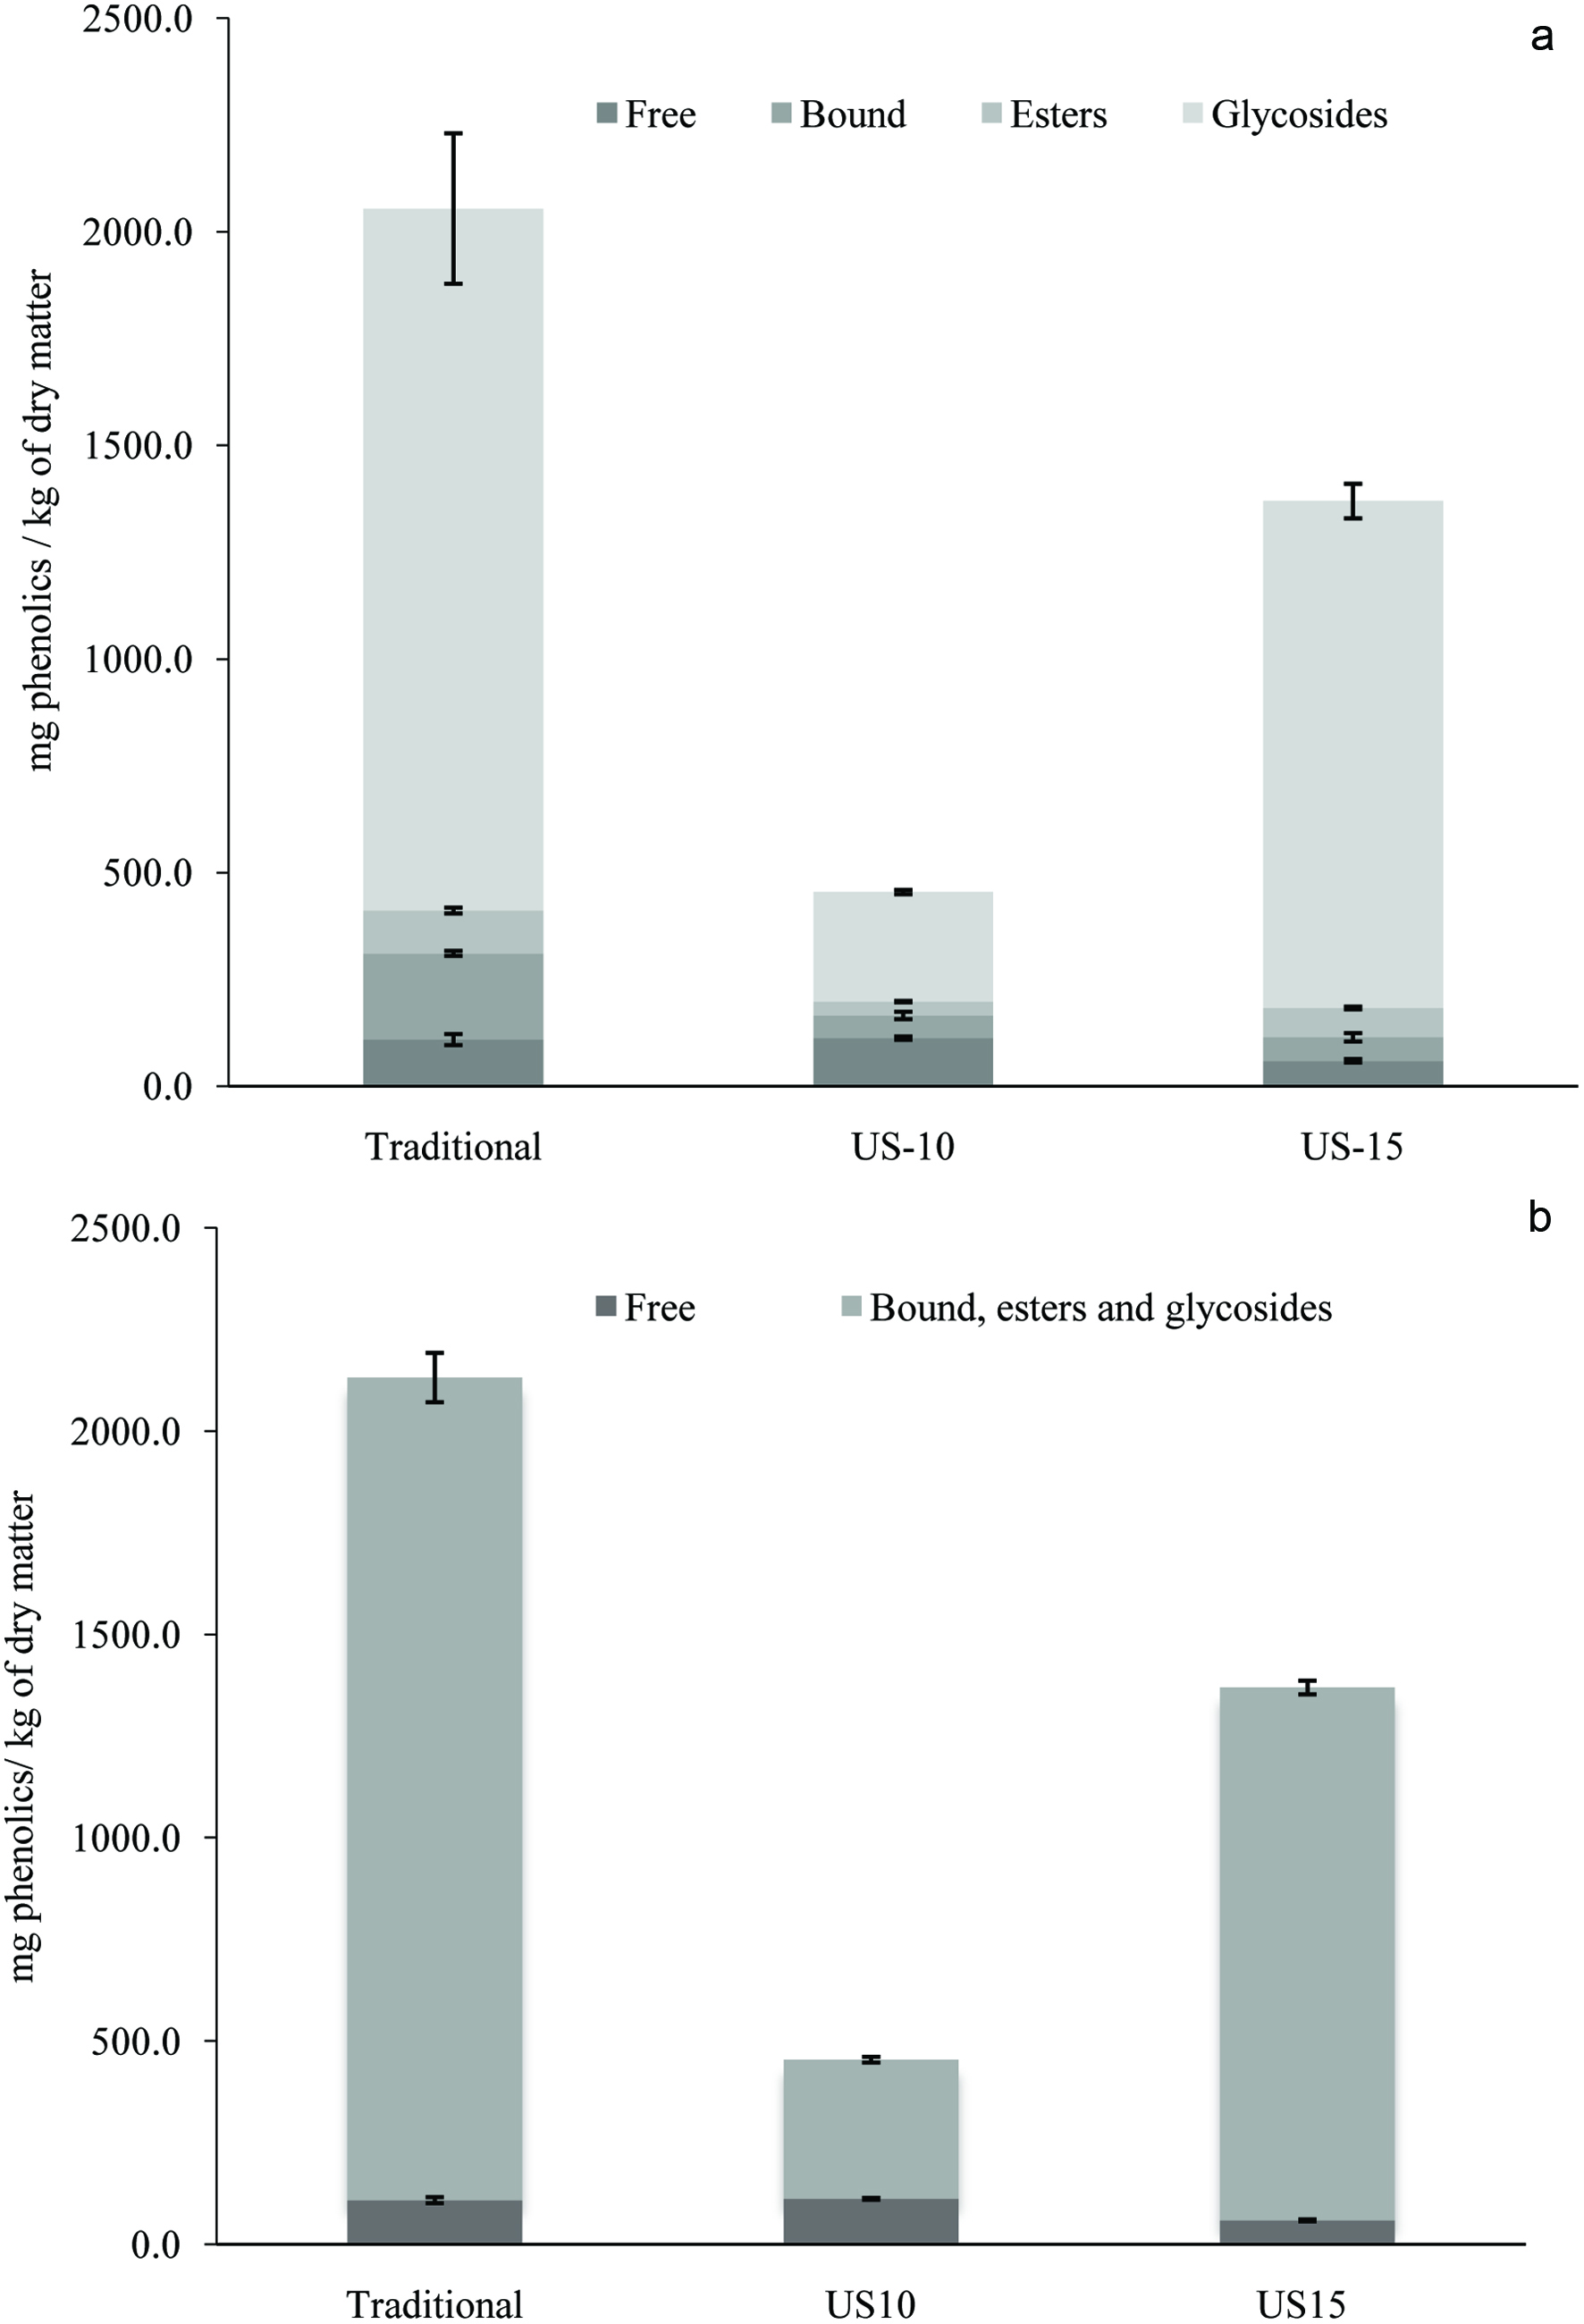 Click for large image | Figure 1. Phenolic fractional profile (free, bound, glycoside and ester conjugated (a) and free vs bound, glycoside and ester conjugated (b) of defatted whole SB using traditional (TEM), 10 min US (US10), and 15 min US (US15) assisted extractions. |
Click to view | Table 2. Free, bound, and conjugated phenolic acids and flavonoids in SB berries (mg/kg of dry matter) |
The total amount of extracted and characterized phenolic compounds was 2,054.4 mg/kg for the TEM, 454.3 mg/kg for US10, and 1,369.7 mg/kg for US15. Although neither UAE gave as high of a result as the TEM, a 201.5% increase was seen with the US15 compared to US10. Compared to the 1 hr TEM, the 15 min UAE extracted 66.7% of the phenolic compounds in a quarter of the time. This shows that US is an efficient method to extract phenolic compounds in less time.
For all extractions, Figure 1 shows the predominant fraction extracted was conjugated glycosides representing 80% of phenolic compounds extracted with TEM, 56.6% for US10, and 86.7% for US15. Conjugated esters represented 4.9% of phenolic compounds for TEM, 7% for US10, and 5% for US15. Only phenolic acids were found in bound form with this fraction representing 9.8% of phenolic compounds for TEM, 11.6% for US10, and 4.0% for US15. Free phenolic compounds represented 5.3% of phenolic compounds extracted for TEM, 24% for US10, and 4.3% for US15.
Gallic acid was the main phenolic identified in the glycoside conjugated fraction (1,492.7 ± 184.5 mg/kg for TEM, 212.1 ± 2.9 mg/kg for US10, 1,080.1 ± 48.5 mg/kg for US15). Other phenolic acids identified in the conjugated glycoside fraction were vanillic acid (52.5 ± 27.5 mg/kg) and P-coumaric acid (3.4 ± 0.9 mg/kg) for TEM, protocatechuic acid (25.3 ± 0.1 mg/kg) and vanillic acid (19.4 ± 5.8 mg/kg) for US10. Only gallic acid was identified in this fraction for US15. Identified glycoside conjugated flavonoids were kaempferol (68.6 ± 9.0 and 85.4 ± 9.2 mg/kg) and quercetin (26.5 ± 3.7 and 21.4 ± 2.9 mg/kg) for TEM and US15, respectively. No flavonoids were found in this fraction for US10.
Ester conjugated phenolic acids extracted and identified were ferulic acid (33.9 ± 7.0, 11.9 ± 2.7 and 31.6 ± 0.1 mg/kg), protocatechuic acid (24.8 ± 5.0, 6.9 ± 1.2 and 11.7 ± 2.8 mg/kg), p-coumaric acid (7.2 ± 3.2, 2.7 ± 0.8 and 7.8 ± 0.4 mg/kg) and vanillic acid (2.0 ± 0.8, 0.7 ± 0.1 and 0.7 ± 0.4 mg/kg) for TEM, US10 and US15, respectively. Rutin was the only ester conjugated flavonoid extracted and identified in all extraction methods, 32.5 ± 5.5 mg/kg for TEM, 10.0 ± 1.1 mg/kg for US10, and 16.2 ± 0.6 mg/kg for US15.
Only phenolic acids were identified in bound form. All phenolic acids tested were identified: protocatechuic acid (139.6 ± 5.3, 13.6 ± 2.9 and 13.6 ± 3.0 mg/kg), p-coumaric (39.3 ± 2.4, 26.7 ± 6.5 and 28.1 ± 4.1 mg/kg), ferulic acid (9.6 ± 1.8, 6.5 ± 0.4, and 5.4 ± 0.2), gallic acid (7.7 ± 1.0, 4.5 ± 1.1 and 6.6 ± 3.0 mg/kg), and vanillic acid (5.4 ± 0.8, 1.6 ± 0.2, and 1.6 ± 0.3 mg/kg) for TEM, US10 and US15, respectively.
Protocatechuic acid was the only phenolic acid identified in the free fractions for all samples (20.7 ± 2.3 mg/kg for TEM, 3.7 ± 0.5 mg/kg for US10, and 8.7 ± 0.9 mg/kg for US15). Flavonoids represented the bulk of this fraction, specifically rutin (39.0 ± 7.8, 23.4 ± 3.5, and 15.2 ± 0.7 mg/kg), quercetin (23.2 ± 5.4, 47.6 ± 0.1, and 19.4 ± 1.9 mg/kg), and kaempferol (18.9 ± 6.5, 37.7 ± 0.1, and 15.6 ± 2.0 mg/kg) for TEM, US10 and US15, respectively.
The importance of solubility and biotransformation of plant phenolics and food matrix have not been examined in much detail, as they ultimately effect phenolics bioavailability. Although phenolic/polyphenols are very abundant in our diet, majority of phenolics (e.g. proanthocyanidins/tannins, anthocyanins) are either very poorly absorbed or not absorbed at all. It has been reported only 5 to 20% of phenolics are ready for absorption and research evidences suggested that solubility of plant phenolics might be the primary reason that limit phenolic bioavailability. Transformation of lipophilic compounds into hydrophilic compounds is called heterologous compounds, in which compounds are easily absorbed and excreted in the human body (Karakaya, 2004; Kawabata et al., 2015; Shahidi et al., 2019). This means the plant phenolics in aglycone forms (more lipophilic) have higher absorption, bioavailability, and biotransformation than their bound, ester, and glycosidic forms. It is interesting to note that with US10 was able to extract a similar amount of aglycones (112.3 ± 4.0 mg/kg) compared with TEM (109.0 ± 12.9 mg/kg), both of which had a significantly higher free phenolics fraction compared to US15, see Figure 1. Furthermore, as seen in Table 2, no quercetin or kaempferol glycosides were observed for US10, as opposed to TEM and US15, while a significant increase in the aglycone form of these two flavonoids was observed for US10 compared to TEM and US15. This significant increase could be due to hydrolysis of the glycoside bond facilitated by US when comparing US10 to TEM. But when comparing US10 to US15, an extra 5 min of US led to a decrease in the free form of quercetin and kaempferol and a significant increase in their glycoside derivative. In this case the extra 5 min of US has a negative effect on the free form nature of the flavonoids either through degradation by radicals produced by US or reversion back to their glycosidic derivative perhaps facilitated by prolonged US. Although the significant increase of glycosidic derivatives in US15 compared to US10 is likely due to further extraction of these compounds as there exists no evidence that US may lead to glycosidic bond formation. US10 was chosen as having the optimal US treatment time to prevent degradation and get the higher amount of bioavailable aglycones.
3.3. Application of US for SB kombucha
3.3.1. Physical observations
Images were taken on day 0 and 21 for P and P+US, shown in Figure 2, and on day 0, 5 and 21 for kombucha samples, shown in Figure 3. On day 0, all sonicated samples (P+US, K+S+US, and K+US) were homogenous while syneresis can be seen in all non-sonicated samples (P, K+S, and K) approximately 2 h after sample preparation. By day 5 of fermentation, no phase separation is seen in all kombucha samples. The disappearance of syneresis in K and K+S by day 5 shows the emulsifying effect of fermentation, possibly explainable through hydrolysis of insoluble high molecular weight polysaccharides by SCOBY into soluble low molecular weight sugars (Septembre-Malaterre et al., 2018). By day 21 of storage, P+US remained homogenous. This shows that US alone is an effective emulsification technology for this product, with no syneresis observed in P+US for the whole study (21 days). All kombucha samples also remained stable for the whole study with no mold observed showing the preservative effects of fermentation. Based on visual observations, sonicated samples were also thicker in texture compared to non-sonicated samples, however, rheological study would be required to determine effect of US on physical characteristics.
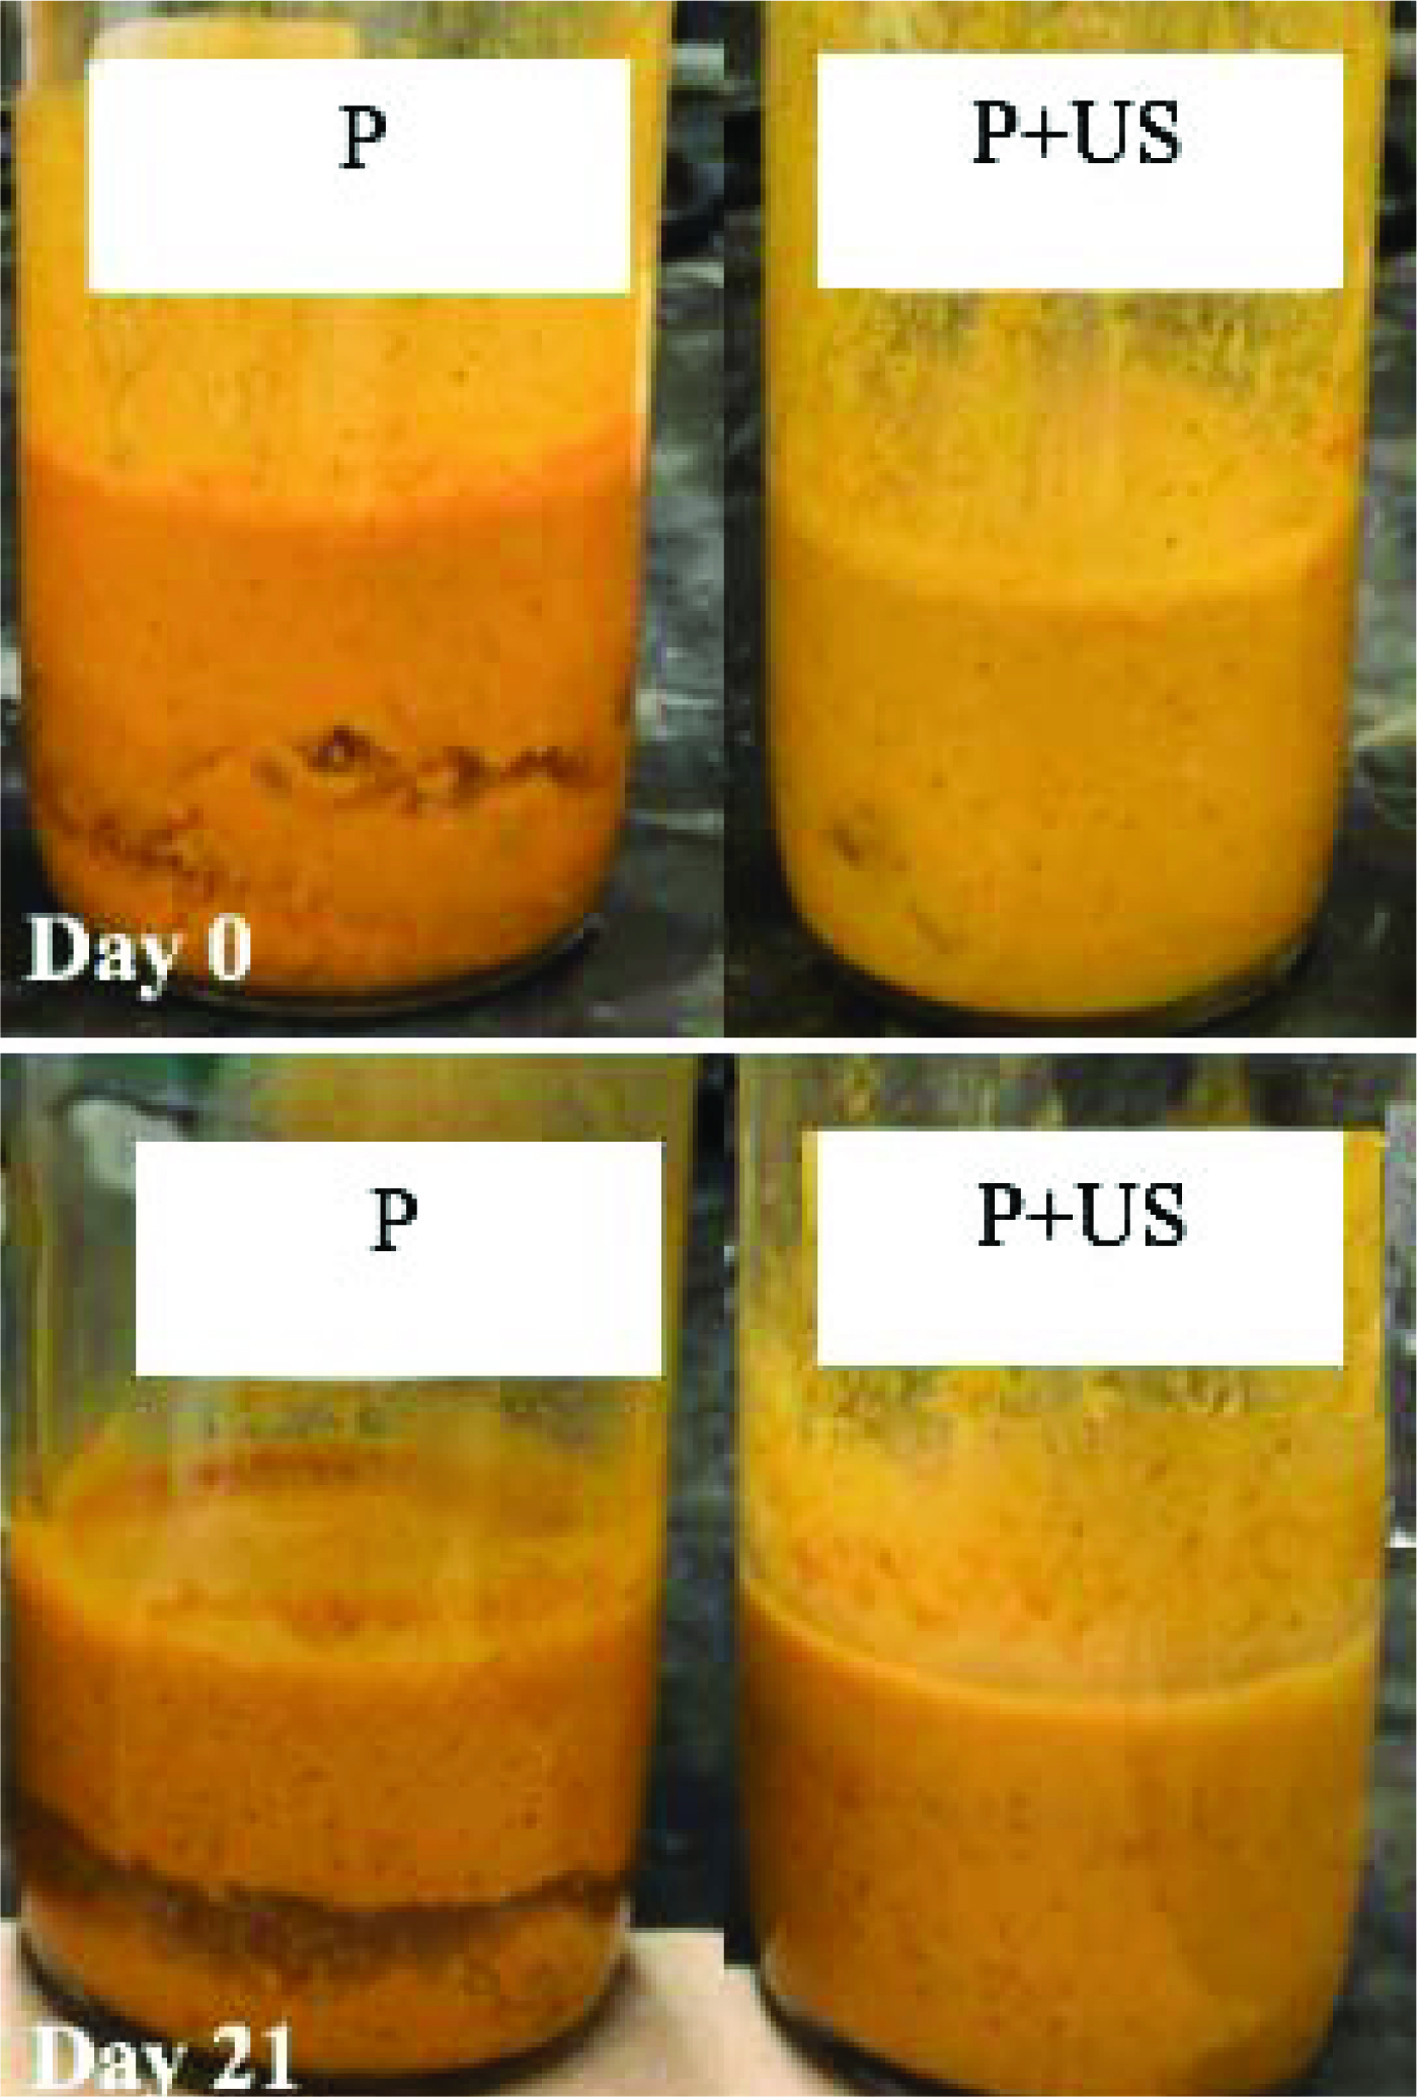 Click for large image | Figure 2. Seabuckthorn puree (P) without and with ultrasound treatment (P+US) on day 0 and 21. |
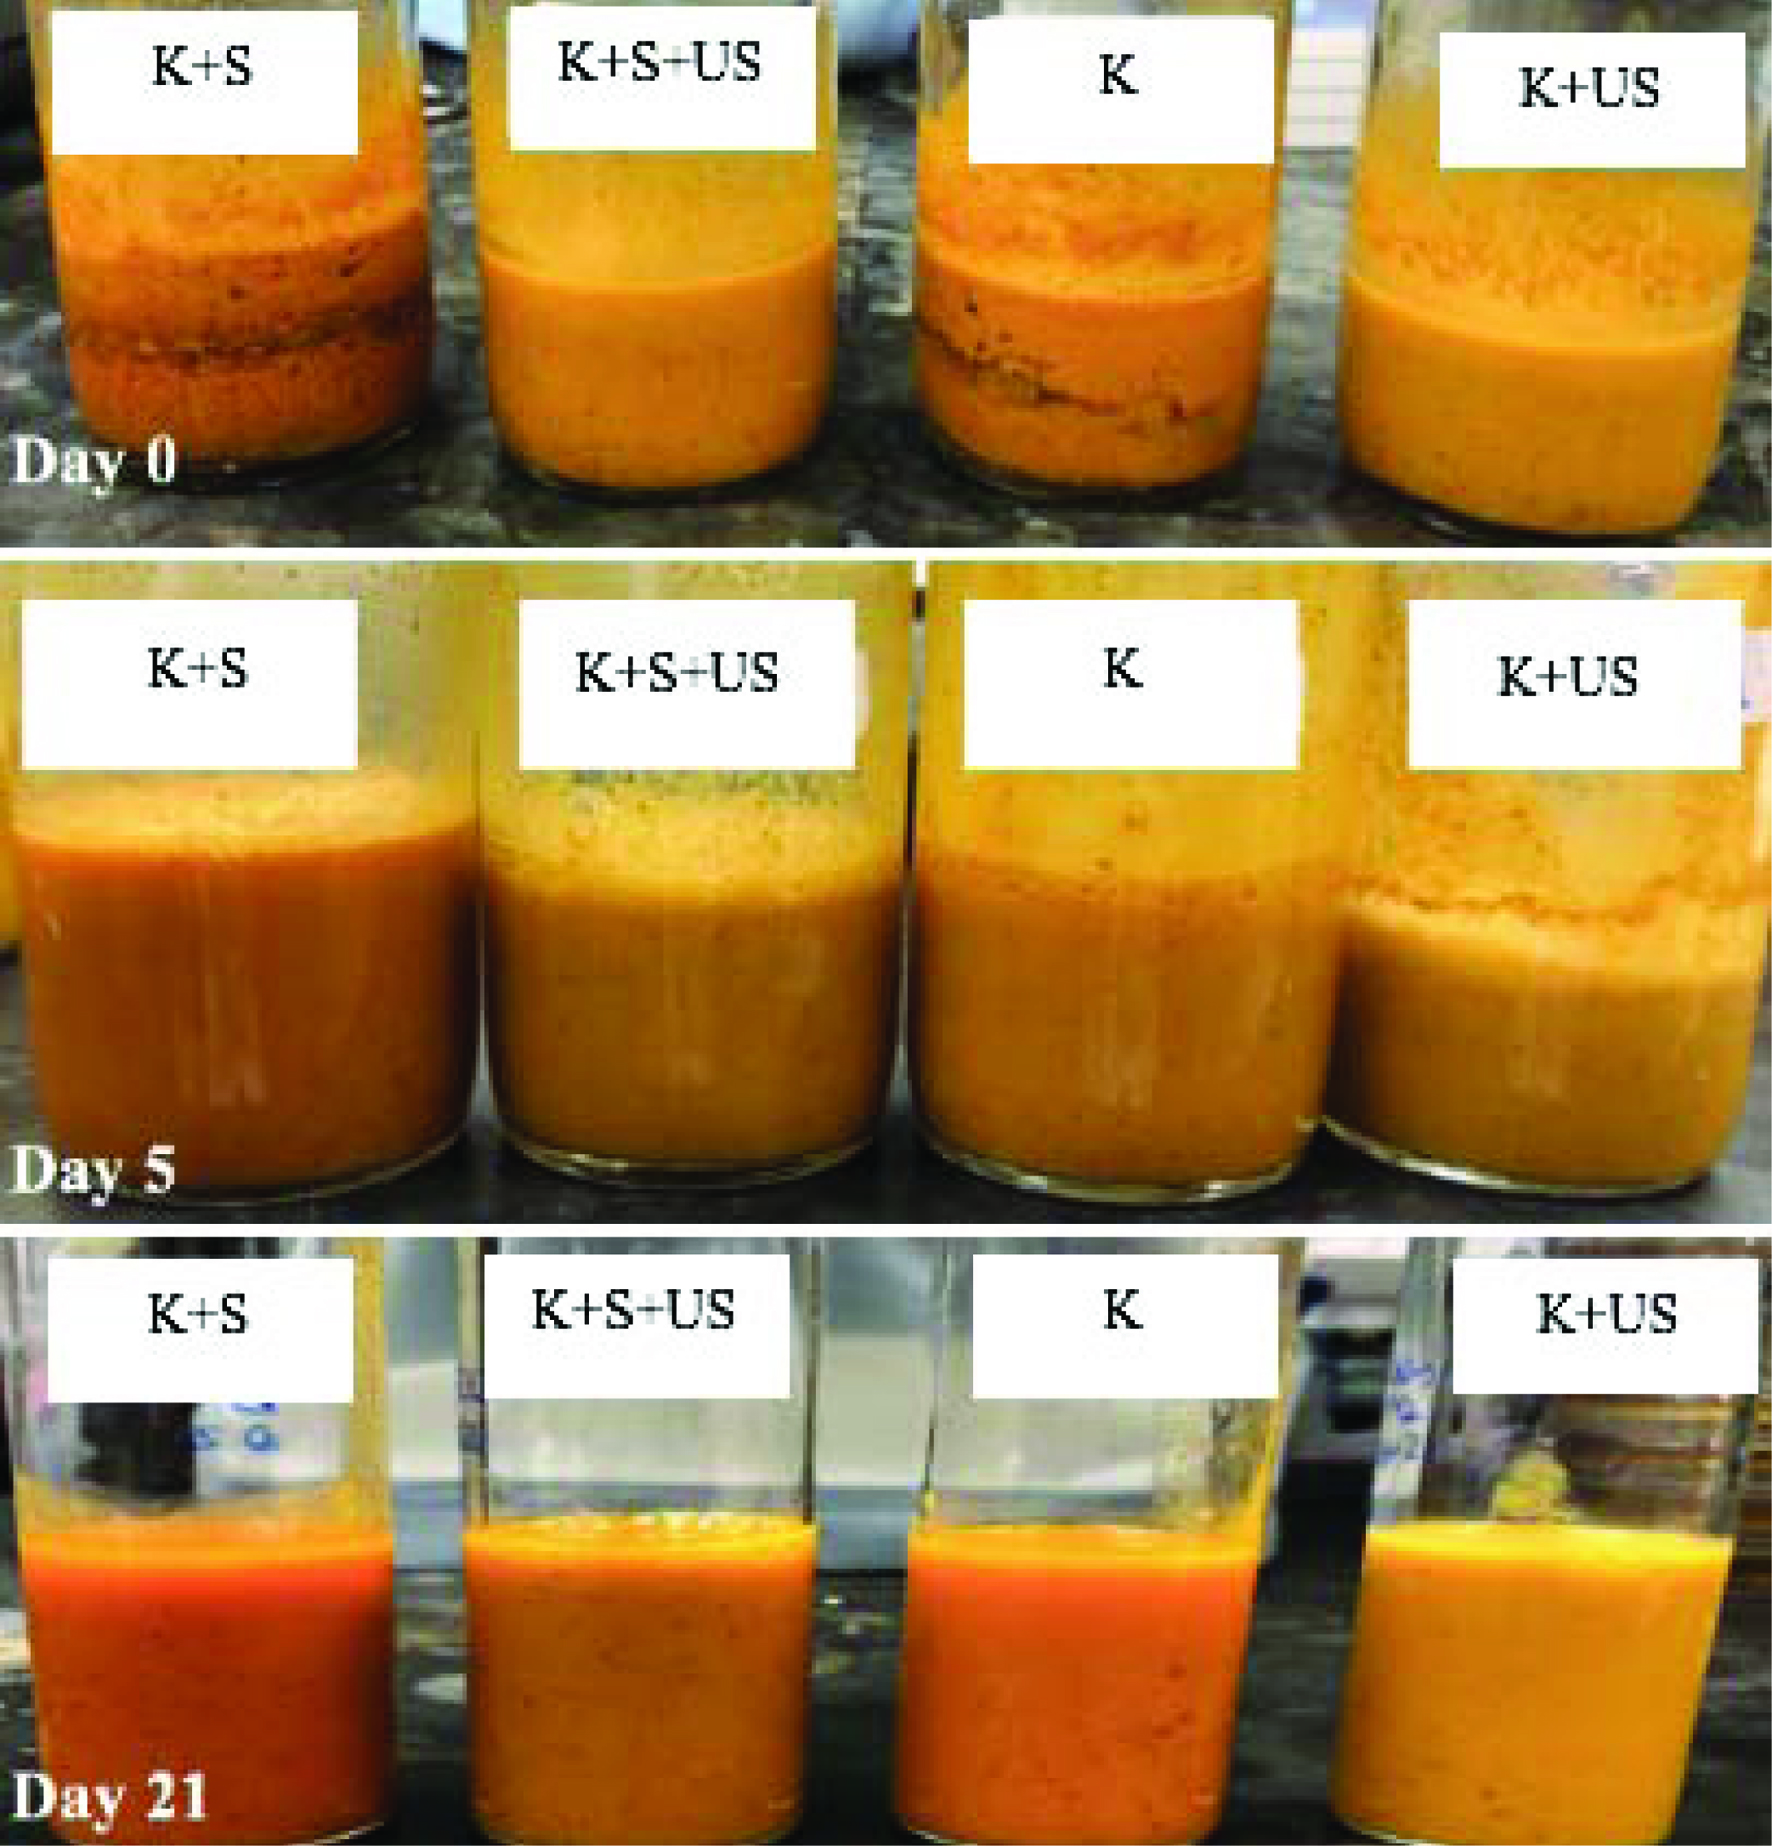 Click for large image | Figure 3. Kombucha (K) samples without and with sugar (S) and without and with ultrasound treatment (US) on day 0, 5 and 21. |
3.3.2. Nutritional properties
Moisture, ash, protein and fat content of P and P+US are presented in Table 3. US significantly (P < 0.05) increased by 10% extraction yield from pulp (from 19.04 ± 0.08 to 20.97 ± 0.29%) and by 7% for seed (from 14.81 ± 0.08 to 15.83 ± 0.28%). This increase in oil yield highlights the functionality of US as a green technology to maximize raw material value by increasing oil yield while reducing processing time, power consumption, and use of hazardous solvents (Hernandez-Santos et al., 2016). It has been shown that sonication can lead to higher extraction yields through disruption of the cell wall leading to increased solvent penetration and surface area between solvent and oil through agitation (Zhang et al., 2008).
Click to view | Table 3. Moisture, ash, protein and fat contents as percentage of P and P+US |
3.3.3. Total microbial count
To investigate US as a co-sterilizer, total microbial count (log CFU/mL) for each sample was measured and results are presented in Figure 4. The US treatment applied to P+US on day 0 resulted in a 2.5-log reduction in CFU/mL compared to P. By day 21, total microbial count was significantly lower (P < 0.05) in P+US compared to P with a 2.8-log difference in CFU/mL. This shows the efficacy US technology for reduction of microbial load. Also, on day 0, log CFU/mL of kombucha samples with US (K+US and K+S+US) was slightly lower than non-US samples (K and K+S). Also seen on day 0, sonicated kombucha samples had a slightly higher log CFU/mL compare to P+US due to microbial repopulation by SCOBY added after US. On day 2, there was an increase in log CFU/mL for all kombucha samples with no significant difference between them. A second US treatment was applied to K+US and K+S+US on day 5 which led to a 2.4 and 2-log decrease in total microbial count compared to K and K+S, respectively. A 2-log decrease was then observed for non-sonicated samples (K and K+S) on day 14 compared to day 5. This could be explained by the decrease in temperature on day 5 (stored at 4 °C) and by similar results seen by Ayed et al. (2017) who reported an initial increase in microbial count during fermentation of red grape juice and a decrease after day 6 attributed to a decrease in oxygen, creating an anaerobic and starved environment for the SCOBY (Chen and Liu, 2000).
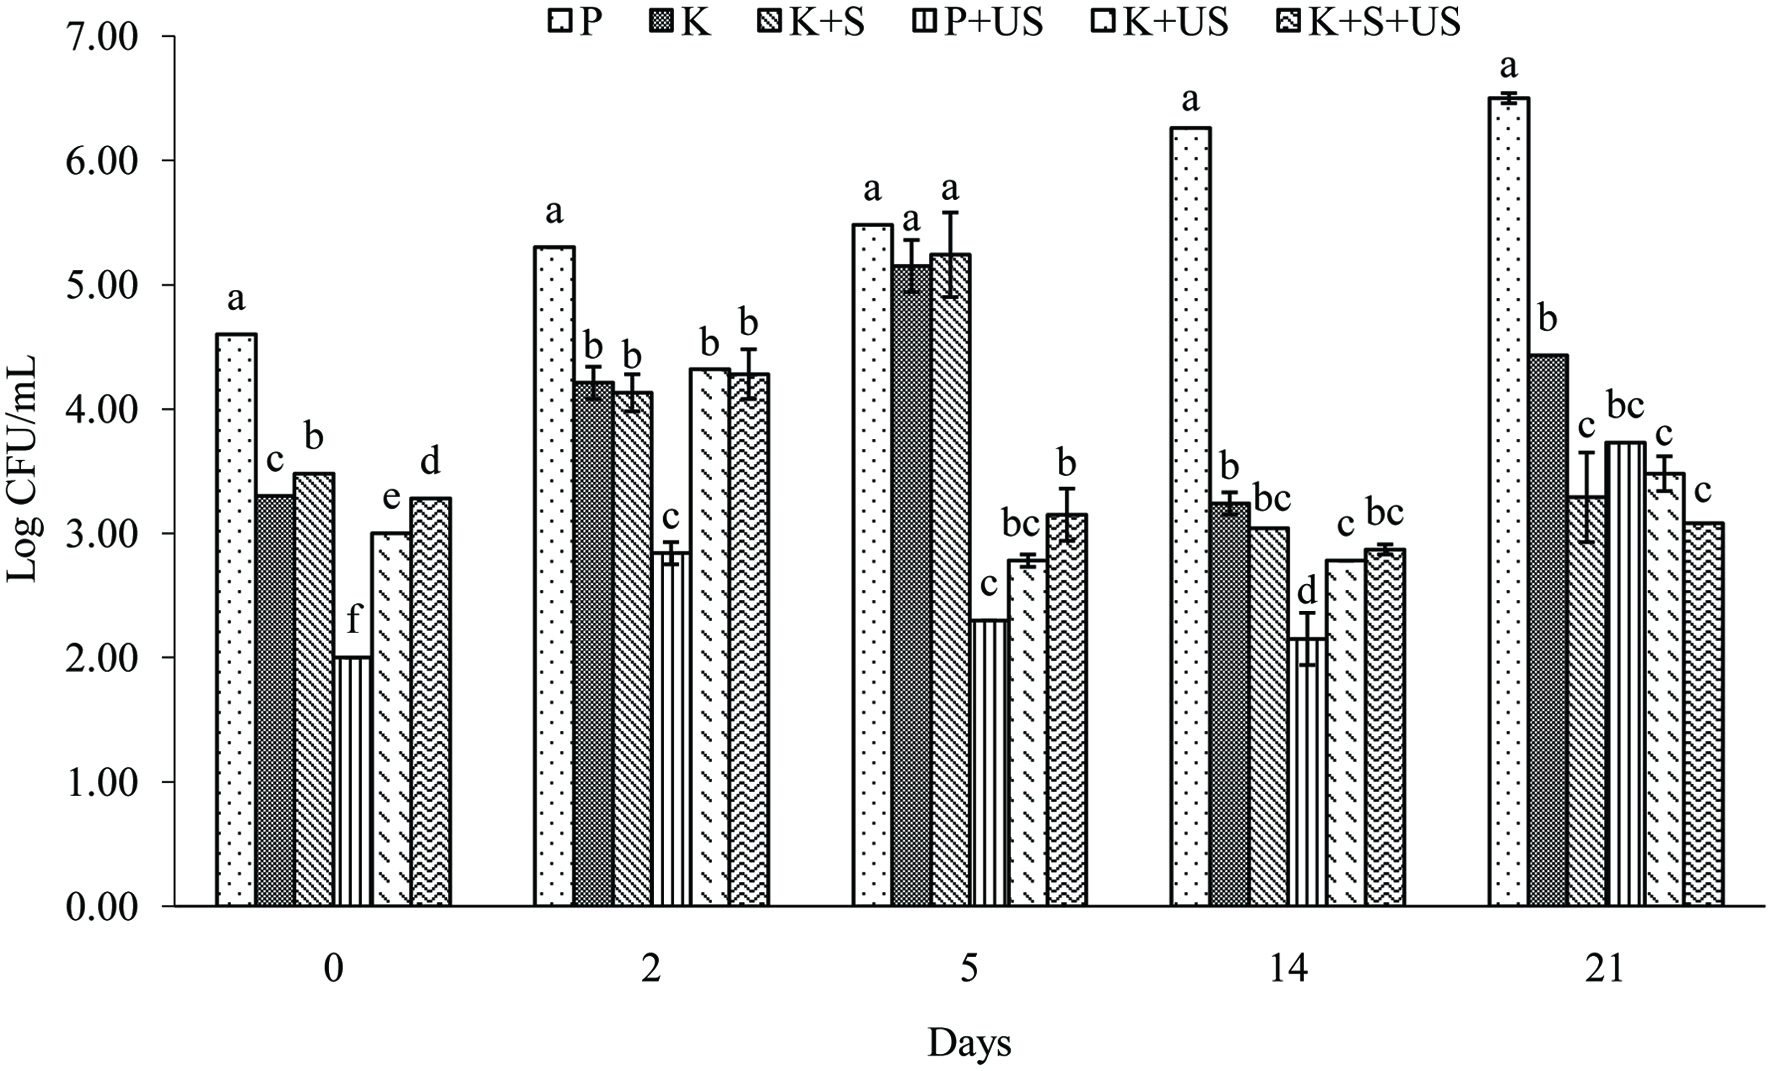 Click for large image | Figure 4. Total microbial count (log CFU/mL) of samples with and without US on day 0, 2, 5, 14 and 21. |
US did not result in a complete elimination of CFUs in samples. Khandpur et al. (2015) reported 5 log reductions with 100 W ultrasound treatment at 20 kHz for 15 min at less than 30 °C in combination with solvent extracts of orange peel oil in fruit and vegetable juice, which satisfied safety limits in refrigerated conditions for 20 days. A 5-log pathogen reduction in fruit juice is required by the FDA. In this study pathogen count was not determined but rather total microbial count. Also, seeing as kombucha is fermented with probiotics, a complete reduction in microbial count may not be favourable. In Canada, in order to be able to make a probiotic health claim, a serving of stated size of a product must contain a minimum level of 1.0 × 10⁹ CFU of specified Bifidobacterium and/or Lactobacillus strains (CFIA, 2019). Future studies are required to isolate, characterize and count the microbial strains present in the beverage to determine its eligibility as a probiotic product.
Temperature, time, power and frequency of US are main factors affecting the overall reduction of microbial count (Ashokkumar, 2015). Our study had no temperature control during application of US. Sample temperature reached 60 °C after 4 min and a maximum of 88 °C after 10 min, thereby exposing the samples to temperatures similar to conventional thermal treatment of juice (75–80 °C) for 6 min. Despite this, no significant degradation of nutrients, antioxidant activity or vitamin C content was seen in this study. The parameters used represent a high power low frequency system capable of generating acoustic cavitation leading to rupturing of microbial cell walls with minimal generation of free radicals (Ashokkumar, 2015). The combined acoustic cavitation, heat generated from US, and the production of ethanol and organic acids during fermentation may act in synergy to prevent the growth of pathogenic organisms in kombucha without decreasing nutritive qualities.
3.3.4. Oxidative stability
Due to the high oil and unsaturated fatty acid content of SB, oxidative stability of the samples was determined using Rancimat to measure induction time (h), presented in Table 4. US had no effect on oxidative stability, with no significant differences observed between P (2.66 ± 0.35 h) and P+US (2.91 ± 1.46 h). Fermentation decreased induction time for K (0.10 ± 0.01 h), K+US (0.22 ± 0.10 h), K+S (0.13 ± 0.02 h) and K+S+US (0.40 ± 0.28 h) with no significant difference between kombucha samples. These results were not expected since fermentation should lead to an increase in antioxidant activity and thus an increase in oxidative stability, therefore an increase in induction time, measured by Rancimat, would be expected. However, the decrease in induction time observed in this study may be explained by the production of volatile by products from fermentation, such as low molecular weight phenolics or volatile short chain fatty acids, which are byproducts in fermentation of dietary fibre (den Besten et al., 2013). No previous research exists in the literature investigating oxidative stability of kombucha or seabuckthorn puree using Rancimat but a study assessing the oxidative stability of flaxseed-enriched lasagna using the Rancimat method, by Mercier et al. (2015), reported an initial increase in conductivity, presumably explained by the presence of volatile short chain fatty acids. It would be interesting to investigate the presence of volatile short chain fatty acids and volatile phenols in kombucha in future studies using gas chromatographic headspace analysis.
Click to view | Table 4. Rancimat results (Induction time, h) as a measure of oxidative stability for samples with and without US |
3.3.5. Oxygen radical absorbance capacity (ORAC)
ORAC results are shown in Table 5. US led to 3% increase in antioxidant capacity in P+US (315.42 ± 1.76 µmol TE/L) compared to P (305.96 ± 0.29 µmol TE/L) on day 0. This increase is less than that observed by Golmohamadi et al. (2013) who found that sonication of raspberry purée for 10 min at 20 kHz resulted in a 17.3% increase in total antioxidant activity, measured by the photochemiluminescence method, attributed to disruption of the plant cell wall by US and release of bioactive compounds. The explanation for differences observed between studies may be attributed to methods used to measure antioxidant activity.
Click to view | Table 5. ORAC (µmol TE/L) results for samples with and without US on day 0,2,5,7 and 21 |
The ORAC values of kombucha shows that the addition of sucrose increased the rate of antioxidant depletion, as ORAC for K+S (286.01 ± 4.94 µmol TE/L) on day 5 was significantly (P < 0.05) lower than P (305.96 ± 0.29 µmol TE/L) on day 0 while K (299.51 ± 8.07 µmol TE/L) was not. The same is observed when comparing P+US (315.42 ± 1.76 µmol TE/L) on day 0 to K+S+US (282.66 ± 11.22 µmol TE/L) and K+US (305.87 ± 0.85 µmol TE/L) on day 5. Shalaby et al. (2016) reported a decrease in antioxidant activity in green tea with addition of sucrose potentially attributable to the condensation reaction between hydroxyl groups of phenolics and sucrose molecules to form glycosides. No significant difference was observed in ORAC between P (298.30 ± 2.35 µmol TE/L), P+US (300.40 ± 1.58 µmol TE/L), K+US (308.98 ± 8.15 µmol TE/L) and K+S+US (289.09 ± 5.97 µmol TE/L) on day 21 while K (280.01 ± 7.18 µmol TE/L) and K+S (283.39 ± 14.06 µmol TE/L) had significantly lower ORAC values. This suggests that combining US and fermentation may protect against depletion of antioxidants during shelf life compared to fermentation alone perhaps through the breakdown of plant cell walls by sonication and release of bioactive compounds into the solution (Golmohamadi et al., 2013), combined with release of polysaccharide conjugated antioxidants through fermentation (Wang et al., 2016).
3.3.6. Vitamin C
The concentration of vitamin C, for all samples, is presented in Table 6. US had no effect on vitamin C content with no significant difference between P (2.31 ± 0.83 g/L) and P+US (1.65 ± 0.12 g/L). Vitamin C measurement is useful to predict nutrient loss during food processing and storage due to its easily deteriorative nature. If vitamin C is retained, other nutrients are most likely to also be retained (Araya-Farias et al., 2011). Vitamin C content for K, K+US, K+S and K+S+US were 0.20 ± 0.02, 0.10 ± 0.03, 0.15 ± 0.00 and 0.19 ± 0.10 g/L, respectively, with no significant difference between treatments. Vitamin C for the kombucha samples were significantly (P < 0.05) lower than P, P+US with a 11- to 16-fold reduction. Aerobic fermentation at room temperature for 5 days likely contributed to this decrease. Fortification with ascorbic acid, often done with juices from fruit naturally low in vitamin C, may serve as a solution to overcome the observed loss of vitamin C during fermentation and should be investigated to determine its effects since ascorbic acid may have negative depending on food matrix and composition (Pacheco-palencia et al., 2007).
Click to view | Table 6. Vitamin C concentration (g/L) for samples with and without US |
3.3.7. WSI and WAI of freeze-dried powder
WSI and WAI for all samples are presented in Table 7. US significantly increased WAI by 40% for P+US (6.64 ± 0.70 g/g) compared to P (9.29 ± 1.56 g/g) but had no effect on WSI when comparing P+US (44.2 ± 1.93%) and P (46.81 ± 3.03%). The increase in WAI by US may be explained by an increase in pore space and/or damage to the plant cell wall by sonication (Golmohamadi et al., 2013). When investigating the effects of different drying techniques on seabuckthorn berries, Kyriakopoulou et al. (2013) found that freeze drying resulted in an increase in WAI compared to air drying, and accelerated solar drying, attributed to an increase in pore space. In this study both freeze-drying and US were used which may have led to a synergistic effect on pore space through damage to the cell wall, leading to an increase in water absorption. Fermentation alone led a 32% increase in WSI when comparing K (61.50 ± 1.65%) to P (46.81 ± 3.03%). This may be attributed to the breakdown of polysaccharides to lower molecular weight sugars that are more water-soluble (Septembre-Malaterre et al., 2018). The addition of sucrose increased WSI by 35% when comparing K+S and K and by 52% when comparing K+S+US and K+S, as expected with water-solubility of sucrose.
Click to view | Table 7. Water Solubility Index (%) and Water Absorption Index (g/g) of freeze dried samples without and without US |
Fermentation alone led to a 40% decrease in WAI when comparing K (3.97 ± 0.75 g/g) to P (6.64 ± 0.70 g/g). This is may be attributable to the breakdown of pectin networks that are normally capable of trapping water (Sila et al., 2009). US also increased the WAI of kombucha samples, with exception of samples with added sucrose. The addition of sucrose led to a significant (P < 0.05) decrease in WAI when comparing K+S and K+S+US, to K and K+US, respectively.
| 4. Conclusion | ▴Top |
Ultrasound extracted a similar amount of phenolics in aglycone/free form in 10 min compared to the 1 hr traditional extraction method, while the 15 min UAE showed a significant decrease in aglycones. For this reason, a 10 min US treatment was chosen for the rest of the study. SB was an effective substrate for fermentation in production of kombucha. US resulted prevented phase separation in P+US for the whole study (21 days). Fermentation was also an effective emulsifier with no syneresis observed in all kombucha samples for the whole study. US increased oil content extracted from pulp by 10% and from seed by 7% and had no effect on moisture, protein or ash content of P+US compared to P. US application decreased microbial load by 2 or 3 log CFU/mL, had no effect on oxidative stability, and increased ORAC value by 3% in P+US compared to P on day 0. US had no effect on vitamin C content while fermentation significantly decreased it. Fermentation and addition of sucrose increased WSI and decreased WAI while US increased WAI but had no effect on WSI. This study showed the multiple applications of US and its potential to improve physico-chemical functionality of SB phenolics during fermentation of kombucha-like beverage.
| References | ▴Top |