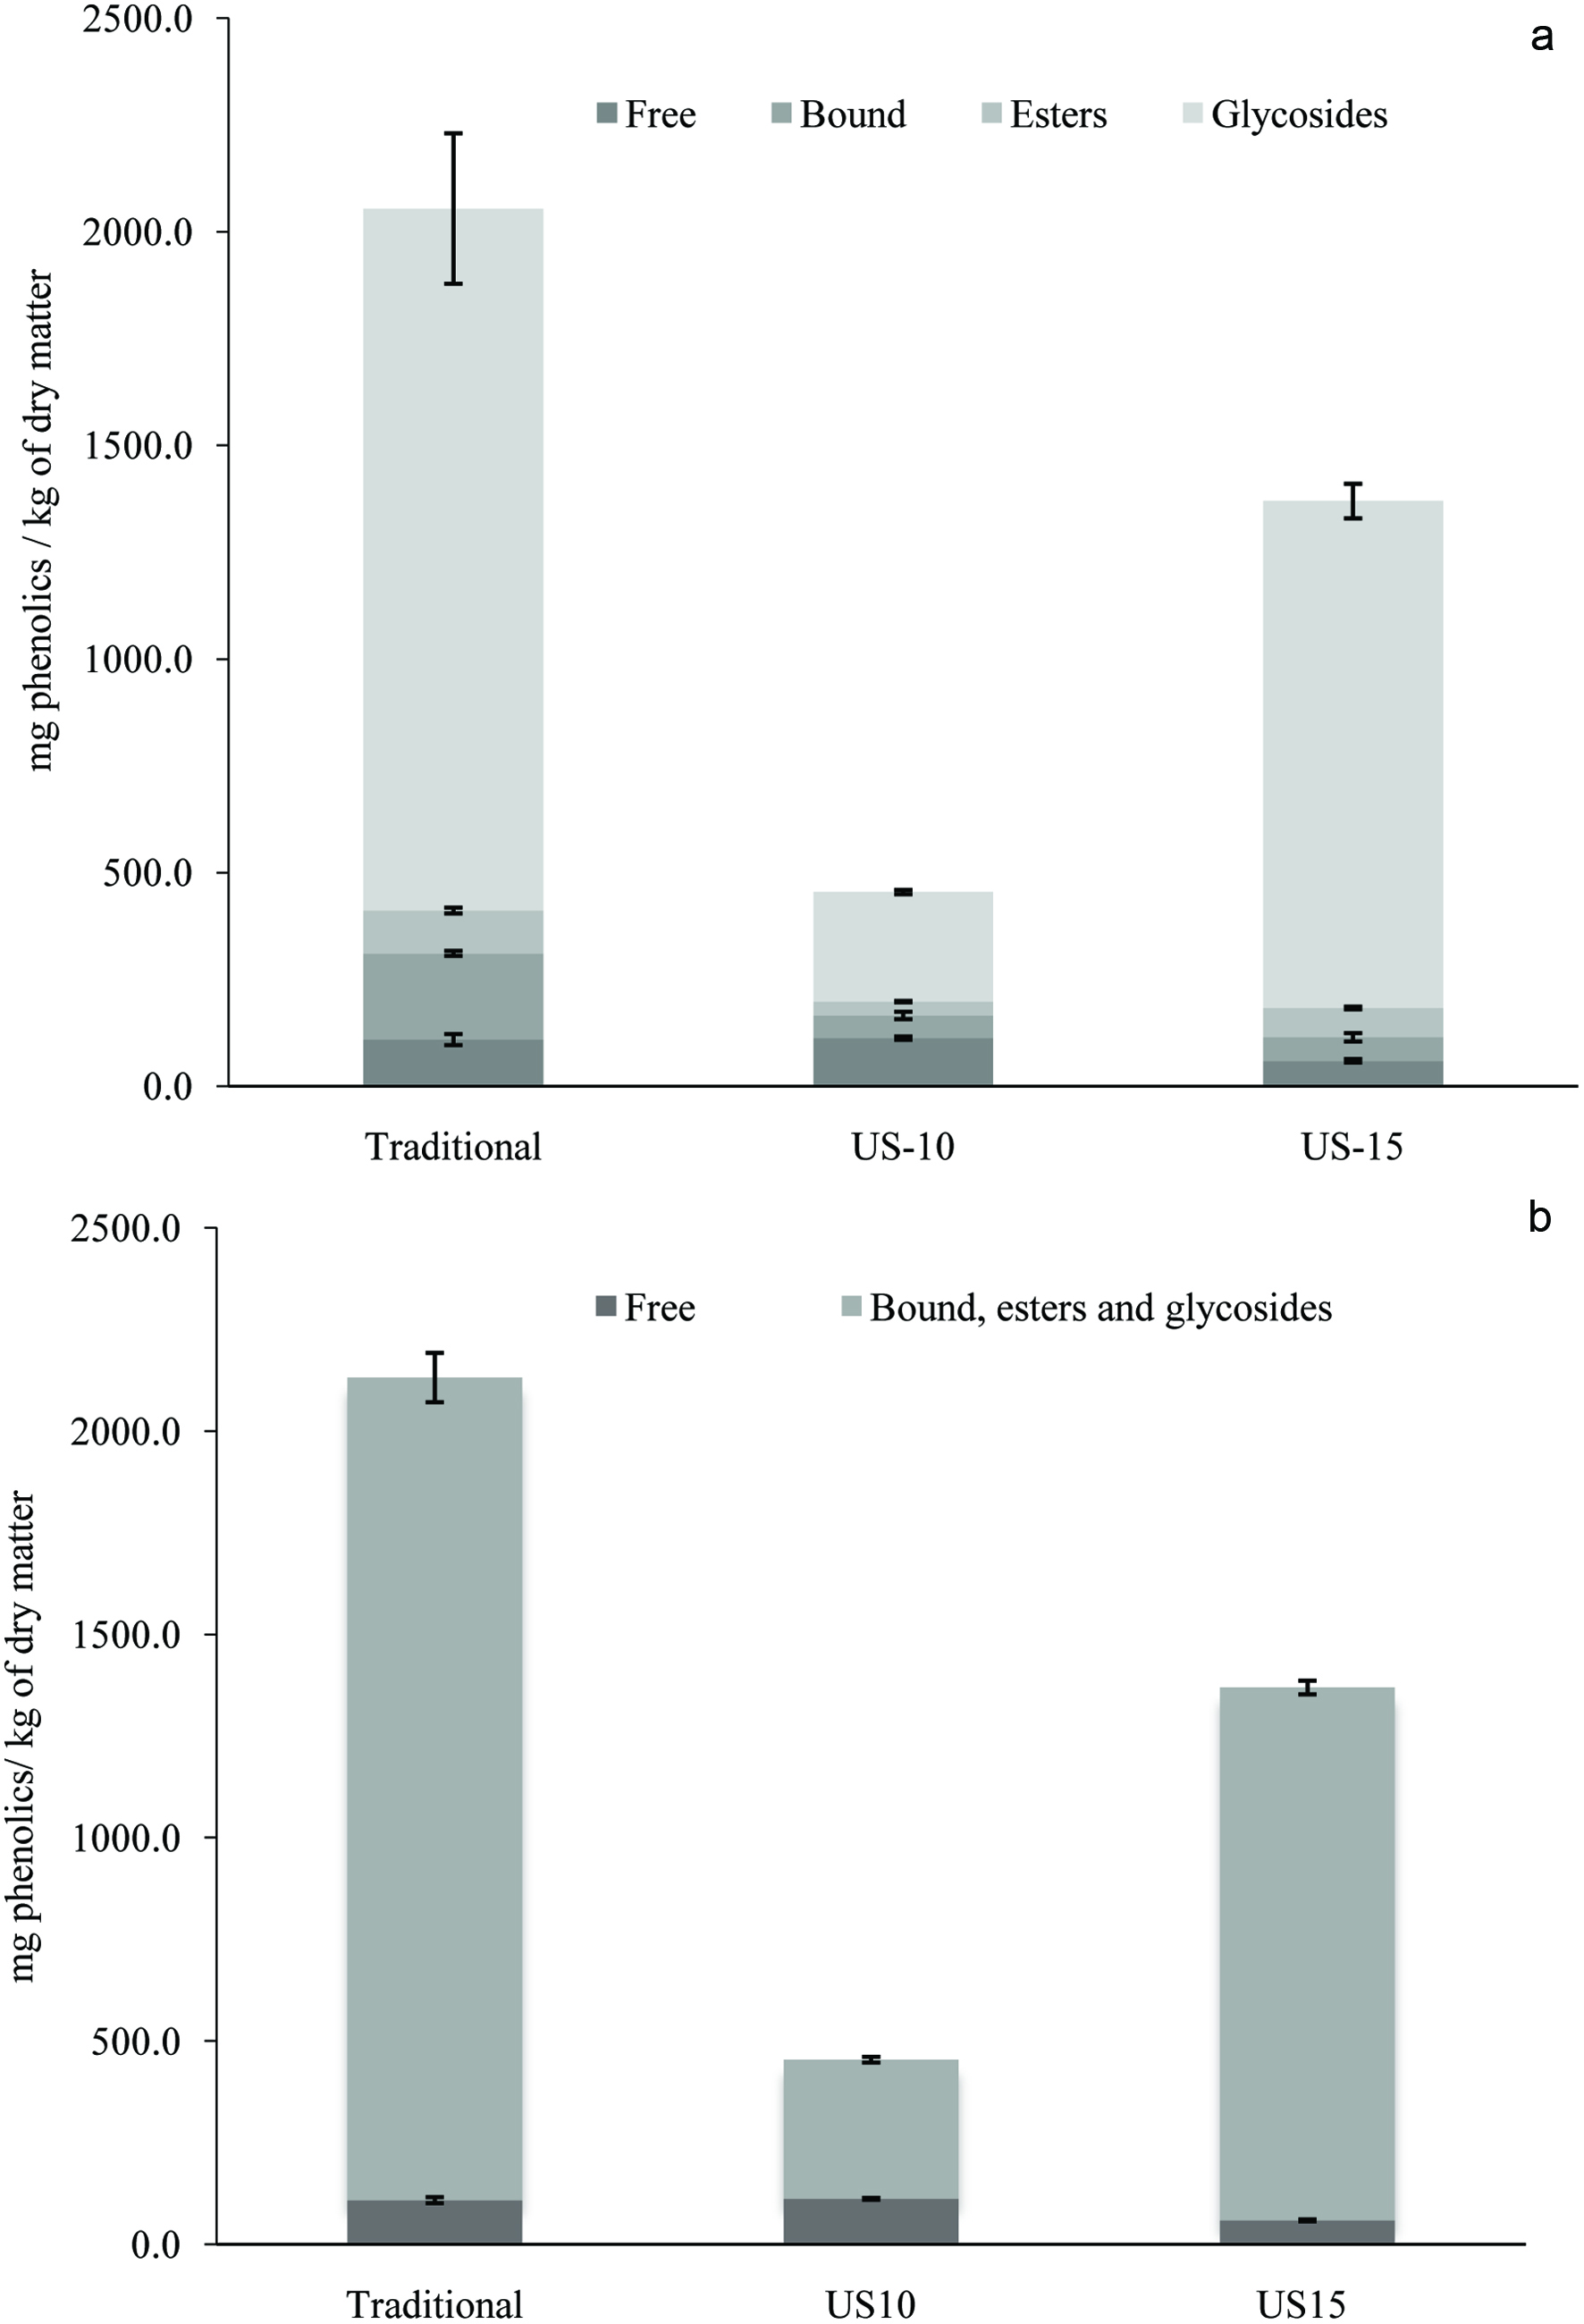
Figure 1. Phenolic fractional profile (free, bound, glycoside and ester conjugated (a) and free vs bound, glycoside and ester conjugated (b) of defatted whole SB using traditional (TEM), 10 min US (US10), and 15 min US (US15) assisted extractions.
| Journal of Food Bioactives, ISSN 2637-8752 print, 2637-8779 online |
| Journal website www.isnff-jfb.com |
Original Research
Volume 9, March 2020, pages 58-69
Low frequency, high power ultrasound: a non-thermal green technique improves phenolic fractions (free, conjugated glycoside, conjugated esters and bound) in fermented seabuckthorn beverage
Figures
Tables
| Fruit | No-US | After US |
|---|---|---|
| CAE: Chlorogenic acid equivalent US: Ultrasound. | ||
| Moisture% | 80.00 | 78.80 |
| Juice (Yield %) | 66.10 | 65.90 |
| pH | 2.60–2.80 | 2.60–3.20 |
| Acidity% | 2.80–2.90 | 2.70–2.80 |
| °Brix (TSS) | 8.20 | 8.30 |
| TPC (mg CAE/100g) | 550 | 600 |
| Synersis | After 2 hr | After 4 weeks |
| Phenolic acids | Flavonoids | Total | |||||||
|---|---|---|---|---|---|---|---|---|---|
| Gallic acid | Proto catechuic acid | Vanillic acid | P-coumaric acid | Ferulic acid | Rutin | Quercetin | Kaempferol | ||
| Values are means of triplicates ± standard deviation. The same letters in a column indicate no significant difference using one-way ANOVA (significance: P < 0.05). ND: not determined. | |||||||||
| Traditional | |||||||||
| Free | ND | 20.7 ± 2.3b | ND | ND | ND | 39.0 ± 7.8a | 23.2 ± 5.4bc | 18.9 ± 6.5d | 109.0 ± 12.9de |
| Bound | 7.7 ± 1.0d | 139.6 ± 5.3a | 5.4 ± 0.8b | 39.3 ± 2.4a | 9.6 ± 1.8bc | ND | ND | ND | 201.5 ± 5.8cd |
| Conjugated | |||||||||
| Esters | ND | 24.8 ± 5.0b | 2.0 ± 0.8b | 7.2 ± 3.2c | 33.9 ± 7.0a | 32.5 ± 5.5a | ND | ND | 100.3 ± 6.7de |
| Glycosides | 1,492.7 ± 184.5a | ND | 52.5 ± 27.5a | 3.4 ± 0.9c | ND | ND | 26.5 ± 3.7b | 68.6 ± 9.0b | 1,643.7 ± 176.1a |
| Total | 1,500.4 | 185.1 | 59.9 | 49.8 | 43.5 | 71.5 | 49.7 | 94.6 | 2,054.5 |
| US-10 | |||||||||
| Free | ND | 3.7 ± 0.5e | ND | ND | ND | 23.4 ± 3.5b | 47.6 ± 0.1a | 37.7 ± 0.1c | 112.3 ± 4.0de |
| Bound | 4.5 ± 1.1d | 13.6 ± 2.9c | 1.6 ± 0.2b | 26.7 ± 6.5b | 6.5 ± 0.4bc | ND | ND | ND | 52.9 ± 9.0e |
| Conjugated | |||||||||
| Esters | ND | 6.9 ± 1.2de | 0.7 ± 0.1b | 2.7 ± 0.8c | 11.9 ± 2.7b | 10.0 ± 1.1c | ND | ND | 32.3 ± 1.8e |
| Glycosides | 212.1 ± 2.9c | 25.3 ± 0.1b | 19.4 ± 5.8b | ND | ND | ND | ND | ND | 256.8 ± 5.0c |
| Total | 216.5 | 49.6 | 21.7 | 29.5 | 18.4 | 33.4 | 47.6 | 37.7 | 454.3 |
| US-15 | |||||||||
| Free | ND | 8.7 ± 0.9cde | ND | ND | ND | 15.2 ± 0.7c | 19.4 ± 1.9c | 15.6 ± 2.0d | 58.9 ± 4.1e |
| Bound | 6.6 ± 3.0d | 13.6 ± 3.0c | 1.6 ± 0.3b | 28.1 ± 4.1b | 5.4 ± 0.2c | ND | ND | ND | 55.3 ± 9.8e |
| Conjugated | |||||||||
| Esters | 0.6 ± 0.1d | 11.7 ± 2.8cd | 0.7 ± 0.4b | 7.8 ± 0.4c | 31.6 ± 0. 1a | 16.2 ± 0.6bc | ND | ND | 68.5 ± 3.0e |
| Glycosides | 1,080.1 ± 48.5b | ND | ND | ND | ND | ND | 21.4 ± 2.9bc | 85.4 ± 9.2a | 1,186.9 ± 40.4b |
| Total | 1,087.3 | 34.0 | 2.2 | 36.0 | 37.0 | 31.4 | 40.8 | 100.9 | 1,369.7 |
| Sample | Moisture | Ash | Protein | Fat content pulp (%) | Fat content seed (%) |
|---|---|---|---|---|---|
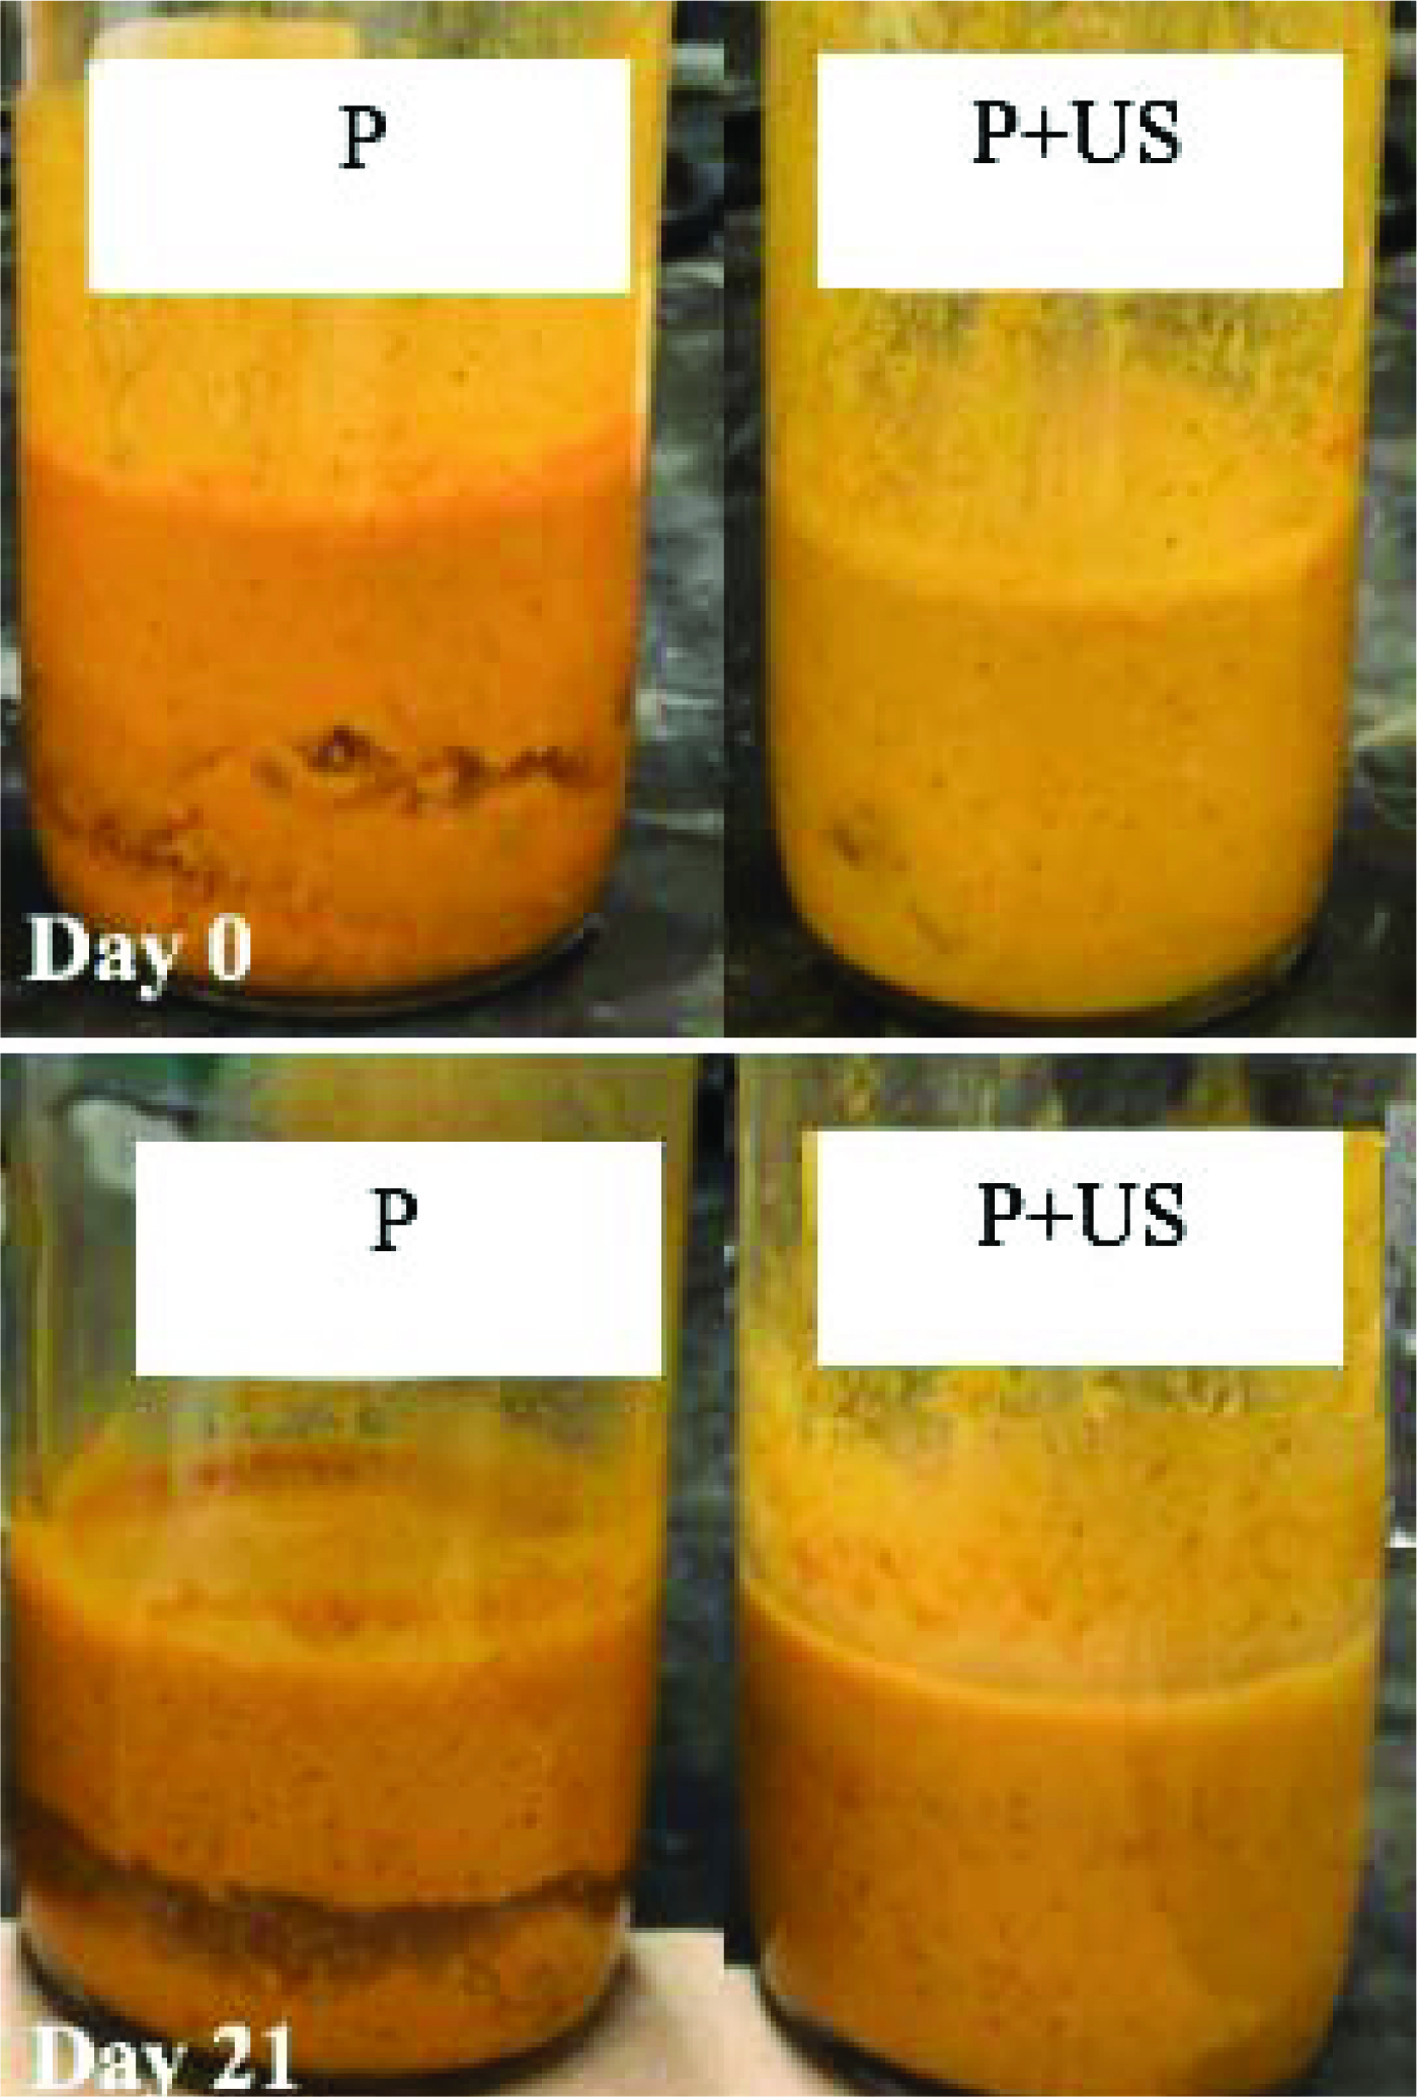
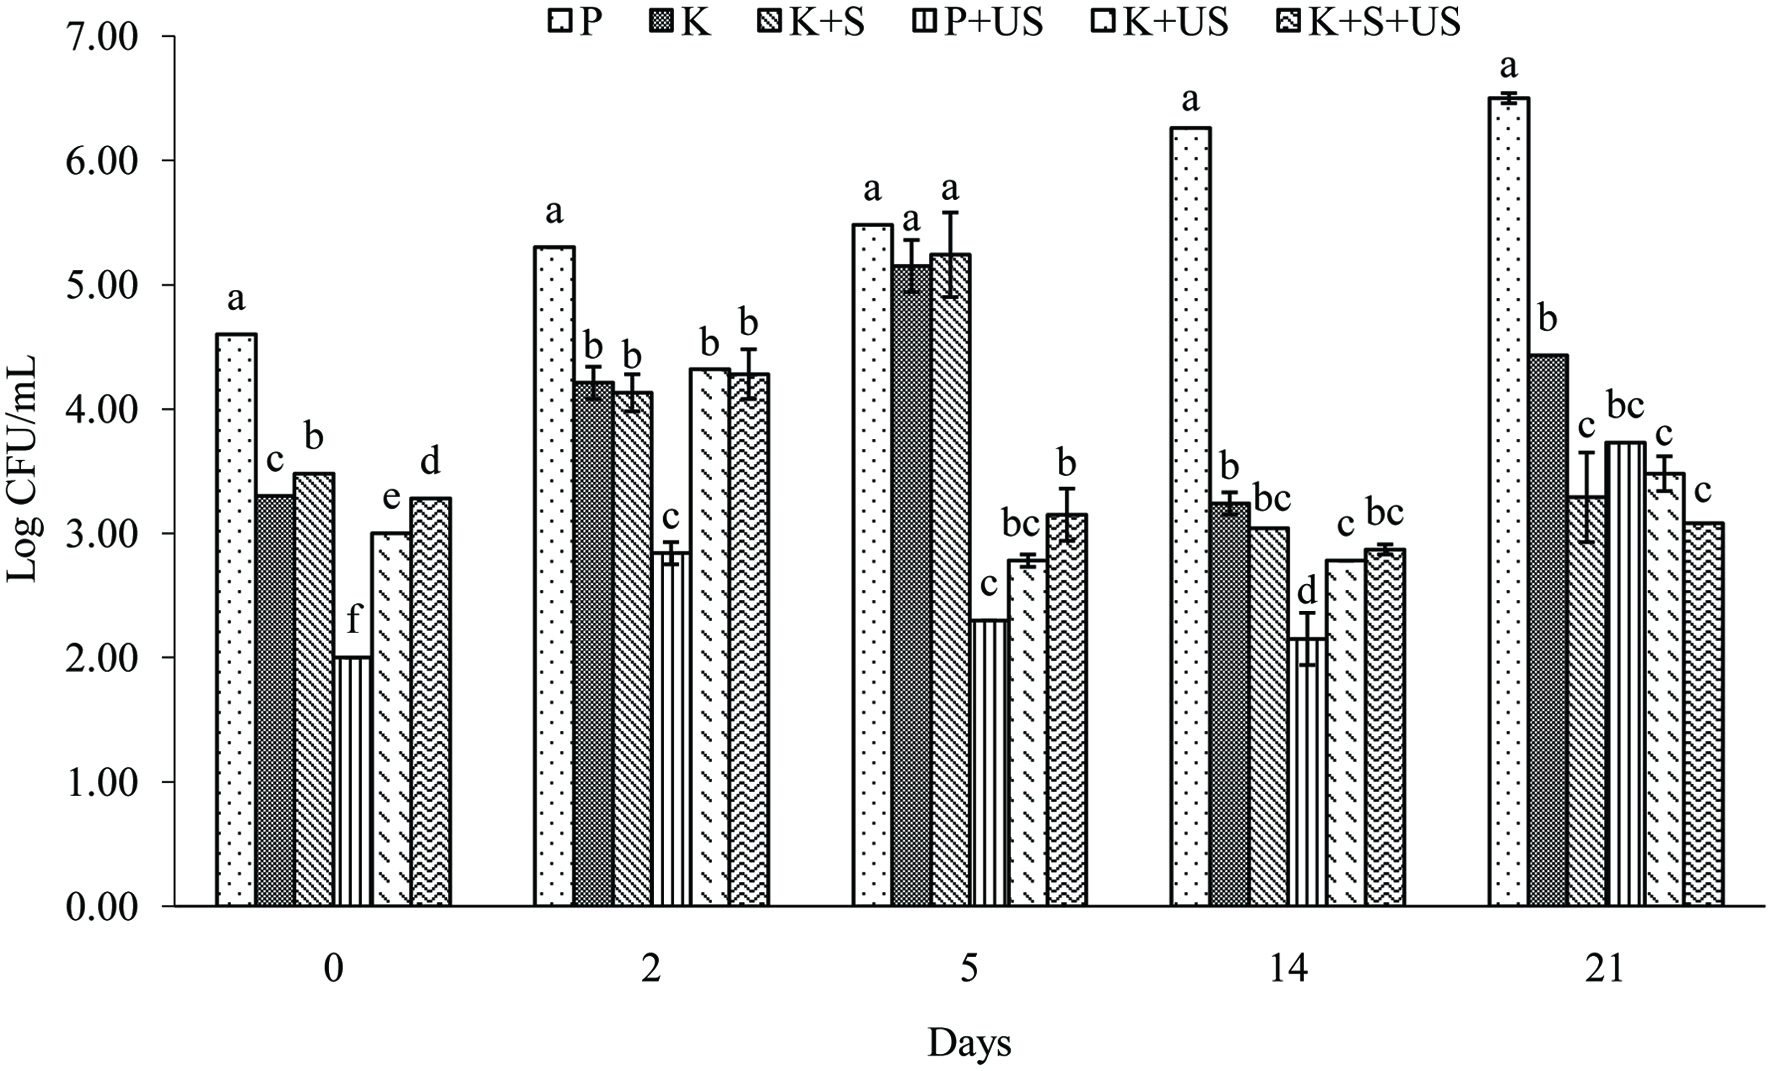
| P: purée with 30% water; US: ultrasonic treatment. Values are means of triplicates ± standard deviation. The same letters in a column indicate no significant difference using one-way ANOVA (significance: P < 0.05). | |||||
| P | 87.5 ± 0.2a | 1.52 ± 0.00a | 9.80 ± 0.46a | 19.04 ± 0.08a | 14.81 ± 0.08a |
| P+US | 88.7 ± 1.8a | 1.51 ± 0.00a | 9.84 ± 0.85a | 20.97 ± 0.29b | 15.83 ± 0.28b |
| Sample | Induction time |
|---|---|
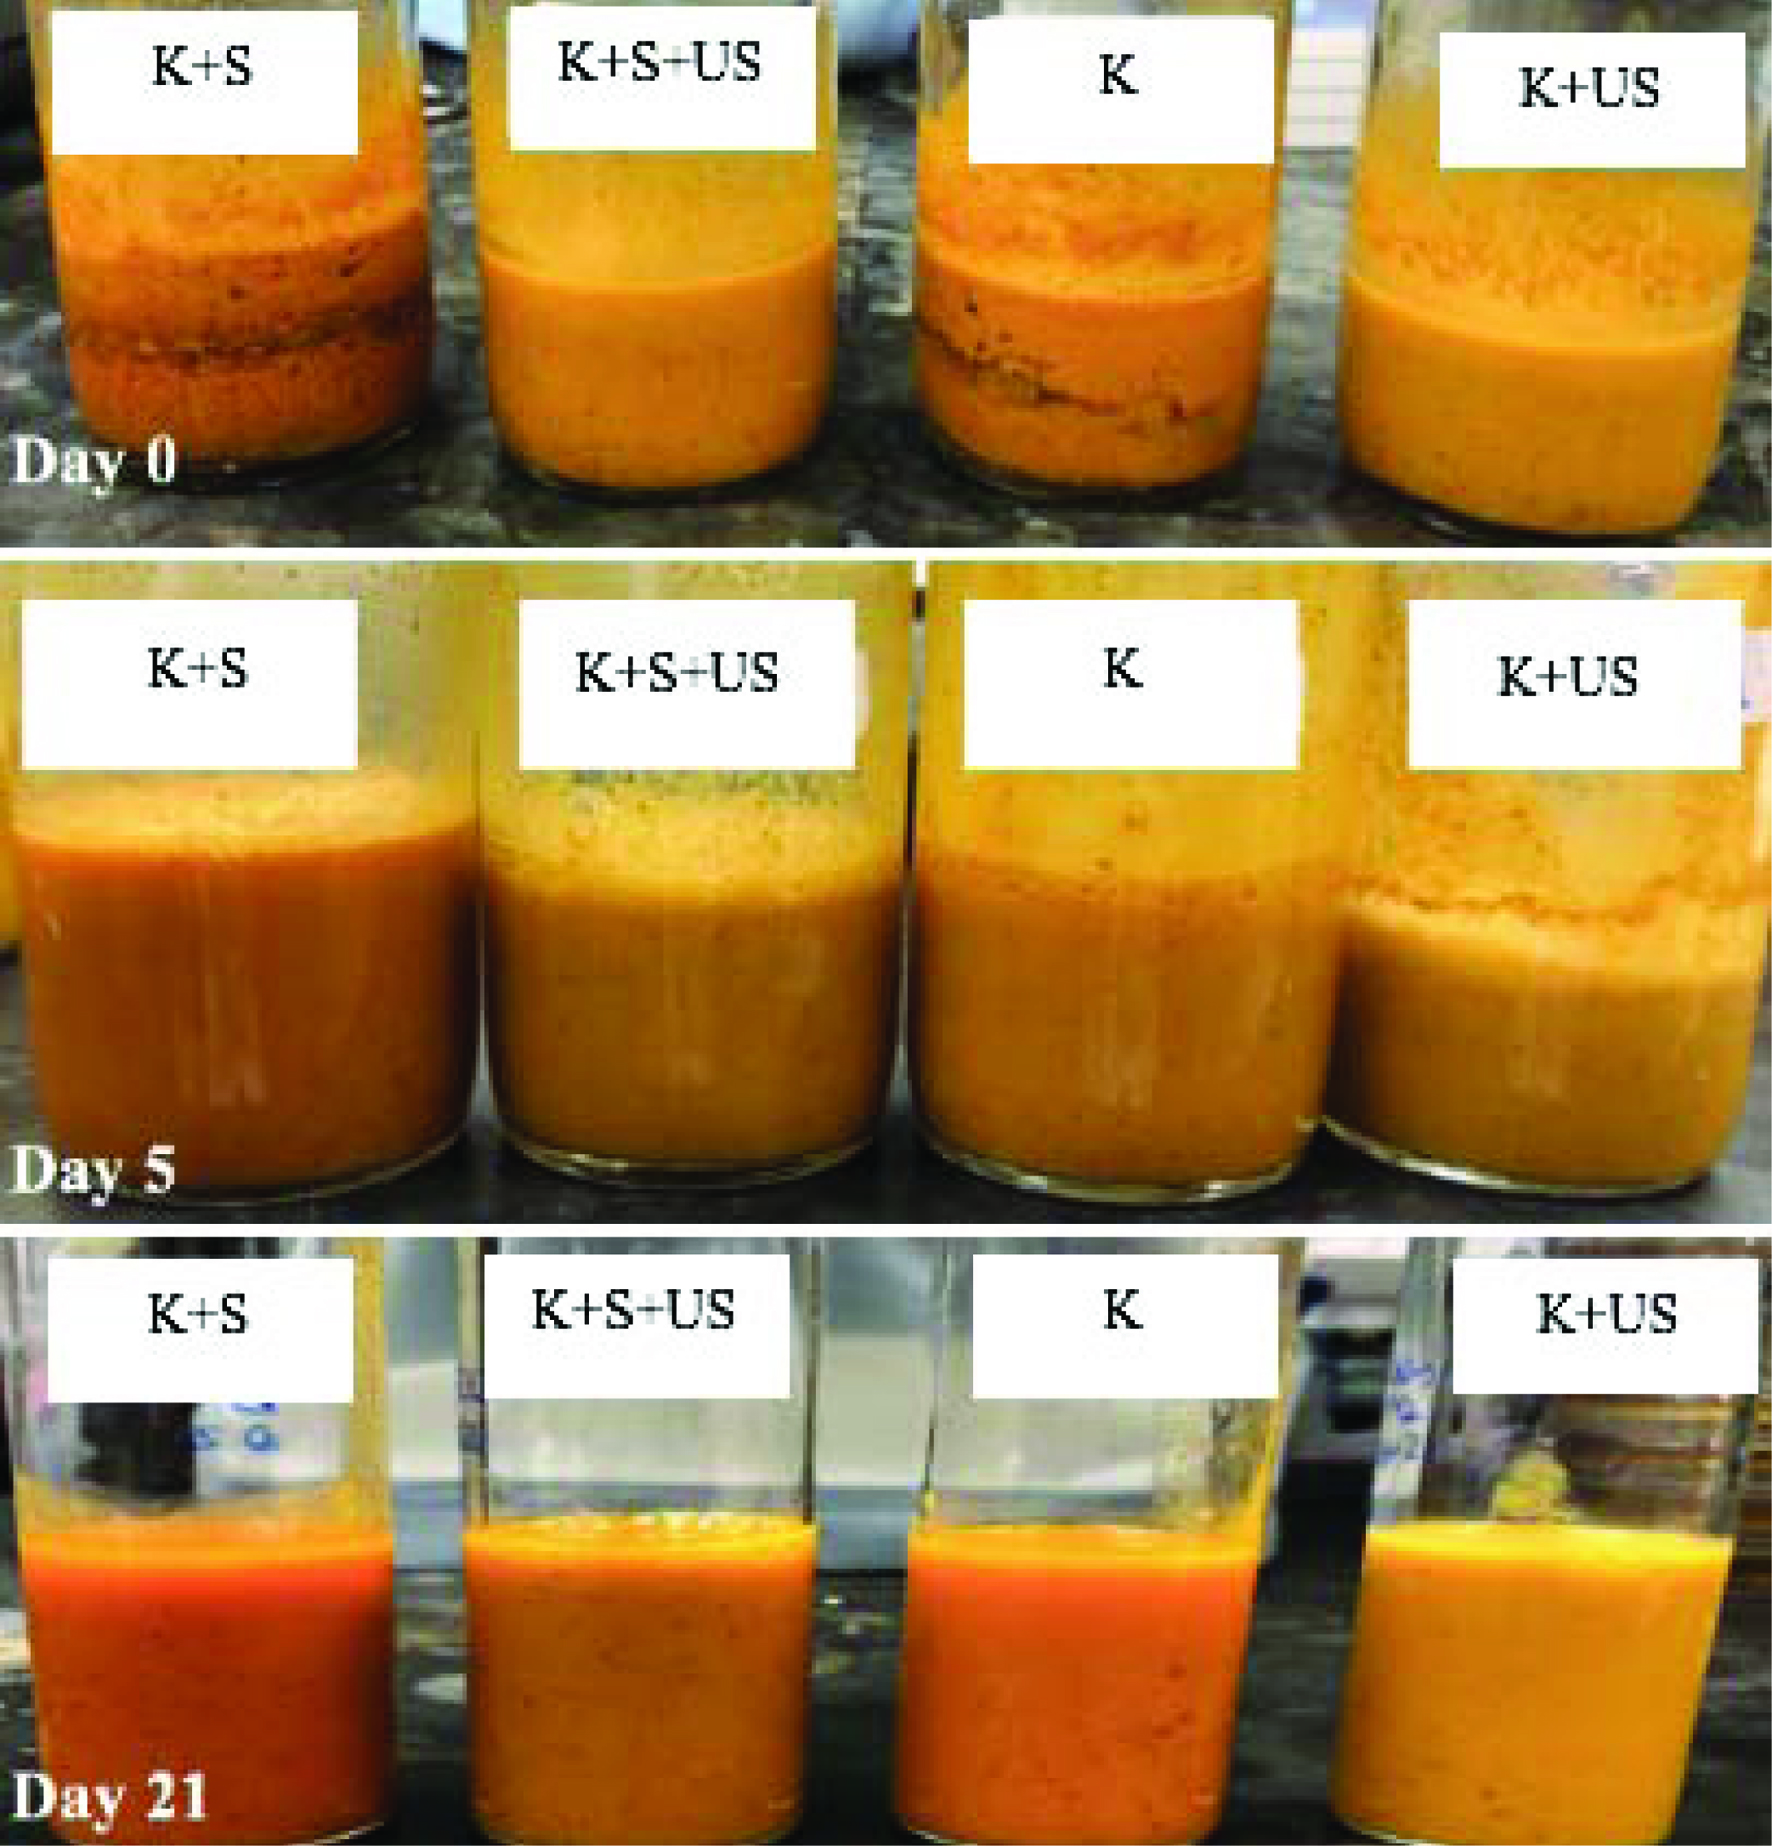
| P: purée with 30% water; US: ultrasonic treatment; K: kombucha; S: sugar. Values are means of triplicates ± standard deviation. The same letters indicate no significant difference using one-way ANOVA (significance: P < 0.05). | |
| P | 2.66 ± 0.35a |
| K | 0.10 ± 0.01b |
| K+S | 0.13 ± 0.02b |
| P + US | 2.91 ± 1.46a |
| K+US | 0.22 ± 0.10b |
| K+S+US | 0.40 ± 0.28b |
| ORAC | Day | ||||
|---|---|---|---|---|---|
| 0 | 2 | 5 | 7 | 21 | |
| N/A: not applicable; P: purée with 30% water; K: kombucha; S: sugar; US: ultrasonic treatment. Values are means of triplicates ± standard deviation. The same letters in a column indicate no significant difference using one-way ANOVA (significance: P < 0.05). | |||||
| P | 305.96 ± 0.29b | N/A | N/A | 300.83 ± 3.89b | 298.30 ± 2.35ab |
| K | N/A | 301.18 ± 3.24a | 299.51 ± 8.07a | N/A | 280.01 ± 7.18c |
| K+S | N/A | 302.23 ± 1.33a | 286.01 ± 4.94b | N/A | 283.39 ± 14.06c |
| P+US | 315.42 ± 1.76a | N/A | N/A | 309.99 ± 0.85a | 300.40 ± 1.58ab |
| K+US | N/A | 311.65 ± 15.12a | 305.87 ± 9.95a | N/A | 308.98 ± 8.15a |
| K+S+US | N/A | 298.12 ± 4.66a | 282.66 ± 11.22b | N/A | 289.09 ± 5.97ab |
| Sample | Vitamin C |
|---|---|
| P: purée with 30% water; US: ultrasonic treatment; K: kombucha; S: sugar. Values are means of triplicates ± standard deviation. The same letters in a column indicate no significant difference using one-way ANOVA (significance: P < 0.05). | |
| P | 2.31 ± 0.83a |
| K | 0.20 ± 0.02b |
| K+S | 0.15 ± 0.00b |
| P + US | 1.65 ± 0.12a |
| K+US | 0.10 ± 0.03b |
| K+S+US | 0.19 ± 0.10b |
| Sample | Water Solubility Index | Water Absorption Index |
|---|---|---|
| P: purée with 30% water; K: kombucha; US: ultrasonic treatment; S: sugar. Values are means of triplicates ± standard deviation. The same letters in a column indicate no significant difference using one-way ANOVA (significance: P < 0.05). | ||
| P | 46.81 ± 3.03d | 6.64 ± 0.70b |
| K | 61.60 ± 1.65c | 3.97 ± 0.75c |
| K+S | 83.31 ± 1.34a | 1.19 ± 0.02d |
| P + US | 44.62 ± 1.93d | 9.29 ± 1.56a |
| K+US | 59.25 ± 0.49c | 4.62 ± 2.58bc |
| K+S+US | 89.93 ± 5.42a | 1.39 ± 0.18d |