| Journal of Food Bioactives, ISSN 2637-8752 print, 2637-8779 online |
| Journal website www.isnff-jfb.com |
Original Article
Volume 8, December 2019, pages 74-83
In vivo antidiabetic activities of green and black tea polysaccharides using streptozotocin-induced diabetic mice fed with a high-fat diet
Kübra Akalına, Arzu Taş Ekiza, Fatih Karakayaa, Ayse Karadagb, Ebru Pelvanc, Kübra Doğanb, Cesarettin Alasalvarc, Soner Aksua, *
aTÜBİTAK Marmara Research Center, Genetic Engineering and Biotechnology Institute, Gebze-Kocaeli, Turkey
bDepartment of Food Engineering, Yıldız Technical University, Esenler-Istanbul, Turkey
cTÜBİTAK Marmara Research Center, Food Institute, Gebze-Kocaeli, Turkey
*Corresponding author: Soner Aksu, TÜBİTAK Marmara Research Center, Genetic Engineering and Biotechnology Institute, P.O Box 21, 41470 Gebze-Kocaeli, Turkey. Tel: +90 262 677 3368; E-mail soner.aksu@tubitak.gov.tr
DOI: 10.31665/JFB.2019.8209
Received: November 29, 2019
Revised received & accepted: December 27, 2019
| Abstract | ▴Top |
Type-2 diabetes (T2D) is the most common type of chronic disease in adults and accounts for around 90% of all cases of diabetes. Therefore, developing dietary supplements from natural sources, such as teas, is of great interest. Seven diet groups together with a parallel control group were used for three periods of 16 weeks in total [stabilization period (W-2-W0), model period (W0-W8), and treatment period (W8-W14)]. The primary aim of this study was to investigate the in vivo antidiabetic activities of green and black tea polysaccharides (GTPS and BTPS, respectively) using streptozotocin-induced diabetic mice fed with either a high-fat diet (HFD) or normal diet (ND). Streptozotocin- and HFD-induced T2D in vivo model was developed during the model period (W0-W8) in C57BL/6J male mice. Both GTPS and BTPS groups were administrated for 6 weeks (daily 400 mg/kg body weight) by oral gavage throughout the treatment period (W8-W14). The results showed that BTPS group significantly (P < 0.05) decreased the fasting blood glucose level in diabetic mice even fed with a HFD and improved the insulin resistance. Similar effect was not obtained when GTPS group fed with a HFD. In addition, BTPS group fed with a HFD effectively suppressed the body weight gain despite high energy intake and was more successful than its GTPS counterpart group in healing pathologies of liver and affected plasma blood lipid levels due to streptozotocin- and HFD-induced diabetes. The present work suggests that BTPS can be used as an antidiabetic dietary supplement without posing any potential health risk.
Keywords: Black tea polysaccharides; Green tea polysaccharides; High-fat diet; Normal diet; Blood glucose; Insulin resistance; In vivo; Streptozotocin; Type-2 diabetes
| 1. Introduction | ▴Top |
Type-2 diabetes (T2D) is a metabolic disorder with chronic and complex ethology. The development of T2D can be prevented or treated by changes in lifestyle or medication. According to the latest reports, the worldwide rising tide of weight, lack of physical activity and high-energy eating regimens, or irregular nutrition has brought about an uncommon increase in the number of patients with T2D. Despite the incidence and prevalence of T2D varies by geographic location, the general trend has been an increase in the prevalence of diabetes in every country since 1980. According to estimation for 2017, almost 425 million individuals suffer from diabetes. This number corresponds to 8.8% of the adult population aged 20–79 years (IDF, 2017). It is also estimated that 642 million people will be expected to suffer from diabetes by 2040 (Chatterjee et al., 2017).
Tea, made up from leaves and buds of Camellia sinensis, has been one of the most popular beverages consumed worldwide after water and well ahead of carbonated soft drinks, wine, beer, and coffee, and therefore it has received a great deal of interest among researchers.
Over the last decades, tea polysaccharides (TPS) have attracted scientific interest because of their antidiabetic effects due to the serious adverse effects associated with the oral synthetic hypoglycaemic agents (Shokri et al., 2015; Wang and Zhu, 2016; Karadag et al., 2018). Crude tea polysaccharides are extracted from tea leaves by using water as a solvent, and its purity can be increased. TPS are mostly glycoconjugate, which conveys one or more carbohydrate chains covalently attached to a polypeptide backbone. TPS are also made of heteropolysaccharides in which uronic acids are abundant in their structure (Du et al., 2016). Moreover, TPS have been reported to have several biological activities such as antidiabetic, antioxidant, antitumor, antihepatoxicity, antiinfection, antiaging, antihyperglycemic, antiobesity, and antiinflammatory effects, among others (Nie and Xie, 2011; Chao, 2013; Chen et al., 2016; Karadag et al., 2018).
The bioactive compounds, which may be antidiabetic agents from natural sources, exert their effects through different physiological and cellular pathways. These natural components are often characterized by their ability to inhibit enzymes in metabolic pathways including intestinal α-glucosidase and α-amylase inhibition, oxidative stress protection, aldose reductase inhibition, insulin-responsive glucose transporter 4 (GLUT4) stimulation, hexokinase activity change, insulin synthesis and release from pancreatic cells, and reduction of glucose-6-phosphate dehydrogenase (G6PD) activity (Alam et al., 2019). Despite the fact that there are several signalling pathways to understand the mechanism of antidiabetic effects (Xu et al., 2018), most studied pathways in terms of the antidiabetic effect of TPS include α-glucosidase inhibition, AMP-activated protein kinase (AMPK), and phosphatidylinositol 3-kinas/protein kinase B (PI3K/Akt) signalling pathways (Dang et al., 2018).
T2D model is mostly developed using C57BL/6 mice due to being susceptible to feeding on a high-fat diet (HFD) (Parekh et al., 1998; Qiu et al., 2005; Baribault, 2016). The most ideal T2D animal model is defined by the administration of low-dose streptozotocin (STZ) and feeding with an intense fat diet (Kusakabe et al., 2009). STZ is directly toxic to pancreas beta cells and is commonly used as a chemical inducer in formation of diabetes model. The C57BL/6 mouse is also very sensitive to the toxicity of STZ. High dose of STZ administered mice show the development of type-1 diabetes and sudden weight loss. At low doses, weight loss is not observed in addition to T2D development. Metabolic disorders are detected in mice fed with intense fat diet during the T2D model development. Weight gain occurs generally around abdominal region and that is characterized by hypertrophy and hyperplasia of adipocytes. During the model development process, hyperinsulinemia, hyperglycaemia, and fatty liver tissue are some markers that have been seen at the onset of metabolic disorders in mice (Rosenberg et al., 2004; Animales et al., 2014; Baribault, 2016; Goyal et al., 2016).
Turkey is the fifth largest producer of tea. Black tea is processed according to its own seven different grades [high-quality tea (grades 1-3) and low-quality tea (grades 4-7)]. The low-quality groups of teas are marketed after being blended with high-quality group categories according to the demand (Alasalvar et al., 2013). Therefore, alternative use of low-quality groups of teas for different purposes (such as antidiabetic dietary supplement) is of great interest for both producers and consumers.
Limited studies are available in the literature about in vivo antidiabetic activities of green tea polysaccharides (GTPS) and black tea polysaccharides (BTPS). Therefore, the aim of the present study was to investigate the in vivo antidiabetic activities of GTPS and BTPS using SZT-induced diabetic mice fed with HFD. STZ- and HFD-induced T2D in vivo model was developed in C57BL/6J male mice. Liver enzymes, plasma blood lipids, and healing pathologies of liver were also examined in this model.
| 2. Materials and methods | ▴Top |
2.1. Samples and reagents
Green and black tea samples were procured from ÇAYKUR (State-Owned Tea Enterprise, in Rize, Turkey). Tea polysaccharides were extracted and characterised as explained in a previous study of Karadag et al. (2018). Two different crude polysaccharides were used in this study (GTPS and BTPS). All chemical reagents were obtained from Sigma-Aldrich Co. Ltd. (Dorset, UK), unless otherwise stated.
2.2. Study periods
This study was carried out in three periods. First period (W-2 to W0) was the stabilization period. The second period (W0 to W8) was the development of mouse model of T2D (called as model period). The third period (W8 to W14) was the treatment period. The total duration of the study was 16 weeks (Figure 1).
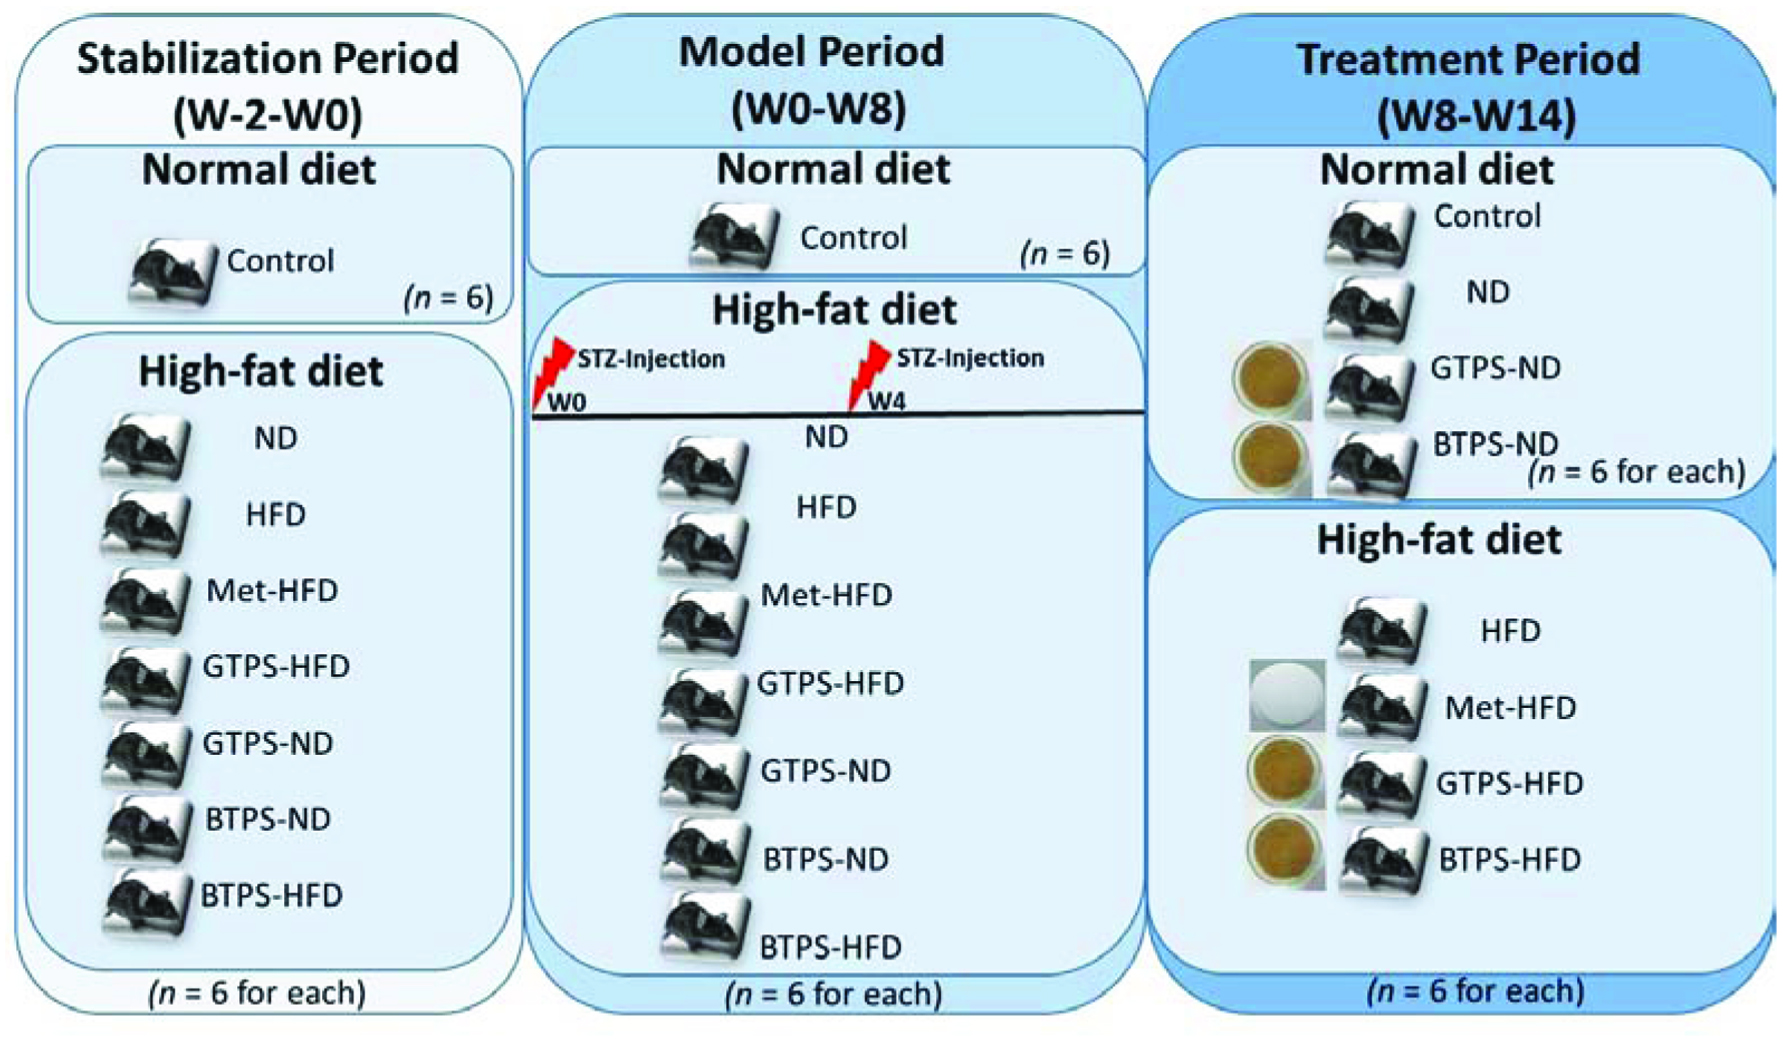 Click for large image | Figure 1. Study design and diet. Abbreviations: BTPS, black tea polysaccharides; GTPS, green tea polysaccharides; HFD, high-fat diet; Met, metformin; ND, normal diet; STZ, streptozotocin; W, week. |
2.3. Animals
Male C57BL/6J mice were used as experimental animals. Mice were fed on conventional chow and HFD (TestDiet, St. Louis, MO, USA-DIO rodent purified diet with 60% energy from fat-dyed blue) during the experiment. The mice were housed in standard conventional rodent cages and acclimatized to regular laboratory conditions (20–22 °C, humidity 50–60%, and 12 hours light/dark cycle). All procedures were performed on animals in accordance with the protocols and guidelines of the TÜBİTAK MRC Ethical Committee (Project No: 115O902).
2.4. Development of mouse model of T2D
T2D mouse model was developed by combining low-dose STZ with HFD (Tang et al., 2013). At the beginning of the study, normal state of mice was determined to ensure they had a normal glucose metabolism. Thus, blood glucose levels of mice fed with normal diet (ND) were measured for 2 weeks. Each week, mice were fasted for 8 hours and blood glucose levels were measured as illustrated in Figure 1.
A total of 48 randomly selected mice were used in the experiment. The body weight differences among groups were kept less than 20% at the beginning of the study. The control group mice were fed with a ND and all other test groups with HFD for 2 weeks. After that, the test group mice were injected intraperitoneally two times with 30 mg/kg STZ at 4 weeks interval and kept on the same HFD diet. Fasting blood glucose (FBG) levels and body weights of mice were monitored weekly.
2.5. In vivo activity assays
In vivo activity assays were carried out with slight modifications according to Tang et al. (2013). The assays are briefly described below.
2.5.1. Study groups
After 8th week, test mice were randomly divided into eight groups [control, ND, HFD, metformin (Met)-HFD, GTPS-HFD, GTPS-ND, BTPS-ND, and BTPS-HFD] depending on nutrition and treatment conditions (Figure 1).
2.5.2. Treatment procedures
Tea extracts were prepared with pure water and daily administered by oral gavage [400 mg/kg body weight (BW)] (Lee et al., 2015). Throughout the experimental period, GTPS-HFD, GTPS-ND, and BTPS-HFD, BTPS-ND groups were treated with green and black tea polysaccharides, respectively. Met-HFD group was also treated with metformin (250 mg/kg BW) daily (Zou et al., 2004; Silva et al., 2010).
2.5.3. Animal monitoring
Body weight and glucose levels (8 hours fasting) were recorded weekly. FBG was measured with the CounterTM blood glucose meter (Counter TS, Bayer, Germany) using whole blood from tail vein.
2.5.4. Clinical findings
Animals were observed in terms of common clinical signs during the entire experiment. The observed abnormalities were also recorded.
2.5.5. Collection of tissue and blood samples
At the end of the study, blood samples were collected and all animals were sacrificed for tissue sampling. For histopathological and further examinations, liver, spleen, lung, kidney, pancreas, and brown fat tissue were collected and properly stored.
2.5.6. Biochemical analysis
Serum samples were obtained by centrifugation of bloods at 10,600g for 15 min. Biochemical analyses were performed by using Mindray™ BS-200 clinical chemistry analyser and reagents (Mindray, Shenzhen, China). Biochemical analyses such as alkaline phosphatase (ALP), alanine aminotransferase (ALT), aspartate aminotransferase (AST), high-density lipoprotein cholesterol (HDL-C), low-density lipoprotein cholesterol (LDL-C), and total cholesterol (TC) were analysed according to Tang et al. (2013). Serum insulin levels were measured with a Mouse Insulin ELISA kit and recommended test procedure (ALPCO, 80-INSMS-E01, Salem, NH, USA).
2.5.7. Histopathological examination
Tissue samples were fixed with 10% formalin solution overnight. After fixation, samples were washed under running tap water for 8 hours and dehydrated in increasing alcohol series (70, 80, 90, and 100%) and xylene, prior to embedding in paraffin wax. Tissue sections (5–6 µm thick) were obtained using a microtome and stained with hematoxylin-eosin (H&E) (Fischer et al., 2008). Before staining, sections were deparaffinizated with xylene and rehydrated in a series of alcohol solutions of decreasing concentration. Sections were stained with hematoxylin for 5 min and then rinsed in running tap water. After washing, they stained with eosin for 5 min and rinsed in running tap water. The stained sections were dehydrated, cleared, and mounted. The H&E stained tissue sections were examined under a light microscope.
2.6. Oral glucose tolerance test (OGTT)
At the end of the study, control, HFD, GTP-HFD, and BTP-HFD groups were subjected to OGTT (Gilbert et al., 2011). These mice were fasted overnight before the test but provided free access to water. D-glucose (dextrose) was dissolved in pure water and orally administered to the fasted mice (2 g/kg BW) by oral gavage. After glucose administration, blood samples were collected and glucose levels measured at 0, 30, 60, and 120 min with the CounterTM blood glucose meter (Counter TS, Bayer, Germany). The integral values of the area under the curve (AUC) of blood glucose levels during the test period were calculated by the formula: AUC (mmol/L*min) = [½ × (G0min+G30min) × 30] + [½ × (G30min+G60min) × 30] + [½ × (G60 min+G120min) × 60].
2.7. Statistical analysis
All values were presented as the mean ± standard deviation (mean ± SD). Statistical analysis of the data was carried out using the Statistical Package for the Social Sciences software 17.0 (SPSS Incorporation, Chicago, IL, USA) and Microsoft Excel. Significance was accepted as P-value < 0.05. The one-way ANOVA test was used to determine multiple comparisons between groups for parametric hypotheses. Although Wilcoxon test was used to pairwise comparisons, Kruskal-Wallis test was used to multiple comparisons for nonparametric hypotheses. Pearson and Spearman correlation methods were used for correlation analysis.
| 3. Results and discussion | ▴Top |
3.1. FBG levels in diet and control groups
FBG levels in model (W0-W8) and treatment (W8-W14) periods of all groups are presented in Figure 2. Measurements were performed weekly after starvation for 8 hours. Although significant decreases (P < 0.05) between model and treatment periods were observed in the ND, GTPS-ND, BTPS-ND, and BTPS-HFD groups, GTPS-HFD group showed a significant increase (P < 0.05) during the treatment period. No significant changes (P > 0.05) between the two periods existed in the control, HFD, and Met-HFD groups. It was interesting to note that while GTPS-HFD group showed an increase, GTPS-ND group decreased during the treatment period (Figure 2). It was thought that the decreasing of FBG level in GTPS-ND group could also be related with diet rather than the expected antidiabetic effect of GTPS. The primary outcome of this result demonstrated that BTPS fed even HFD group had a significant effect (P < 0.05) on the regulation of FBG level.
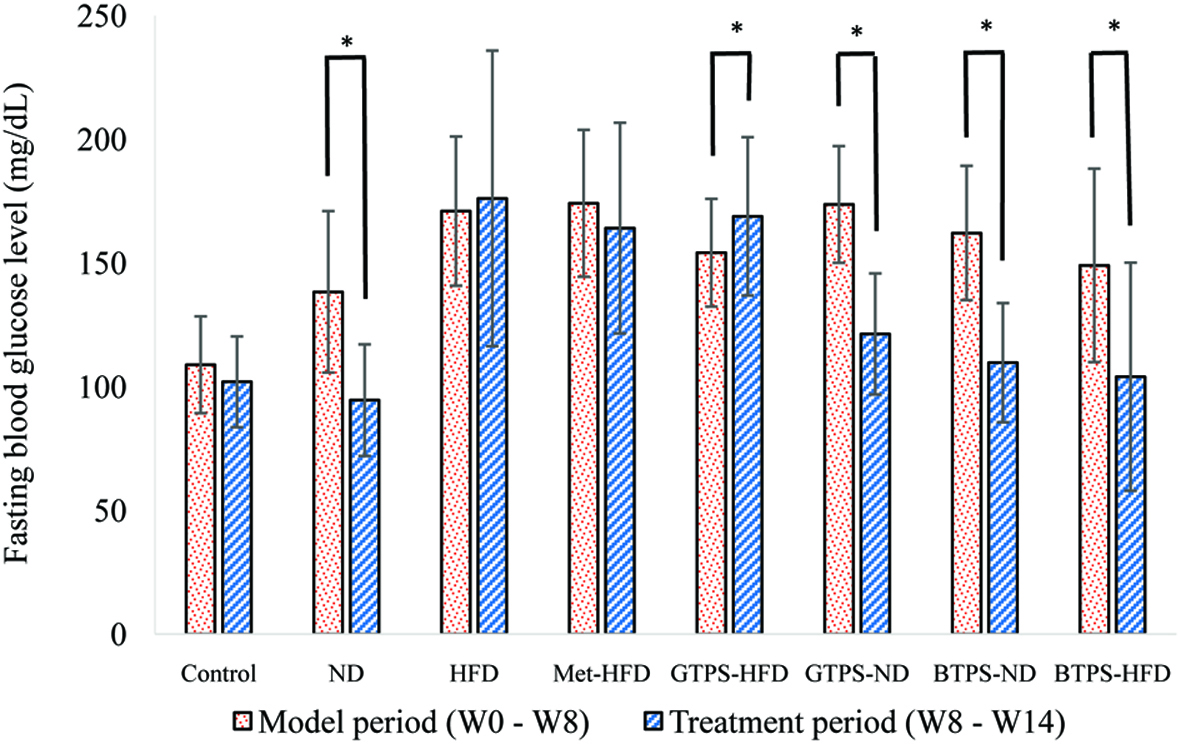 Click for large image | Figure 2. Fasting blood glucose levels in model and treatment periods. *Indicates significant differences between the two periods. Statistical analysis was performed using the Wilcoxon test (*P < 0.05). Abbreviations: BTPS, black tea polysaccharides; HFD, high-fat diet; GTPS, green tea polysaccharides; Met, metformin; ND, normal diet. |
The hypoglycaemic effects of TPS have previously been shown in several studies (Zhou et al., 2007; Wei et. al., 2012; Li et al., 2015) and the results from this work on BTPS are consistent with those in the literature, despite different black tea samples (e.g., their origins and phytochemical contents). Molecular mechanisms under the hypoglycaemic activities of TPS were investigated on HFD- and STZ-induced diabetic mice via the PI3K/Akt signalling pathway. TPS could upregulate the expressions of PI3K, p-Akt, and GLUT4 proteins in liver cells (Li et al., 2015). In another study conducted by Wang et al. (2015), hypoglycaemic mechanism of TPS was studied by gene expression analysis in RIN-5F cell line. Results showed that GLP-1R, PKA, PDX-1, INS-1, INS-2, GLUT2, and GCK genes were upregulated at the level of mRNA. These results suggested that TPS has increased glucose-stimulate-insulin-segregation via cAMP-PKA pathway. A water-soluble polysaccharide, 7WA isolated from the leaves of green tea with an average molecular mass of 7.1 × 10⁴ Da, mainly contains arabinose and galactose in the molar ratio of 1.0:0.96. It was characterized to possess a backbone consisting of 1,3- and 1,6-linked galactopyranosyl residues, with branches attached to O-3 of 1,6-linked galactose residues, and O-4 and O-6 of 1,3-linked galactose residues. It was shown that the 7WA with these chemical properties significantly augmented insulin secretion at high glucose level (25 mM) according to the results of glucose-stimulated insulin secretion (Wang et al., 2015).
Tea consumption significantly decreased blood glucose levels by increasing hepatic glycogen level inalloxan-diabetic rats, possibly through reactivation of the glycogen synthase system and decreasing liver glucose-6-phosphatase activity, which is mainly responsible for releasing glucose molecules to the blood by converting glucose-6-phosphate to glucose (Ramadan et al., 2009). It was reported that the increase in insulin-stimulated glucose uptake, inhibition of the intestinal GLUT system, and decrease in expression of genes that control gluconeogenesis are the mechanisms proposed to be responsible for the anti-hyperglycaemic effect of tea (Anandh-Babu et al., 2006). Moreover, Das et al. (2005) found that black tea extract was found to quench reactive oxygen species such as singlet oxygen, superoxide, and hydroxylradicals, which may explain its hypoglycaemic activity.
The antidiabetic effects of several tea flavonoids such as, kaempferol, epicatechin gallate, catechin, and epigallo catechin gallate have already been reported in different studies. Their effects have been associated with decreasing hyperglycemia, hepatic lipid accumulation, and insulin-dependent glucose uptake as well as increasing glucose uptake, beta-cell survive, antioxidant defence, adiponectin synthesis, and insulin secretion (Hossain et al., 2016).
It is well-known that the composition and diversity of the intestinal microbiota were also affected by diabetes. In a previous study showed that the γ-aminobutyric acid (GABA)-producing Lactobacillus brevis DPC 6108 and pure GABA has protective effects against the development of diabetes in STZ-induced diabetic Sprague Dawley rats. In this study, glucose levels were decreased in diabetic rats receiving L. brevis DPC 6108, compared with diabetic controls (Marques et al., 2016). In addition, oral administration of L. paracasei TD062 induced α-glucosidase inhibitory activity and ameliorated lipid metabolism, oxidative stress, and glucose metabolism (Dang et al., 2018).
The antidiabetic effects of tea polysaccharides may also be associated with their possible positive effects on the gut microbiota. However, additional studies are needed to better understand the relations between gut microbiota and tea polysaccharides as a possible probiotic effect.
3.2. OGTT levels in diet and control groups
The effects of TPS on impaired glucose tolerance were also investigated. After the application of glucose solution (2 g/kg BW), blood glucose level was measured 4 times at 30 min intervals. The results obtained showed that the control and BTPS-HFD groups had similar blood glucose profiles during the test periods. On the other hand, HFD and GTPS-HFD groups had similar profiles. The integral values of the AUC during the test periods were calculated and are presented in Figure 3. The AUC values were significantly elevated in the HFD and GTPS-HFD groups compared to that of the control group (P < 0.05). The BTPS-HFD group had a similar AUC value with the control group, such as blood glucose levels revealed in OGTT. It was clearly observed that the deteriorated glucose metabolism was remarkably restored in BTPS even when fed with HFD. Since dysglycaemia values are an important predictor of diabetes, the results of the HFD and GTPS-HFD groups showed significantly higher (P < 0.05) AUC values as an indicator of glucose intolerance compared to that of the control group and the BTPS-HFD group (P < 0.05) (Tang et al., 2013).
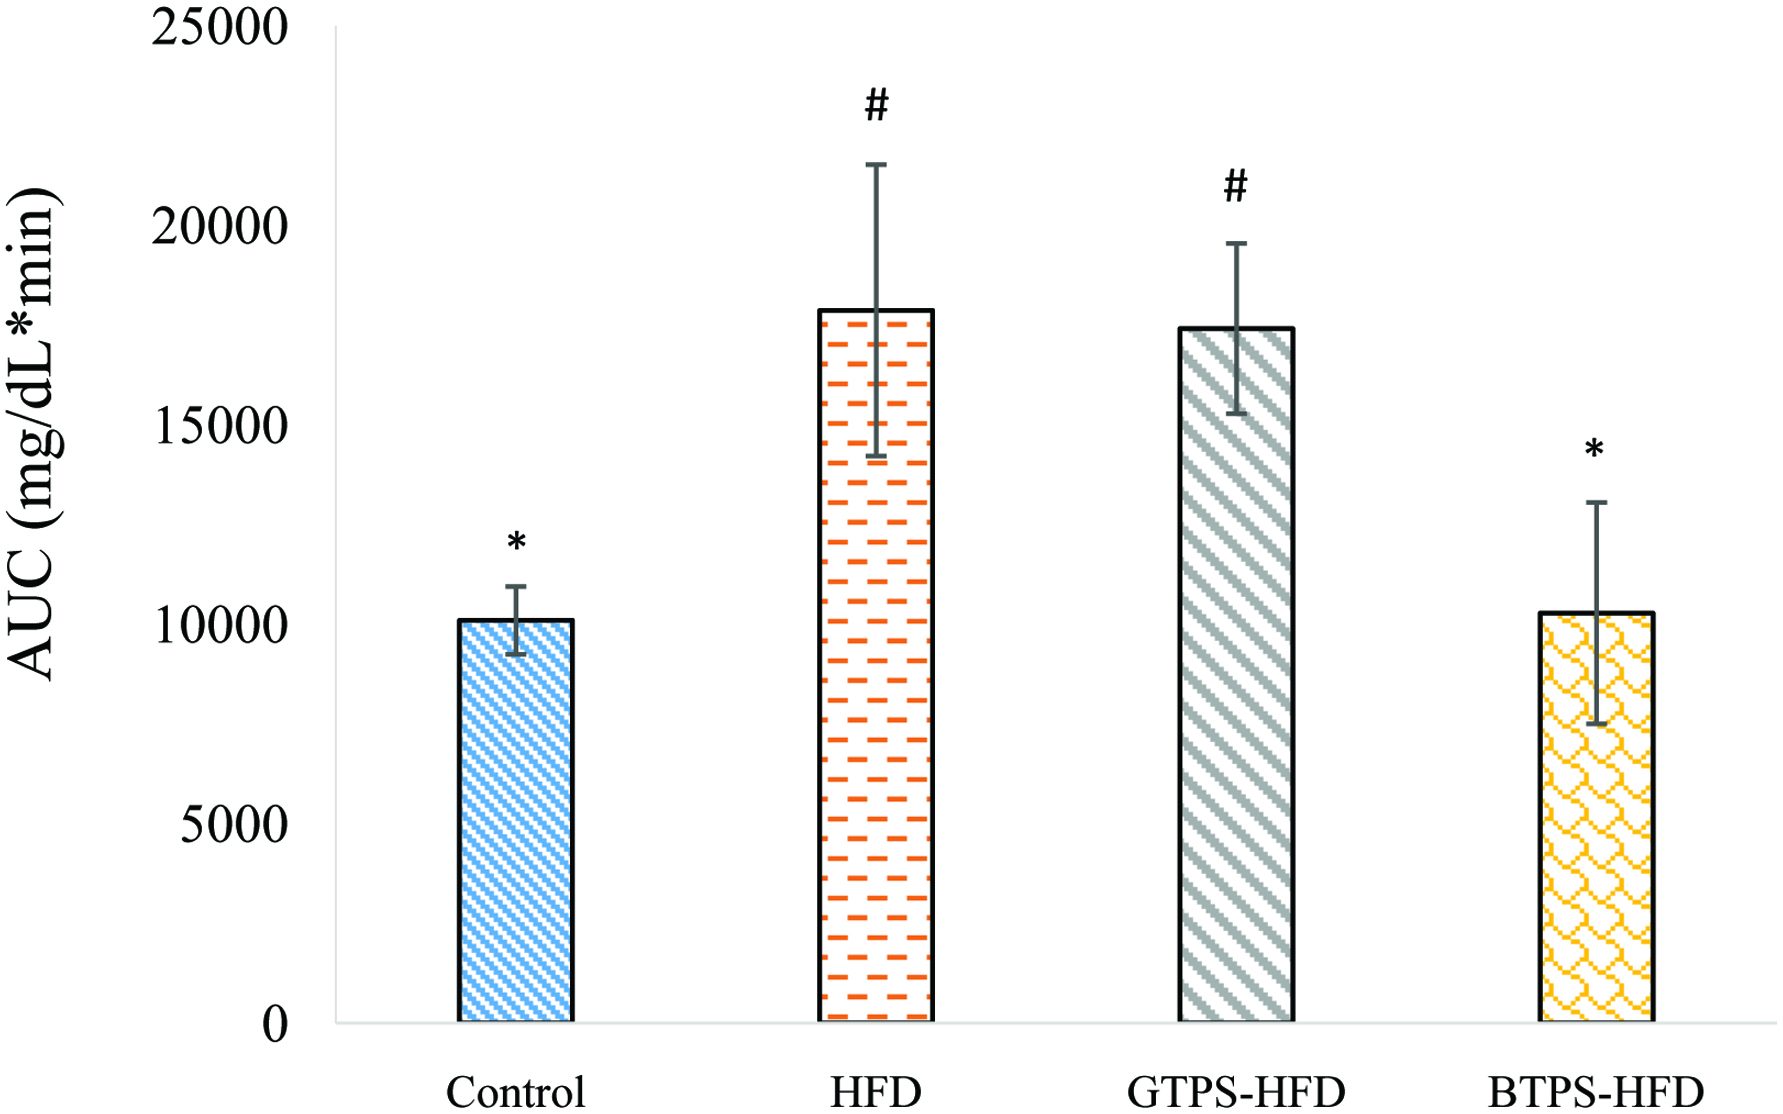 Click for large image | Figure 3. AUC of OGTT in control, HFD, GTPS-HFD, and BTPS-HFD groups. *Indicates significant difference from HFD group. #Indicates significant difference from the control group. Statistical analysis was performed using the Kruskal-Wallis Test (*P < 0.05, #P < 0.05). Abbreviations: BTPS, black tea polysaccharides; HFD, high-fat diet; GTPS, green tea polysaccharides. |
3.3. Plasma insulin levels in diet and control groups
At the end of the treatment period, all mice were sacrificed and blood samples were collected. As can be seen from Figure 4, plasma insulin levels showed significant variations among the groups, albeit to different extents. Insulin levels were significantly decreased (P < 0.05) in the ND, GTPS-ND, BTPS-ND, and BTPS-HFD groups compared to the control group.
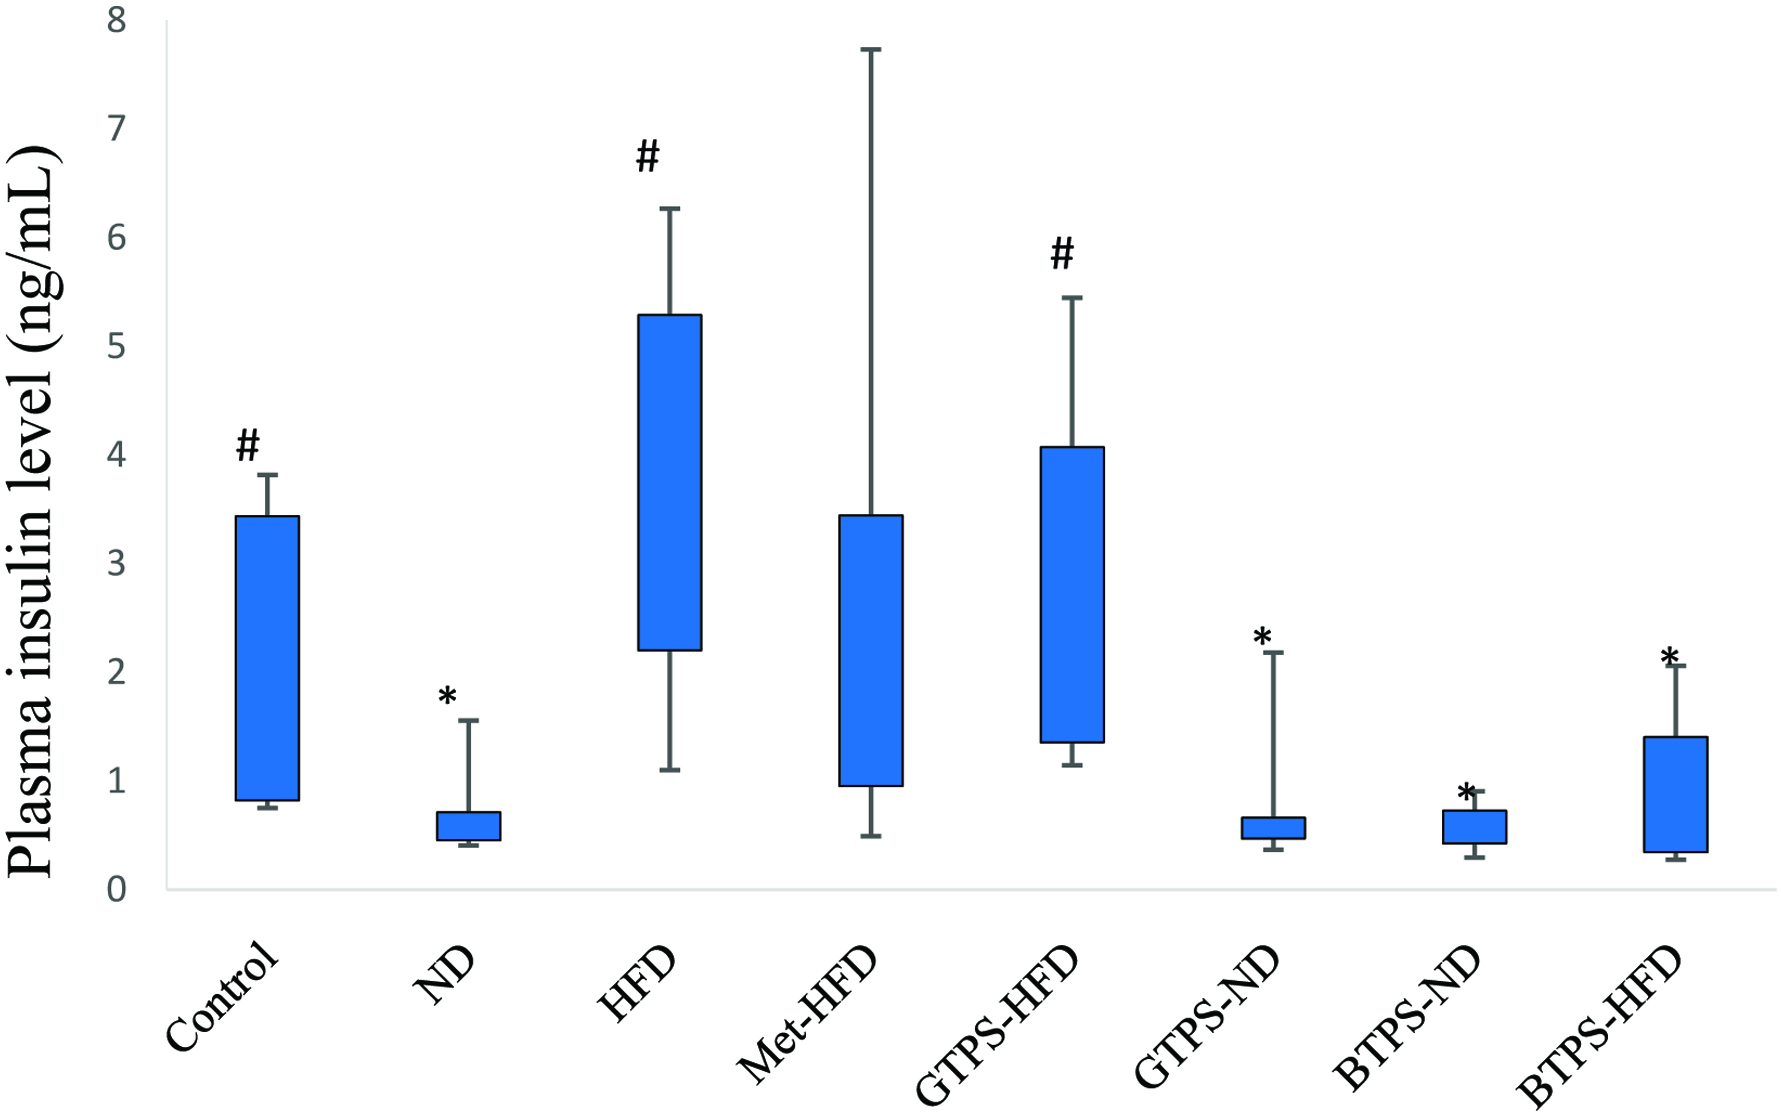 Click for large image | Figure 4. Plasma insulin levels in mice blood collected at the end of the treatment period. *Indicates significant difference from control group. #Indicates significant difference from ND group. Statistical analysis was performed using the Kruskal-Wallis Test (*P < 0.05, #P < 0.05). Abbreviations: BTPS, black tea polysaccharides; HFD, high-fat diet; GTPS, green tea polysaccharides; Met, metformin; ND, normal diet. |
Insulin levels were also analysed according to the percentage of FBG differences between model and treatment periods. A significant negative correlation existed between the insulin level and % FBG reduction in all groups (P < 0.05) (Table 1).
 Click to view | Table 1. Correlation between percentage mean reduction of FBG and insulin levels |
One of the determinant factors of T2D is the development of insulin resistance. Hyperglycaemia is accompanied by the insulin resistance caused by increased amount of insulin in the blood serum. On this basis, BTPS did not have an insulin resistance even fed with a HFD since this group had no elevated blood glucose level and increased insulin secretion. A similar finding was also observed for GTPS-ND group, but not for GTPS-HFD group. Therefore, attenuated blood glucose and low insulin levels in GTPS-ND group might be due to dietary factors. Additionally, all findings were consistent with OGTT results (Figure 3). When the serum insulin levels and OGTT results were evaluated together, the BTPS-HFD group was the only one that had normal insulin and glucose metabolism with decreased blood glucose level, normal insulin secretion and significantly improved glucose tolerance even when fed with a HFD. As expected, similar results were also recorded for BTPS-ND group due to normal diet and identified antidiabetic effects of BTPS.
3.4. Biochemical parameters in diet and control groups
Table 2 summarises the liver enzymes (ALP, ALT, and AST) and blood lipid profiles (HDL-C, LDL-C, and TC) among the control and diet groups as well as reference values (Danneman et al., 2012). These are common parameters used in this type of studies. ALP, AST, and ALT are well-known commonly used liver enzyme parameters for hepatic function (Kusakabe et al., 2009).
Click to view | Table 2. Liver enzymes and blood lipids among control and diet groups (mean ± SD). Bold indicates out of the reference values |
These results showed that liver damage resulting from STZ and diet induced diabetes were significantly attenuated by treatment with BTPS. According to the results, out of limit values were recorded for ALP and AST in GTPS-HFD group. It might be accepted as a sign of liver damage associated with diabetes (Harris, 2005). In contrast, no abnormal values were observed in the BTPS-HFD group for the three liver parameters (Table 2).
With respect to lipid profiles, there were no meaningful differences between diabetic animals treated with GTPS and BTPS. TC levels were recorded as normal on GTPS-HFD and BTPS-HFD groups, but TC levels in GTPS-ND and BTPS-ND groups were lower than that of the limit values. The HFD group had significantly higher (P < 0.05) TC level compared to those of the GTPS-HFD and BTPS-HFD groups. Thus, it appears that TPS might have a balancing effect on plasma lipid levels.
3.5. Body weight changes in diet and control groups
Figure 5 shows body weight changes of the control and diet groups (control, ND, HFD, Met-HFD, GTPS-ND, GTPS-HFD, BTPS-ND, and BTPS-HFD) during the model (W0-W8) and treatment (W8-W14) periods. Body weight changes of the control group showed normal tendency during the model and treatment periods since time-dependent weight gain was normal. When fed with a HFD, the test groups had an average weight of 34.28 g, depending on the STZ application. This finding showed that diabetic mice became 30% heavier than those in the control group. During the treatment period (W8-W14), significant weight losses (P < 0.05) were observed in ND, GTPS-ND, and BTPS-ND groups as compared to the model period (W0-W8). There was a decreasing tendency in BTPS-HFD group, but it was not significant (P > 0.05) (Figure 5). In addition, although some weight gains were observed in the HFD, Met-ND, and GTPS-HFD groups during the treatment period, this was only significant in the HFD group (P < 0.05). According to the results, BTPS-HFD group showed a decreasing weight gain in diabetic mice during the treatment period. This effect was not obtained in GTPS-HFD group (Figure 5). BTPS-HFD group effectively suppressed the body weight gain despite the high energy intake.
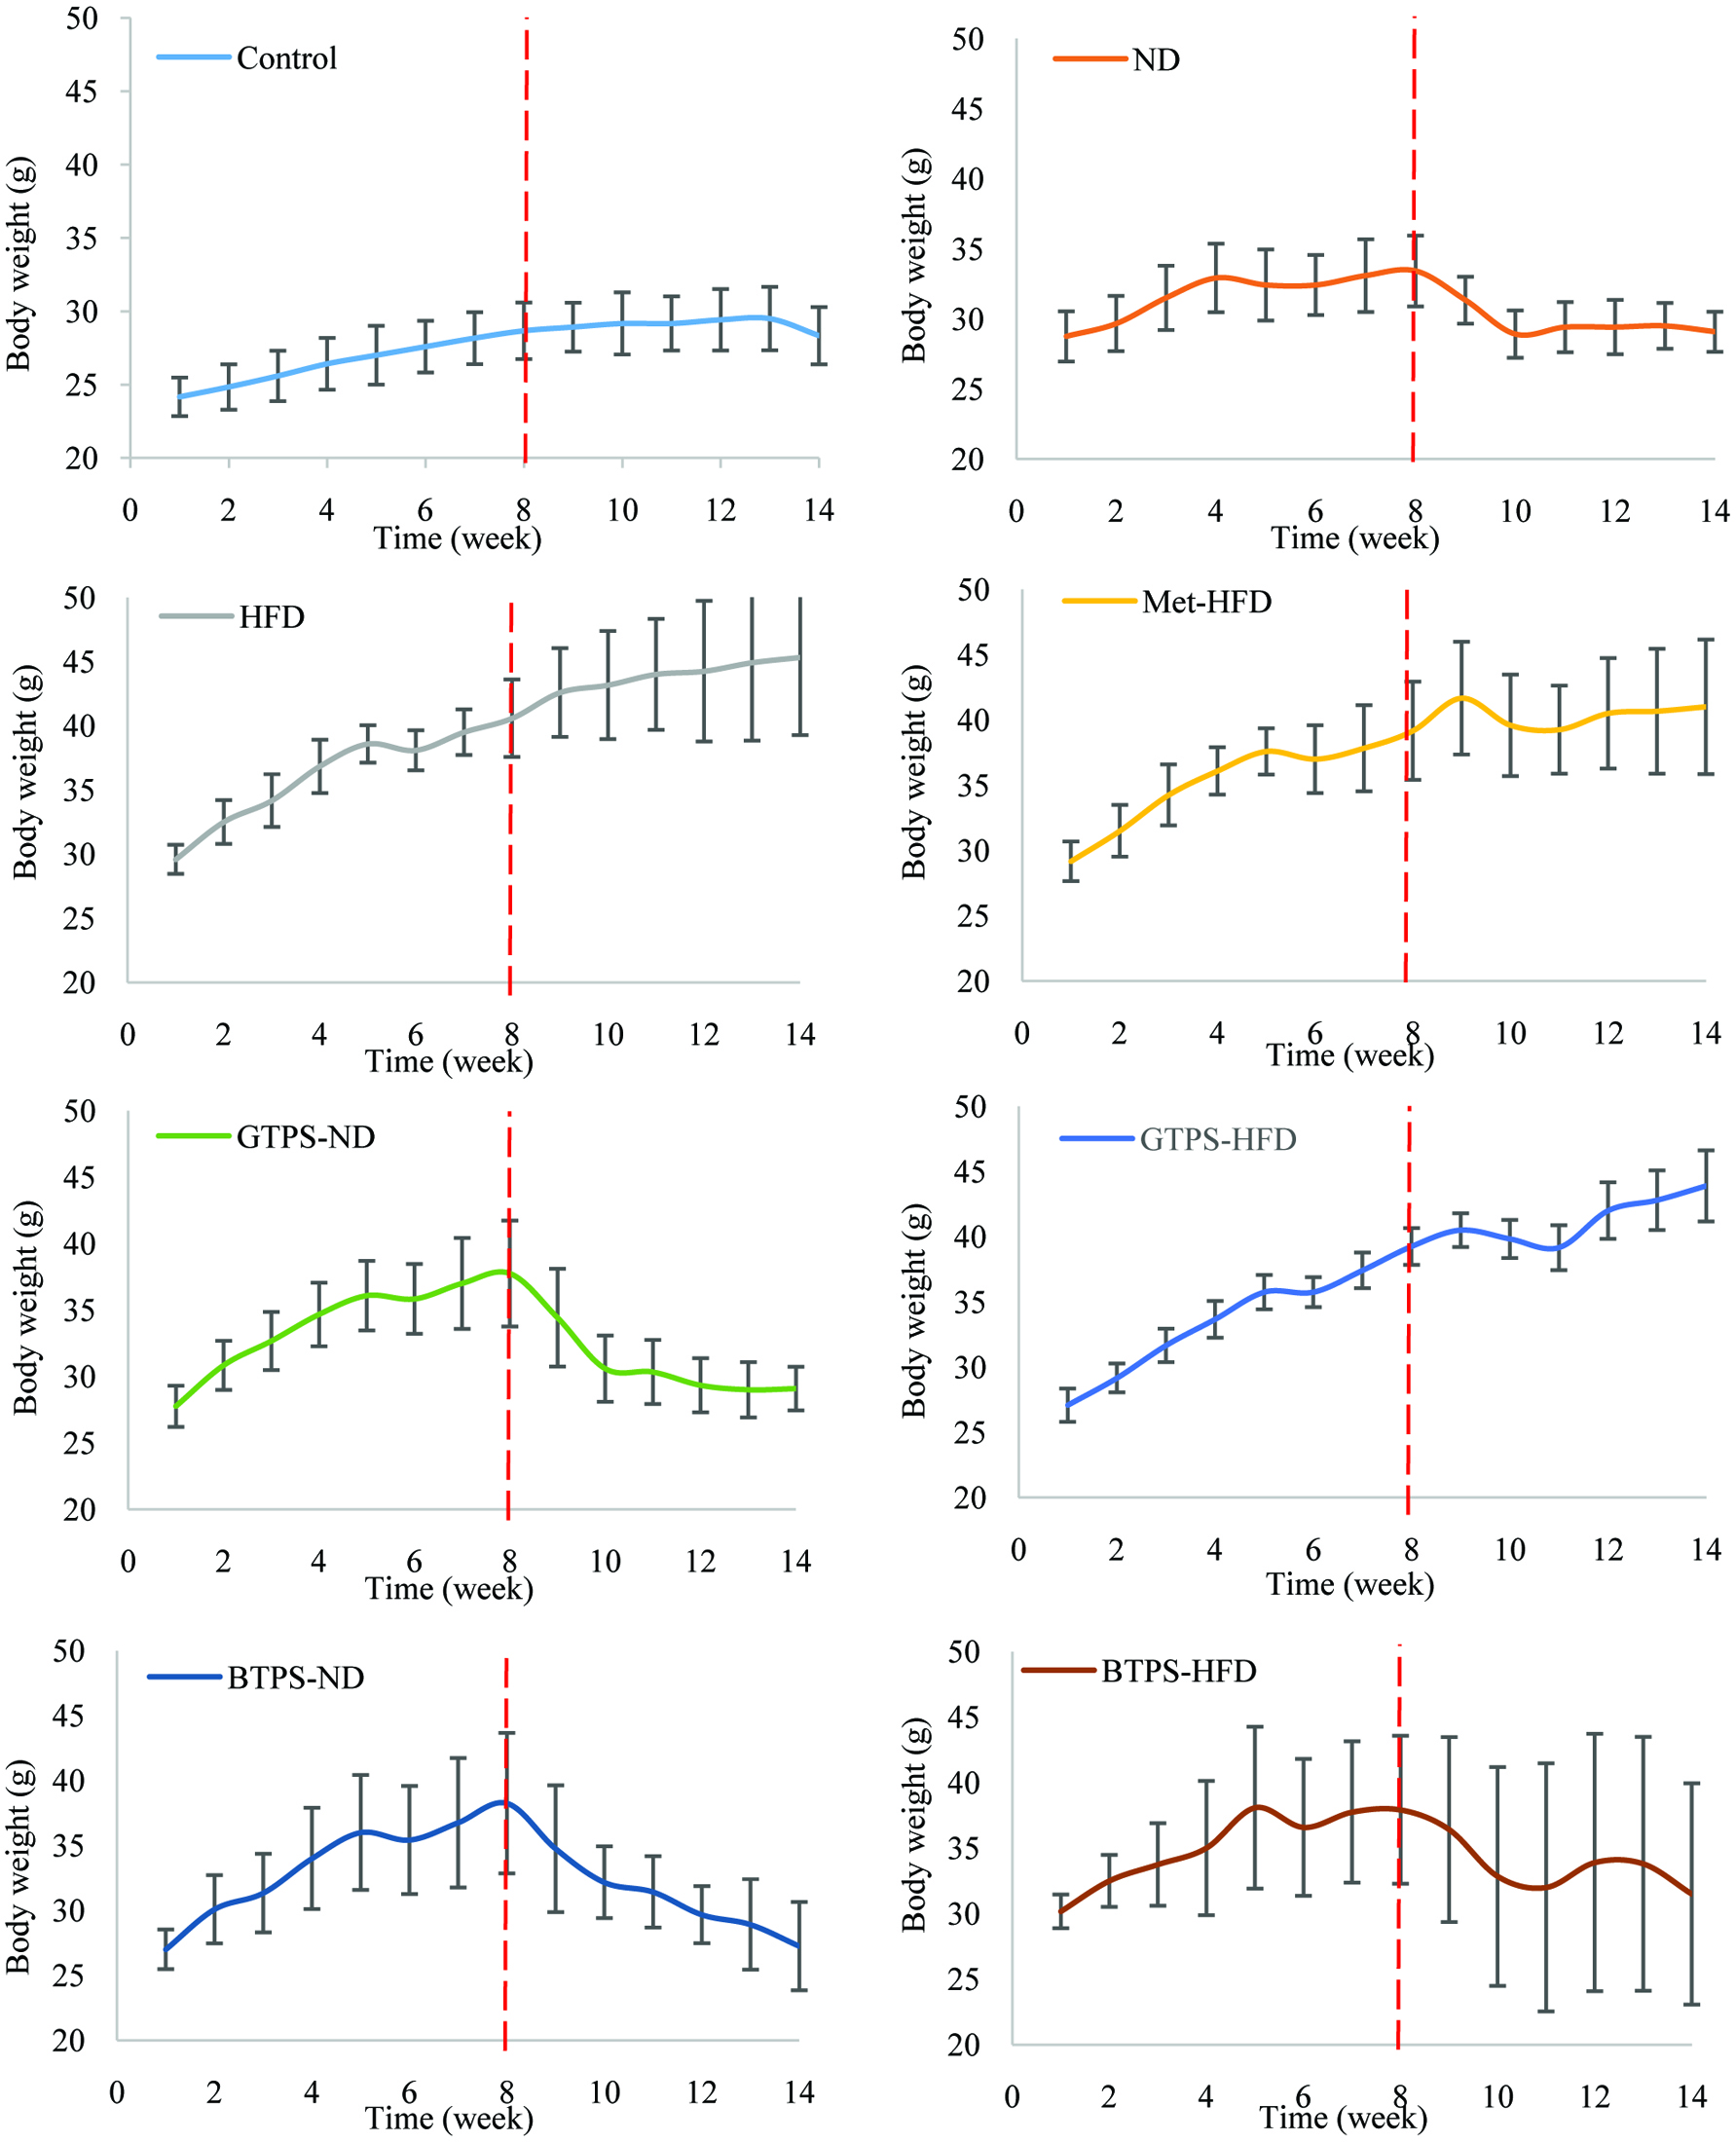 Click for large image | Figure 5. Body weight changes of study groups during the model (W0–W8) and treatment (W8–W14) periods. Dashed red line indicates the eighth week to separate the model and treatment periods. Abbreviations: BTPS, black tea polysaccharides; HFD, high-fat diet; GTPS, green tea polysaccharides; Met, metformin; ND, normal diet. |
Wu et al. (2018) found that oolong tea polysaccharides and polyphenols had an antiobesity effect and prevented weight gain due to a synergistic effect. Similar effects were also found by Xu et al. (2015) using green tea polysaccharides. In another study, significant antiobesity effect on high dose of black tea polysaccharides was reported in HFD induced female CD-1 mice model (Huang et. al., 2009). In the present study, BTPS-HFD and GTPS-HFD groups were comparatively studied and antiobesity effect was only observed in the BTPS-HFD group.
3.6. Histopathology of liver tissue in diet and control groups
Figure 6 shows the hematoxylin-eosin-stained liver sections from mice (X10-magnification).
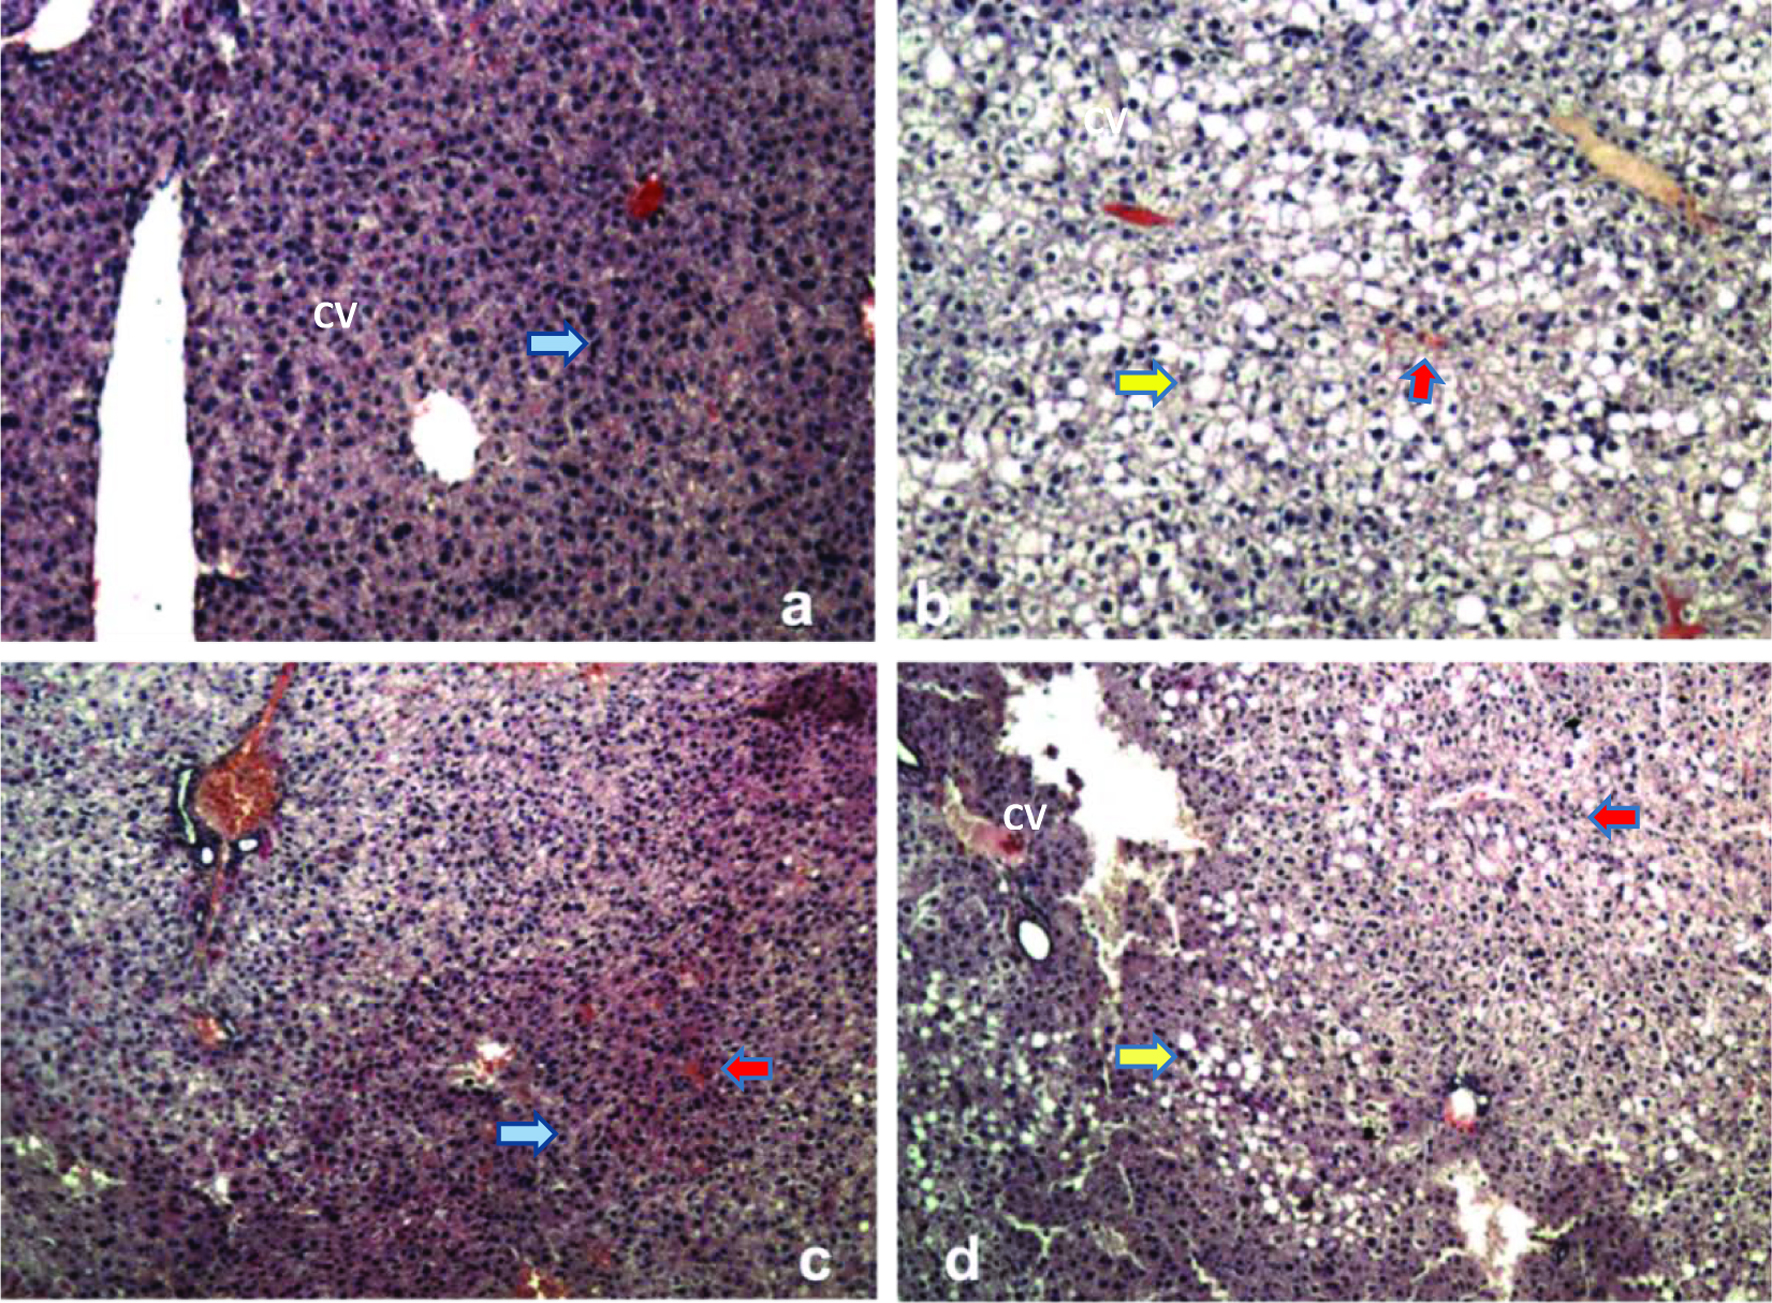 Click for large image | Figure 6. Hematoxylin-eosin-stained liver sections from mice (X10-magnification). a) Control group showing normal hepatic tissue formation with central vein (CV) and surrounding hepatocytes and sinusoids (blue arrow), b) HFD group, c) BTPS-HDF group, and d) GTPS-HFD group. Yellow and red arrows indicate the vacuoles/lipid droplets and sinusoidal dilatation in the liver tissues, respectively. Abbreviations: BTPS, black tea polysaccharides; HFD, high-fat diet; GTPS, green tea polysaccharides. |
Liver tissue of the control group revealed normal morphology as expected. Sinusoidal dilatation and hepatocellular vacuolization were observed in HFD and GTPS-HFD groups. Formation of vacuoles indicates the serious lipid droplet accumulation in hepatocytes in diabetic mice (Tang et al., 2013). Sinusoidal dilatation is a sign of deformation in sinusoidal space located between blood vessels and hepatocytes. This deformation is generally caused by the structural deterioration of blood vessel walls, which is typically observed in diabetes (Aboonabi et al., 2014). Conversely, histopathological examinations of liver tissues from BTPS-HFD group exhibited a significant improvement. Histological pathologies monitored in HFD and GTPS-HFD groups were not observed in BTPS-HFD group (Figure 6). These findings clearly point out to the regenerative effect of BTPS against liver damage caused by diabetes.
| 4. Conclusion | ▴Top |
It was clearly demonstrated that BTPS had a remarkable effect on T2D mice even when fed with a HFD. Unlikely, this effect was not observed in GTPS-HFD group. BTPS possessed hypoglycaemic and antiobesity effects in diabetic mice. In addition, BTPS could ameliorate insulin intolerance, liver damage, and deteriorated blood lipid profiles associated with STZ- and HFD-induced diabetes. Considering all these results, the antidiabetic effect of BTPS might be achievable by improving the action of secreted insulin.
Acknowledgments
This study is a part of project funded by TÜBİTAK (under 1003 programme–Project No 105O902).
| References | ▴Top |