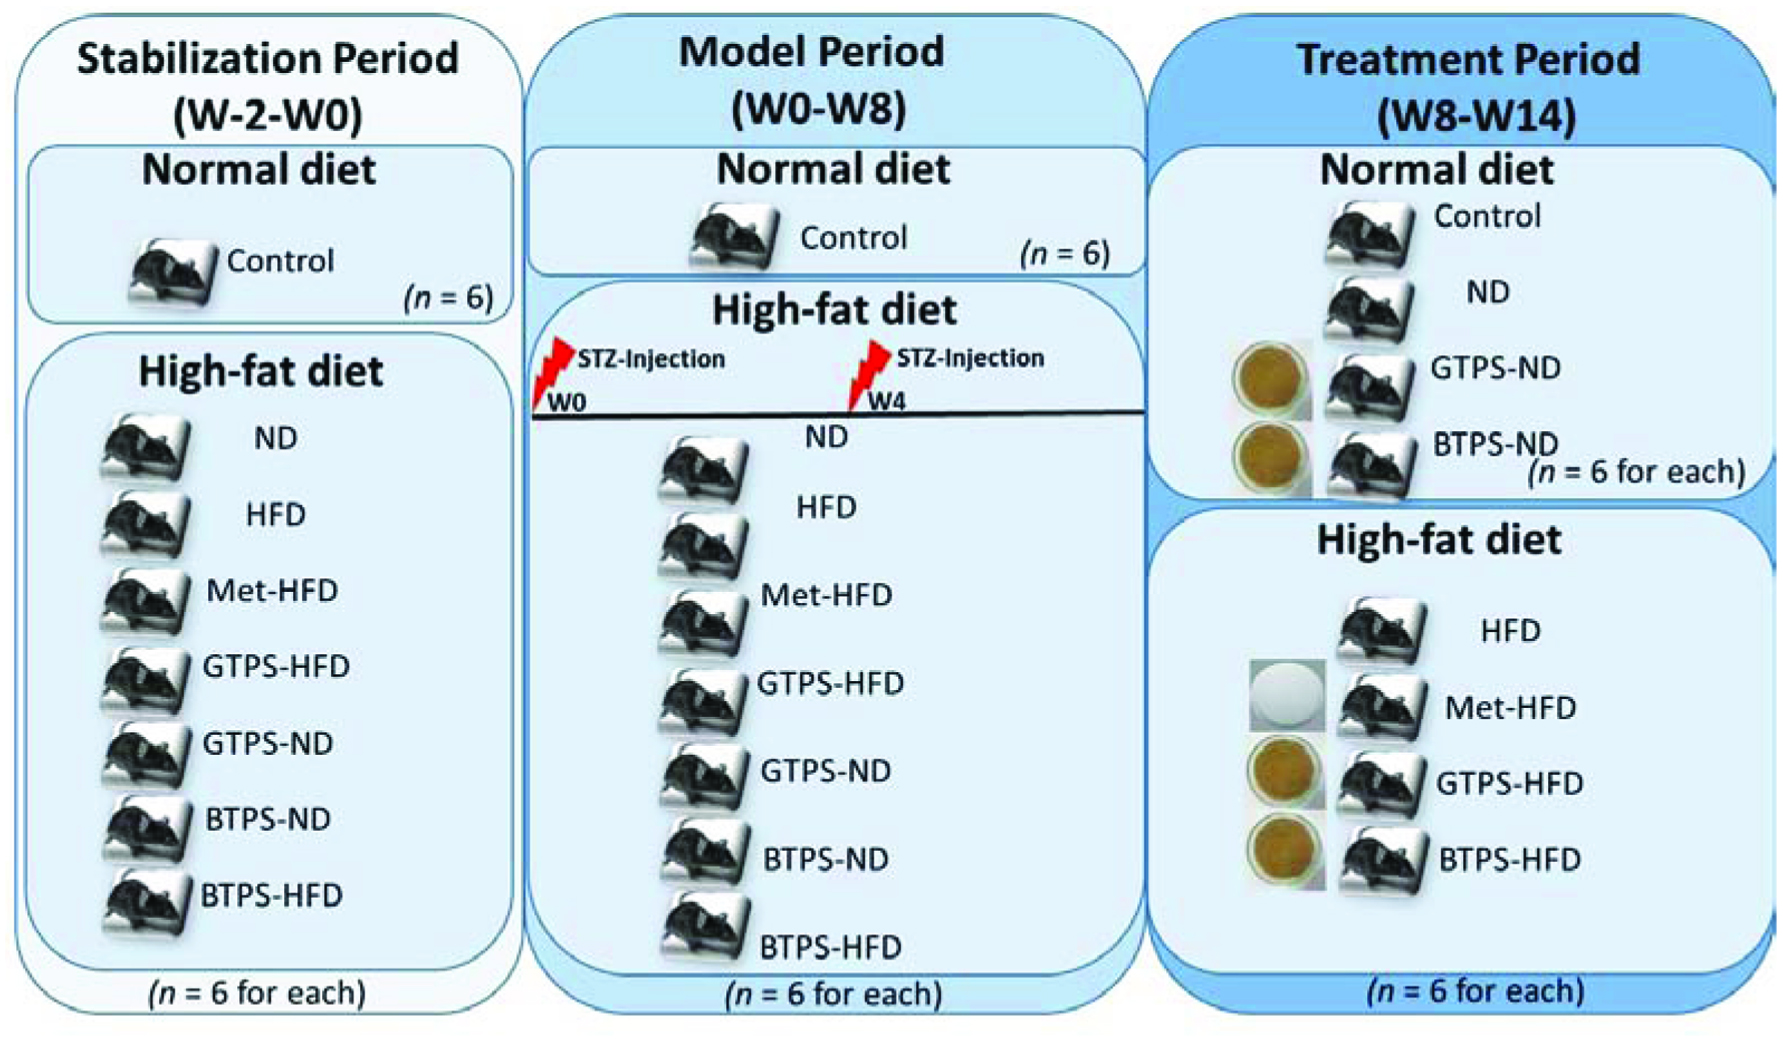
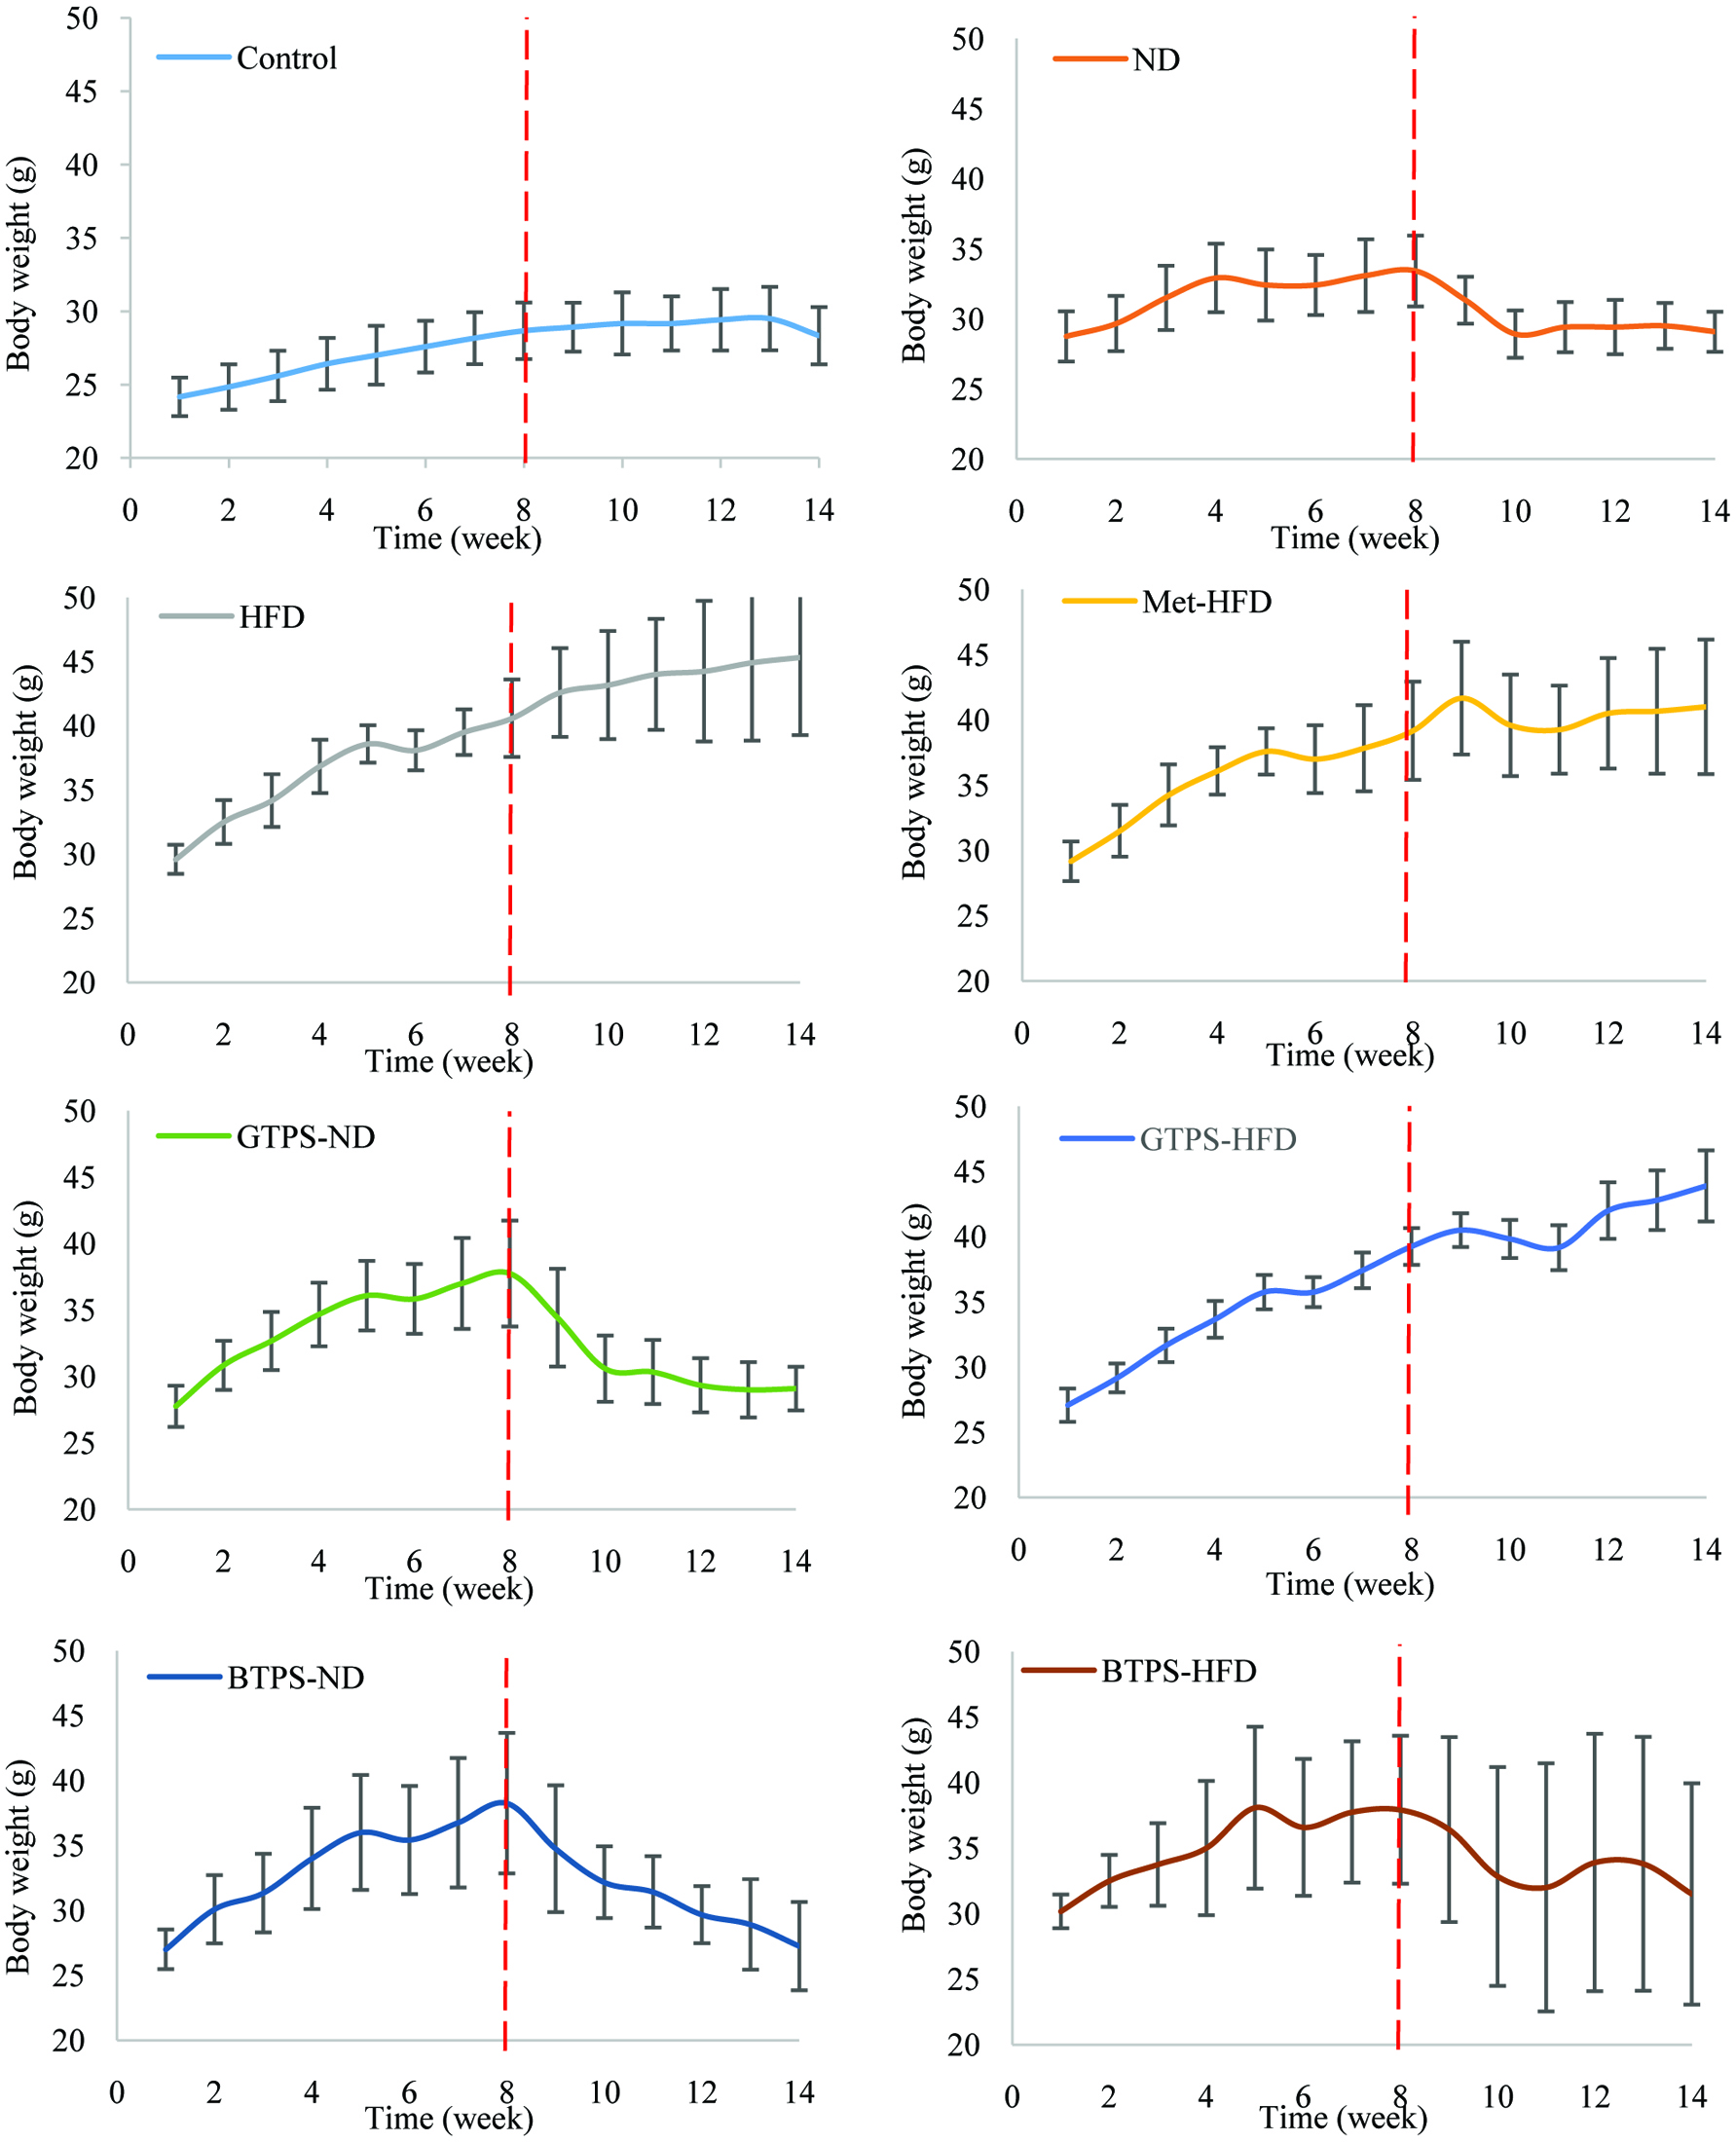
Figure 1. Study design and diet. Abbreviations: BTPS, black tea polysaccharides; GTPS, green tea polysaccharides; HFD, high-fat diet; Met, metformin; ND, normal diet; STZ, streptozotocin; W, week.
| Journal of Food Bioactives, ISSN 2637-8752 print, 2637-8779 online |
| Journal website www.isnff-jfb.com |
Original Article
Volume 8, December 2019, pages 74-83
In vivo antidiabetic activities of green and black tea polysaccharides using streptozotocin-induced diabetic mice fed with a high-fat diet
Figures
Tables
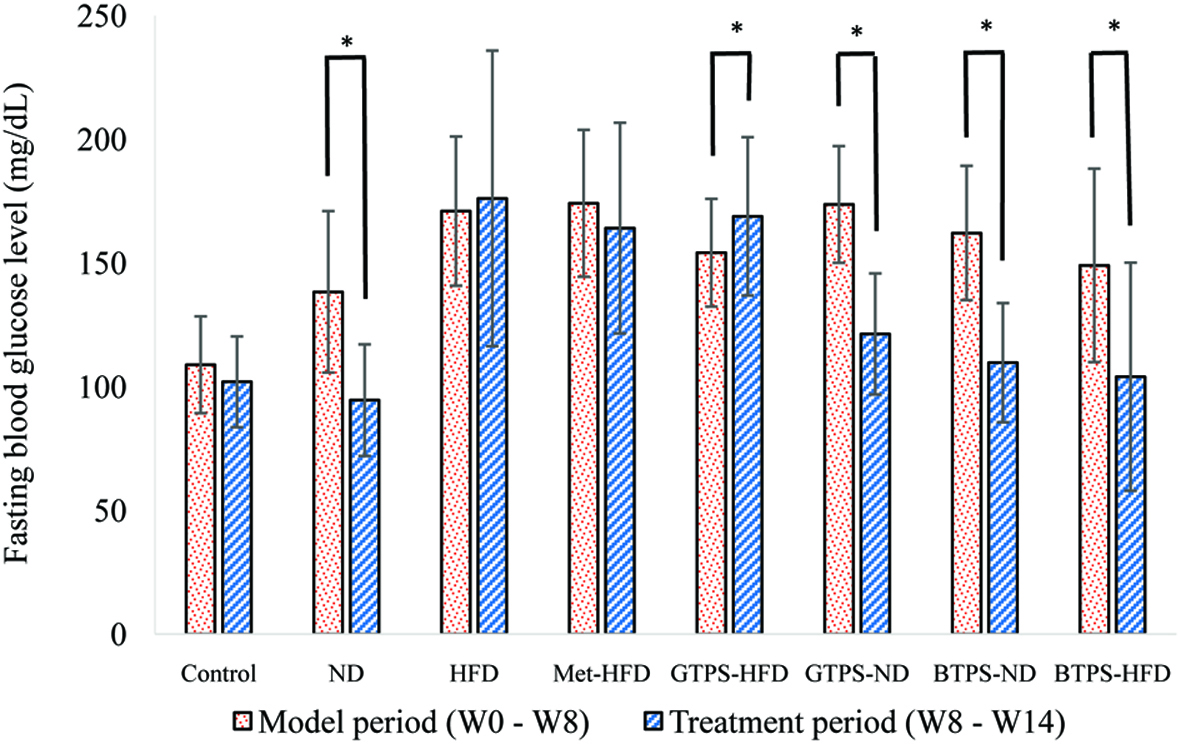
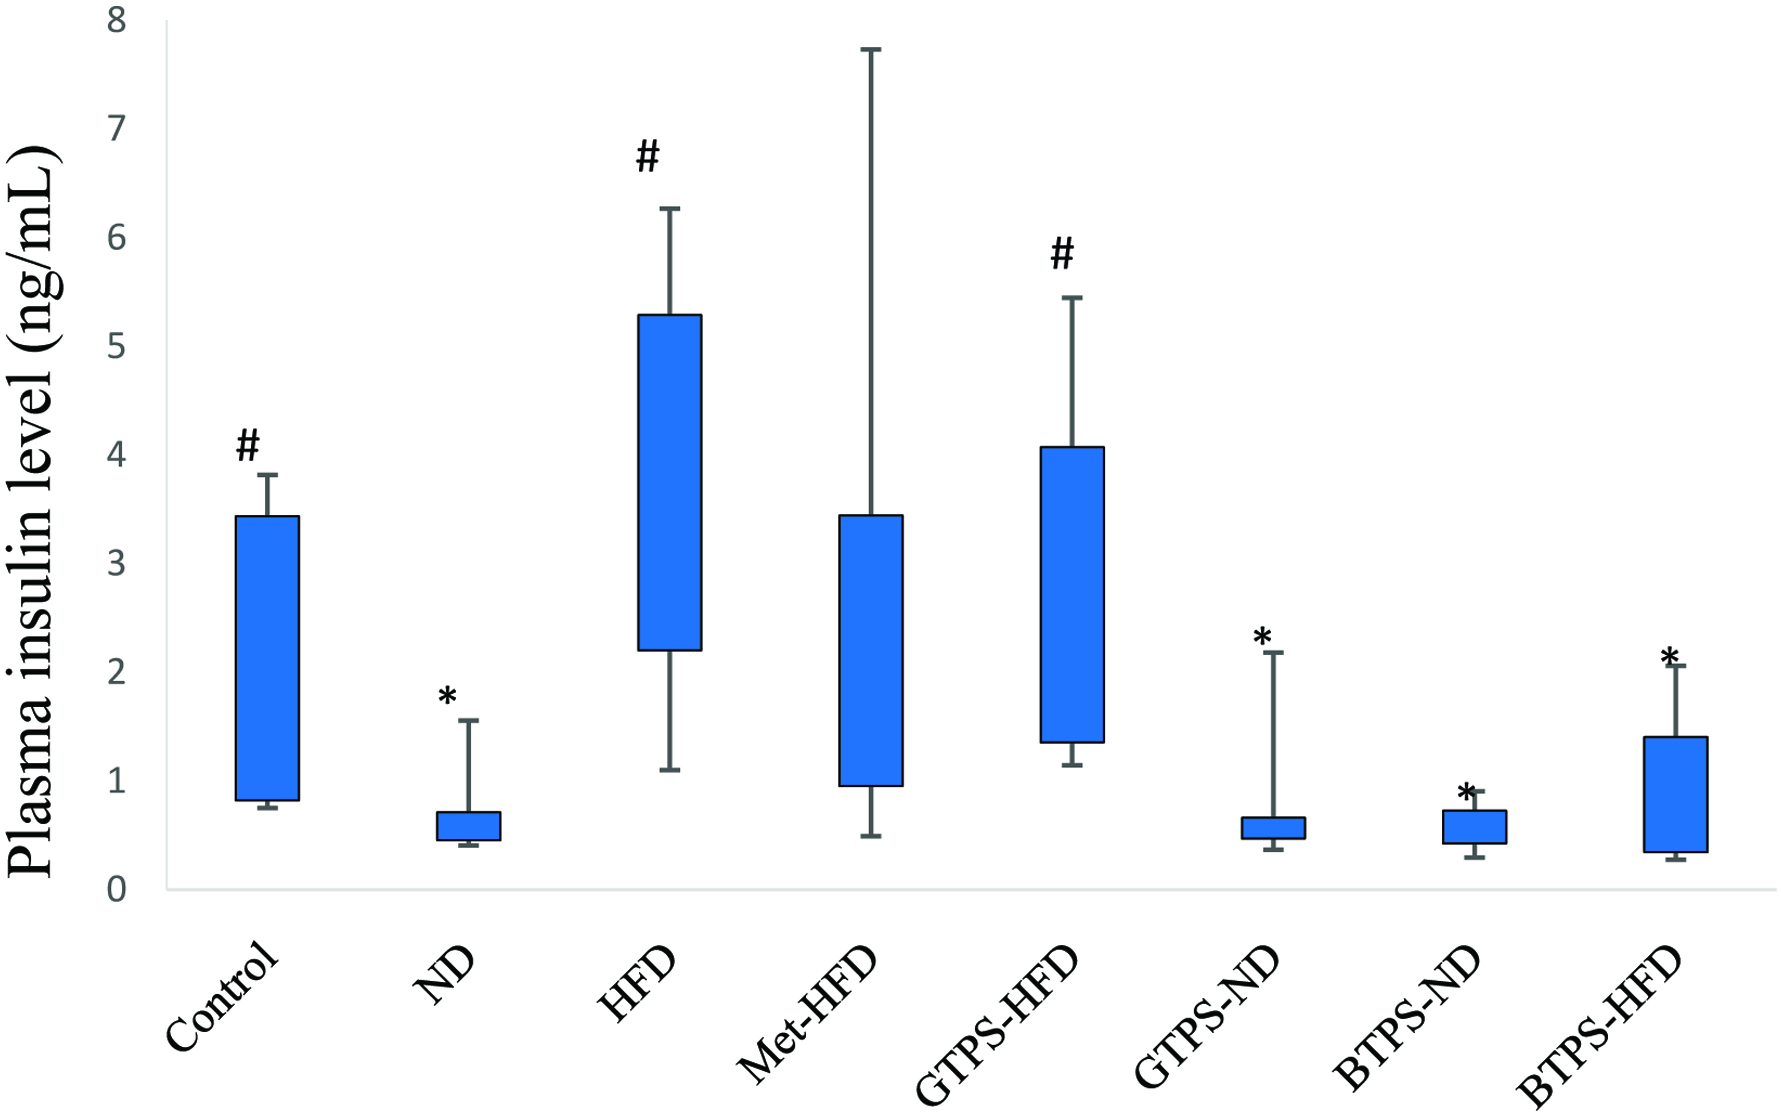
| Group | Reduction of FBG level (%) | Insulin levels (ng/mL) |
|---|---|---|
| Abbreviations: BTPS, black tea polysaccharides; FBG, fasting blood glucose; GTPS, green tea polysaccrides; HFD, high-fat diet; Met, metformin; ND, normal diet. r = Correlation, which is significant at the 0.01 level. Reduction of fasting blood glucose level (%) = 100 × (FBGx − FBGy)/FBGx. x: Average FBG of 1 to 8 weeks, y: Average FBG of 8 to 14 weeks. | ||
| Control | 6.46 | 2.07 ± 1.27 |
| ND | 30.57 | 0.73 ± 0.43 |
| HFD | −2.26 | 3.49 ± 1.78 |
| Met-HFD | 7.10 | 2.64 ± 2.62 |
| GTPS-HFD | −3.01 | 3.01 ± 1.50 |
| GTPS-ND | 30.43 | 0.68 ± 0.44 |
| BTPS-ND | 35.28 | 0.62 ± 0.18 |
| BTPS-HFD | 31.72 | 0.82 ± 0.64 |
| Group | ALP (IU/L) | ALT (IU/L) | AST (IU/L) | HDL-C (mg/dL) | LDL-C (mmol/L) | TC (mg/dL) |
|---|---|---|---|---|---|---|
| Abbreviations: ALP: alkaline phosphatase; ALT: alanine aminotransferase; AST: aspartate aminotransferase; BTPS, black tea polysaccharides;GTPS, green tea polysaccrides; HDL-C: serum high-density lipoprotein cholesterol; HFD, high fat diet; LDL-C: serum low-density lipoprotein cholesterol; Met, metformin; ND, normal diet; TC: total cholesterol. | ||||||
| Control | 59.6 ± 5.5 | 38.7 ± 5.9 | 116 ± 25.1 | 42.7 ± 4.2 | 0.2 ± 0.1 | 62.4 ± 5.0 |
| ND | 57.1 ± 6.9 | 33.3 ± 12.4 | 88.0 ± 73.6 | 42.0 ± 3.6 | 0.2 ± 0.1 | 60.0 ± 4.7 |
| HFD | 64.1 ± 14.7 | 61.7 ± 32.5 | 147 ± 41.6 | 95.5 ± 22.0 | 0.3 ± 0.1 | 126 ± 23.2 |
| Met-HFD | 68.9 ± 13.1 | 23.5 ± 4.0 | 69.3 ± 13.6 | 97.6 ± 14.0 | 0.3 ± 0.1 | 128 ± 10.9 |
| GTPS-HFD | 48.0 ± 2.5 | 33.3 ± 12.0 | 146 ± 62.1 | 70.4 ± 18.5 | 0.3 ± 0.1 | 91.5 ± 21.5 |
| GTPS-ND | 68.3 ± 10.9 | 29.0 ± 3.0 | 85.0 ± 17.5 | 49.3 ± 3.6 | 0.2 ± 0.1 | 70.4 ± 3.4 |
| BTPS-ND | 73.9 ± 26.7 | 25.6 ± 5.4 | 104 ± 54.7 | 47.3 ± 18.2 | 0.3 ± 0.1 | 69.1 ± 23.4 |
| BTPS-HFD | 67.6 ± 17.2 | 32.8 ± 7.3 | 114 ± 45.7 | 52.6 ± 16.6 | 0.3 ± 0.1 | 77.3 ± 19.8 |
| Reference values | 63.1–103.9 | 16.4–53.2 | 35.7–135.7 | 40–50 | <1.8 | 72.9–113.7 |