| Journal of Food Bioactives, ISSN 2637-8752 print, 2637-8779 online |
| Journal website www.isnff-jfb.com |
Original Research
Volume 7, September 2019, pages 48-55
Intestinal permeability and transport of apigenin across Caco-2 cell monolayers
Marina Zulkiflia, *, Amin Ismailb, c, *, Loh Su Pengb, c, Fadhilah Jailanid, Nur Kartinee Kassime
aAlliance of Research and Innovation for Food (ARIF), Faculty of Applied Sciences, Universiti Teknologi MARA Negeri Sembilan, Kuala Pilah Campus, 72000 Kuala Pilah, Negeri Sembilan, Malaysia
bDepartment of Nutrition and Dietetics, Faculty of Medicine and Health Sciences, Universiti Putra Malaysia, 43400 Serdang, Selangor, Malaysia
cResearch Centre of Excellence, Nutrition and Non-communicable Diseases, Faculty of Medicine and Health Sciences, Universiti Putra Malaysia, 43400 Serdang, Selangor, Malaysia
dDepartment of Food Science and Technology, Faculty of Applied Sciences, Universiti Teknologi MARA Shah Alam, 40450 Shah Alam, Selangor, Malaysia
eDepartment of Chemistry, Faculty of Science, Universiti Putra Malaysia, 43400 Serdang, Selangor, Malaysia
*Corresponding author: Marina Zulkifli, Alliance of Research and Innovation for Food (ARIF), Faculty of Applied Sciences, Universiti Teknologi MARA Negeri Sembilan, Kuala Pilah Campus, 72000 Kuala Pilah, Negeri Sembilan, Malaysia. E-mail: marina547@uitm.edu.my. Amin Ismailand, Department of Nutrition and Dietetics, Faculty of Medicine and Health Sciences, Universiti Putra Malaysia, 43400 Serdang, Selangor, Malaysia. E-mail: aminis@upm.edu.my
DOI: 10.31665/JFB.2019.7198
Received: September 22, 2019
Revised received & accepted: September 29, 2019
| Abstract | ▴Top |
Investigation on bioavailability was carried out by determining the absorption and transport of bioaccessible apigenin from fruit of mango (Mangifera indica var. Water Lily) into Caco-2 human intestinal cell using a reliable and sensitive analytical method of LC-MS/MS. Results revealed that the concentration of glucuronidated apigenin was lower than apigenin. The apigenin was metabolised inside the cells through glucuronidation process, and cross the monolayer to reach the basolateral sides or effluxed back to the apical side. The permeability coefficient of apigenin from apical to basolateral sides and basolateral to apical sides showed a medium permeability of less than 20 ×10−6 cm·sec−1. Since the value of efflux ratio was 1.5, it suggested that apigenin was absorbed and transported through a simple diffusion mechanism.
Keywords: Bioavailability; Permeability coefficient; Apigenin; LC-MS/MS
| 1. Introduction | ▴Top |
Bioavailability is the fraction of a nutrient that is digested, absorbed, metabolized through the systemic circulation and reached the target sites in the body. The fraction must be available to achieve any effect in a specific tissue, in which it is able to be extracted from the food matrix and subsequently be absorbed from the gut through the intestinal cells by passive diffusion or by active transport (Soler et al., 2010; Stahl et al., 2005). The bioavailability of polyphenol varies for each compound and the highest concentration in the food is not necessarily high bioavailability (Manach et al., 2005). The polyphenol bioavailability is reported to be low due to the sulfation and glucuronidation of free hydroxyl groups in its structure (Tang et al., 2012). In spite of its low bioavailability, the polyphenol may be retain in the gastrointestinal lumen with greater amount in which they play an important function in preserving the oxidative damage and in preventing the stomach, colon and rectal cancer (Halliwell et al., 2000).
Human colorectal adenocarcinoma Caco-2 cells have been widely used in in vitro studies on transport of drug across the intestinal epithelial cells for more than 30 years. The Caco-2 cell line is a heterogeneous population due to different transport rates, brush border assembly, and other differentiation characteristics of the population (Gonzales et al., 2015). Currently, Caco-2 cells are commonly used in the development and discovery of drug. During the growth phase, the Caco-2 cells form semi-spheroid clusters, with the formation of tight junction between adjacent cells. When it reached confluence and differentiation, brush border microvilli will cover the apical membrane, leading to the morphological polarization of the monolayer. Caco-2 cells also participate in mechanism of apical efflux, which is responsible in restricting oral drug absorption.
There are various morphological and functional properties of small bowel enterocytes expressed by Caco-2 cell such as formation of tight junctions and microvilli, brush border enzymes, phase II conjugation enzymes as well as membrane transport proteins. Two main carrier superfamilies are associated in drug absorption are ATP-binding cassettes (ABC) and solute carriers (SLCs). The ABC proteins like P-glycoprotein (P-gp) and Multidrug Resistance Protein (MRP) are involved in the intestinal transport and absorption mechanism of several compounds (Crowe and Wright, 2012). Hence, the cell has been widely used to study the characteristics of polyphenols metabolism in the small intestine.
To date, there is a lack of knowledge concerning the transport of apigenin particularly from mango fruit through the human intestinal cell monolayers. Hence, this study focused on investigating the absorption and transport of bioaccessible fraction of apigenin from Water Lily mango obtained during simulation gastrointestinal in epithelial cell monolayers using Caco-2 cell culture model and paid particular attention to the production of conjugates within the cells and its efflux from the cells.
| 2. Material and methods | ▴Top |
2.1. Preparation of sample
The fruit pulp of mango (Mangifera indica var. Water Lily) was cut into small pieces then freeze-dried at −40 °C for 28 hr. Then, 3 g of freeze-dried sample were homogenized in 20 mL of 80% methanol using a homogenizer. The mixture was sonicated for 30 min at 30 °C in ultrasonic bath, followed by the centrifugation at 12,000 × g for 15 min at 5 °C, and filtered through a Whatman filter paper No. 1. The extract was concentrated to dryness in a rotary evaporator. Then 100 mg of extract were mixed with 10 mL of 0.9% saline. All solutions were prepared freshly and subjected to in vitro digestion immediately after preparation. The digested extract was stored at −20 °C in a tightly sealed container for transport experiment.
2.2. Maintenance of Caco-2 cell lines
The human colorectal adenocarcinoma cell line (Caco-2) cells were purchased from the American Type Culture Collection (Manassas, VA, USA). Frozen Caco-2 cells were defrosted and routinely cultured in 25 cm2 flasks before transferred to 75 cm2 flasks in Dulbecco’s Modified Eagle’s Medium (DMEM) consisting of 10% fetal bovine serum (FBS) and 1% penicillin/streptomycin. The cells were grown and differentiated in a humidified atmosphere of 5% CO2 and 95% air at 37 °C (Esco, Singapore). Media were changed three times per week by discarding the culture medium and rinsed with phosphate buffer solution (PBS). The cells were subcultured when it reached 80% confluency by treatment with a solution containing 1.5 ml trypsin/ethylenediamine tetraacetic acid (0.05%, 1 mL) for 7 min. When the cells detached, the reaction was stopped by adding 3 mL of complete supplemented media. About 2 mL of cells were transferred into 75 cm2 flask for at least three passages before being cultured in a 6 well Transwell® plate for transport experiment. The remaining cell suspensions were centrifuged (Tuttlingen, Germany) at 210 × g for 5 min at 4 °C for cell preservation.
2.3. Culturing Caco-2 cell monolayer
Caco-2 cells were seeded at 6 × 10⁴ cells/cm2 and subsequently cultured on a 6 well Transwell® plate (polycarbonate membrane, pore size of 0.4 µm, membrane diameter of 24.5 mm, surface area of 4.7 cm2) then incubated in humidified atmosphere (37 °C, 5% CO2, 95% air). Cells were allowed to grow and differentiate to confluent monolayers for 21–27 days post seeding. Trypan blue and haemocytometer were used during cell seeding for determination of total cell counts and viable cell number. The medium was changed three times per week. The passage number used for the experiment was between 35–45.
2.4. Evaluation of compound stability in cell culture transport media
The stability of apigenin was evaluated based on modified method by Fadhilah and Williamson (2014). About 1 mL of digested sample was mixed with 1 mL of Hank’s Balance Salt Solution (HBSS). The pH was adjusted to 7.4 with 1M sodium hydroxide or 1M hydrochloric acid. Next, the solution was kept in an incubator of 5% CO2 and 95% air at 37 °C. The sample was collected at 0 min and after 30, 60, 90, 120 and 180 min incubation. Then, 100 µL of sample were mixed with 100 µL ethanol containing genistein as an internal standard. The sample was vortexed, mixed and centrifuged at 17,000 × g for 10 min before being analysed using a high performance liquid chromatography-diode array detector (HPLC-DAD).
2.5. Evaluation of monolayer integrity
The monolayer integrity in transwells was determined by phenol red method as described by Soler et al. (2010) with slight modifications. The culture medium from apical and basolateral compartments were removed and washed three times with phosphate buffer solution (PBS). About 0.6 mL of DMEM containing phenol red was filled to the apical compartment whereas 1.5 mL of PBS was loaded to the basolateral compartment. Then cells were placed in the incubator at 37 °C (5% CO2 and 95% O2) and diffusion of phenol red across the monolayer from apical to basolateral was allowed for 1 h. Aliquots of 100 μL were removed from both compartments and absorbance were measured at 570 nm. Well that supported less than 1% of phenol red transport was considered acceptable for transport experiment. The integrity of monolayer was performed before and after the cell treatment. The percentage of phenol red diffusion was calculated as follows:
2.6. Determination of transepithelial transport across Caco-2 cell monolayer
Transport experiment was performed according to the method of Fadhilah and Williamson (2014) with some modifications. The transport buffer solution containing Hank’s Balance Salt Solution (HBSS) supplemented with 1.8 mM calcium chloride (to preserve the integrity of the tight junction) and 100 µM ascorbic acid (to reduce the degradation of apigenin) was prepared freshly. Medium was aspirated and rinsed three times with transport buffer (modified HBSS, pH 7.4). Both apical and basolateral compartments were filled with 2 mL of modified HBSS and incubated (37 °C, 5% CO2/95% O2) in order to equilibrate the pH of cell monolayers to pH 7.4. After 30 min, the HBSS was aspirated to waste. The digested sample solution (1 mL) containing apigenin in modified HBSS (40 µM) was added to the apical compartment whereas the basolateral compartment was filled with 2 mL of modified HBSS and equivalent amount of DMSO. For blank transport control, only modified HBSS was loaded to both apical and basolateral compartments. After 2 h incubation in humidified atmosphere, sample from two compartments were collected, deproteinated and immediately frozen at −80 °C prior to analysis. The monolayer integrity was performed before and after the experiment by phenol red method. The same protocol was repeated from basolateral to apical compartment for efflux study.
2.7. Sample preparation
Samples from transport study were defrosted at room temperature and 300 µl solutions were mixed with 300 µl ethanol consisting of genistein (2 µM) as an internal standard. The mixture was then vortexed and centrifuged at 17,000 × g for 10 min. The supernatant was transferred to an Eppendorf tube and evaporated to dryness under nitrogen gas. Next, dried samples were reconstituted in 600 µL of 50% ethanol in water (50:50, v/v) containing ferulic acid (internal standard, 2 µM), vortexed and subsequently centrifuged for 10 min at 17,000 × g. Samples were analysed using a HPLC-DAD and confirmed by electrospray ionization-quadrupole time of flight-tandem mass spectrometry (ESI-QTOF-MS)
2.8. Quantification by HPLC-DAD
HPLC separation and quantification of apigenin aglycone and its metabolite produced by Caco-2 permeates were carried out using an Agilent series 1100 system (Agilent, Germany) equipped with diode array detector (DAD). The analytical column used was 250 × 4.0 mm i.d, 5 µm Lichrosper C18, kept at 25 °C. The mobile phase applied was 0.5% (v/v) acetic acid in water (eluent A) and 100% methanol (eluent B) with a total run time of 30 min at a flow rate of 0.6 ml/min. Gradient elution was conducted as follows; 0–90% B (0–20 min); 90% B (20–25 min); 90–0% B (25–30 min). Identification of compounds was done by comparing the spectra and retention time of pure standards. The concentration of apigenin aglycone and metabolite were calculated for both apical and basolateral compartments by constructing the standard curve ranging from 20–100 µg/mL.
2.9. Confirmation by LCMS-QTOF-MS
Mass spectrometry analysis of apigenin aglycone and its metabolite after incubation of bioaccessible fraction were conducted by LC-QTOF-MS (Agilent Technologies Inc., Palo Alto, CA) equipped with electrospray ionization source. Ionisation was achieved using an electrospray (ESI) interface operating in the negative mode [M-H]−. Spectral data in the range of m/z 50 to 1,100 were applied with negative ionization mode. High purity nitrogen was used as the dry gas at a flow rate of 10 L/min, and at a pressure of 30 psi. Gas and vapourizer temperature were set at 325 °C, and the scan source parameters were capillary voltage and fragmentor with 4 kV and 175, respectively. Data were acquired in MS and MS/MS scanning modes. The intestinal apparent permeability coefficient (Papp) was calculated for bidirectional transport experiments using the following equation:
2.10. Statistical analysis
Data were average of three independent experiments. Statistical analysis was conducted using a Analysis of Variance (ANOVA) by SPSS statistical package for Windows (21.0; SPSS Inc., Chicago, IL, USA). The level of significance was set at p < 0.05.
| 3. Results and discussion | ▴Top |
3.1. Stability of apigenin
The stability of apigenin in transport buffer solution was performed to ensure that the compound withstand the experimental conditions throughout the transport study. Figure 1 indicates the changes in concentration of apigenin at time intervals up to 180 min incubation at 37 °C in HBSS transport buffer solution (pH 7.4). At 0 min, there was 98.82% of apigenin initial concentration and left about 88.68% concentration after 180 min incubation. The apigenin observed to be stable in HBSS buffer solution as only slight changes noticed.
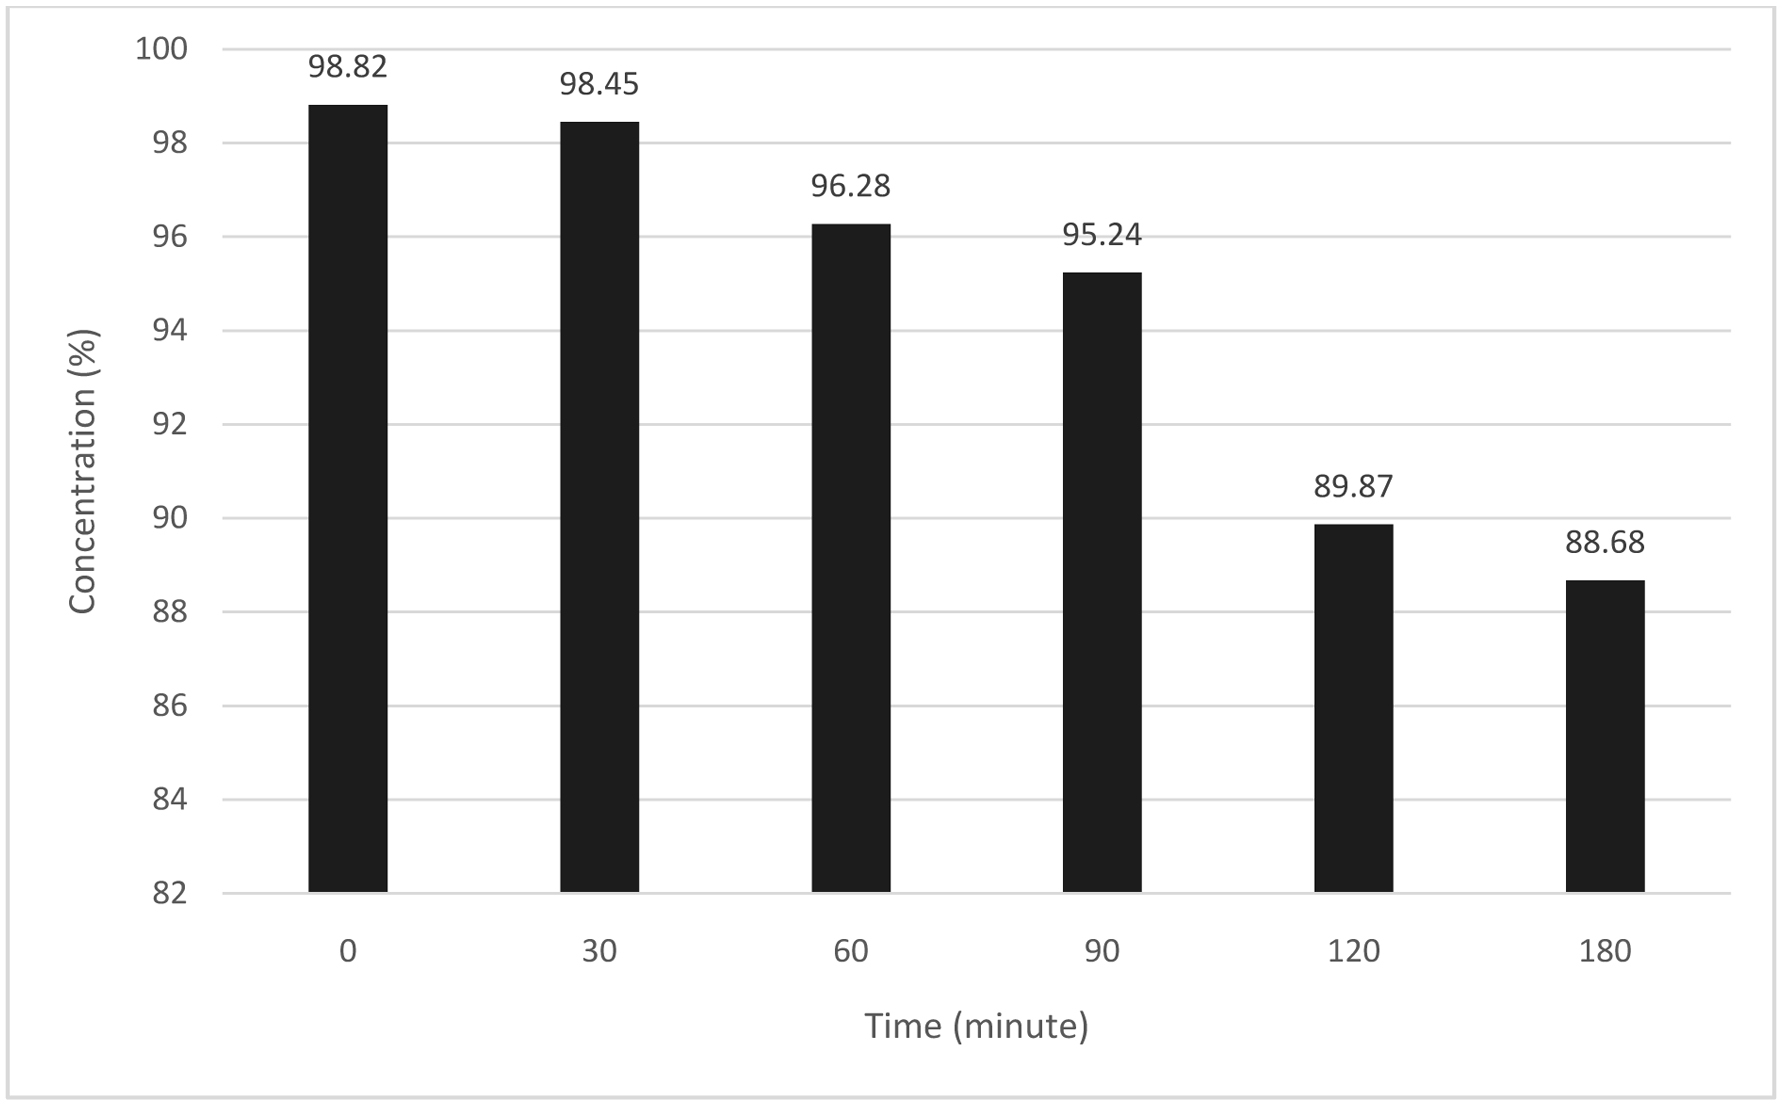 Click for large image | Figure 1. Stability of apigenin in transport buffer solution at pH 7.4 incubated over 180 min at 37 °C. Stock solution of apigenin was diluted to a final concentration of DMSO (0.4%) in transport buffer solution containing HBSS supplemented with 1.8 mM CaCl2 and 100 µM ascorbic acid. |
Even though no data on the stability of apigenin reported, but these results are in accordance with other studies by Kosinka et al. (2012) indicating that the catechin, epicatechin and procyanidin in cocoa extract were stabled during incubation at 37 °C for 120 min. Stability of pelargonidin extracted from strawberry was also constant in HBSS buffer at pH 7.4 for 120 min.
HBSS is widely used as a buffer for transport study in cell culture models (Hubatsch et al., 2007). The buffer was supplemented with 1.8 mM CaCl2 with the purpose to maintain the integrity of the tight junction and addition of 100 µM ascorbic acid to prevent the compound degradation. A study by Halliwell (2003) showed that most polyphenol compounds were readily oxidized in aqueous media with pH higher than 7, resulted in the formation of polyphenolic oxidation products and H2O2. The information on compound stability in transport buffer solution is necessary to ensure the amount present in apical and basolateral compartments during transport experiments.
3.2. Monolayer integrity
Due to the absence of transepithelial electrical resistance (TEER) with epithelial voltohmeter instrument, the integrity of Caco-2 cell monolayer was measured using the phenol red permeability method. The stability of Caco-2 cells monolayer integrity in the presence of solution treatments were determined by changes in percent diffusion values as illustrated in Figure 2. There is a clear trend of decreasing percentage diffusion of phenol red from upper to lower compartments both for the control (without cell) and Caco-2 cells. The values decreased gradually for Caco-2 cells until reached the confluency at day 21. After the transport experiment, the monolayer integrity of Caco-2 cell was 1.2% but still considered as acceptable value. Statistically, there was no significant difference in percentage of phenol red diffusion after cell treatment, probably that the integrity of cell monolayer maintained and no disruption of the monolayer or cell lysis observed.
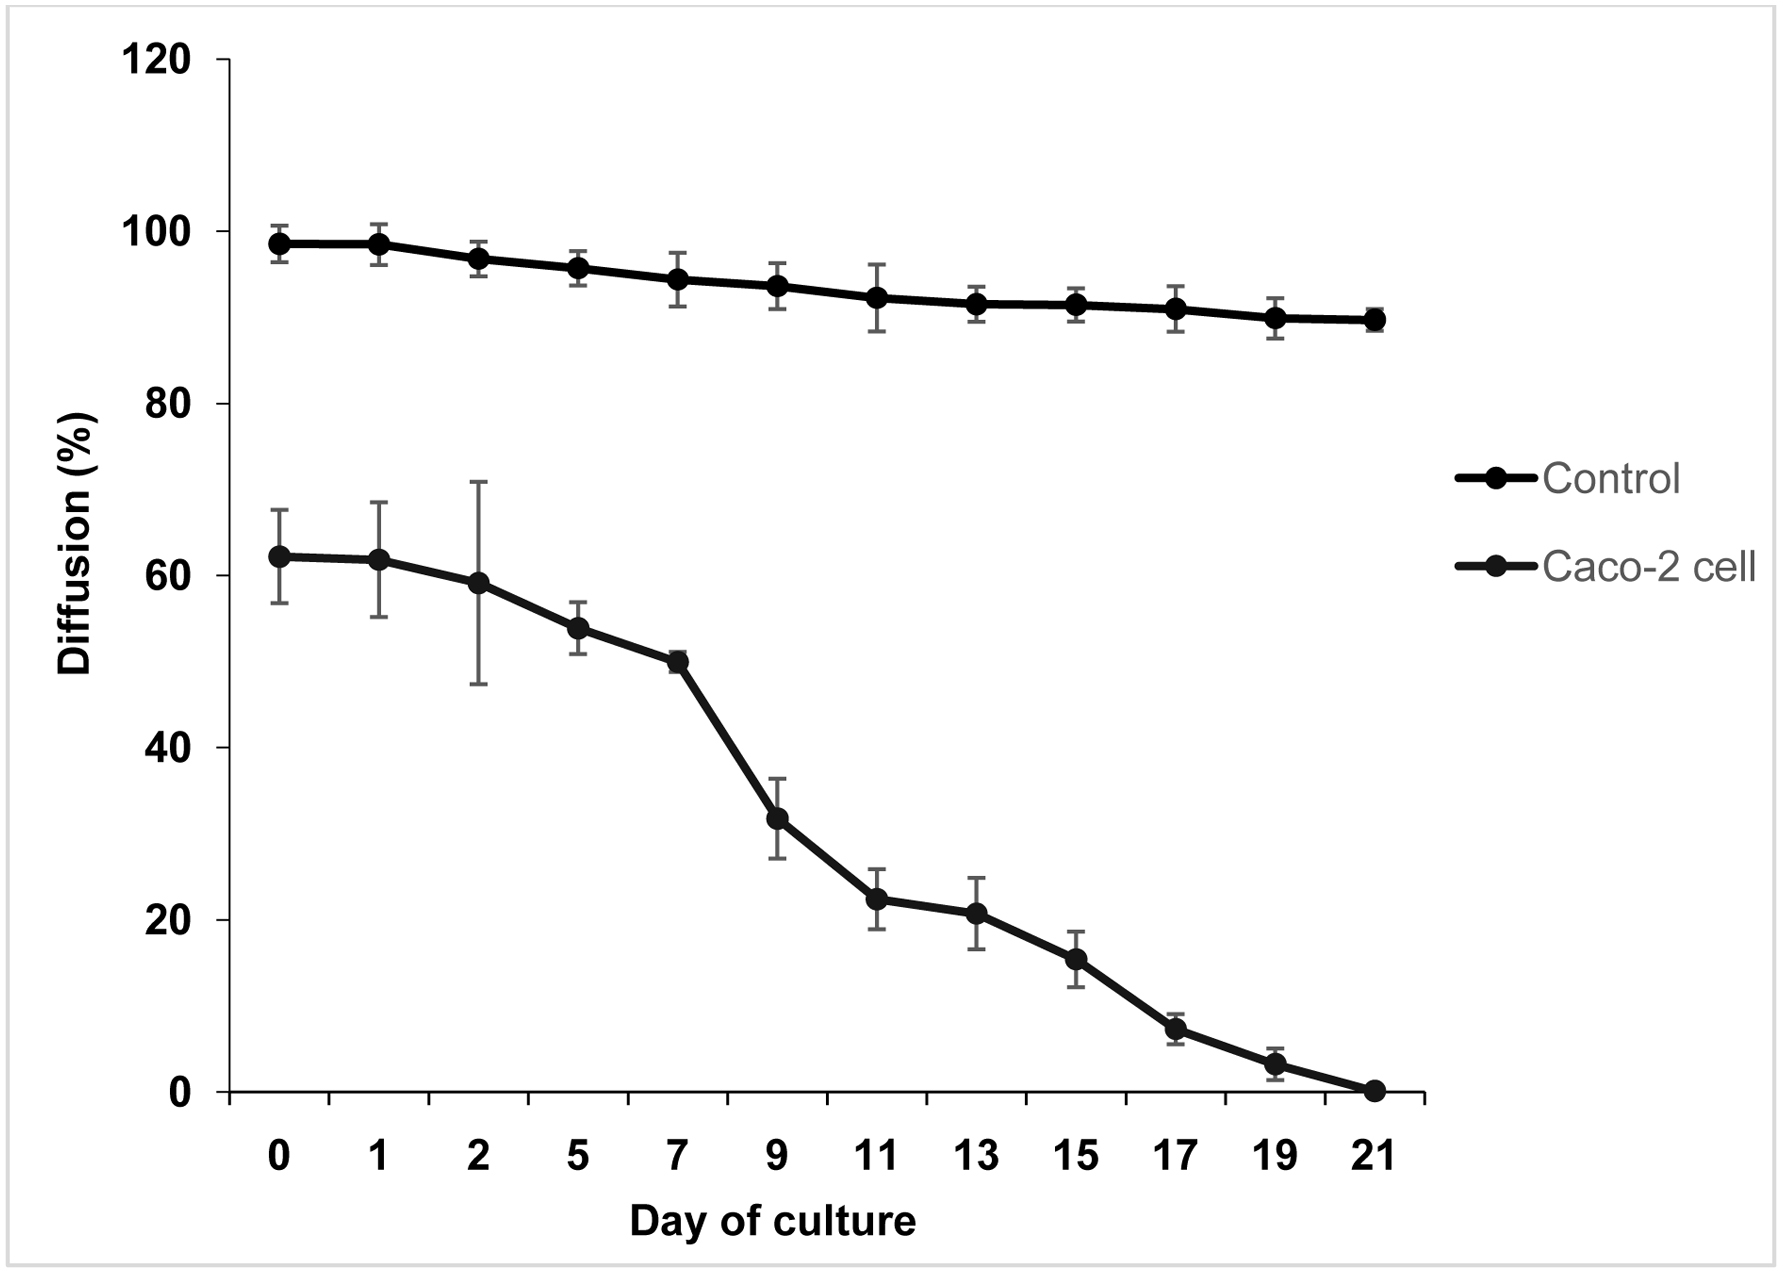 Click for large image | Figure 2. Passage of phenol red across Caco-2 cell monolayers after 1 h incubation. DMEM containing phenol red was applied to the apical compartment whereas PBS was loaded to the basolateral compartment, then incubated for 1 h at 37 °C. |
It was suggested that cells formed confluent monolayer at day 21 as the percentage diffusion of phenol red was 0.1%. According to Fale et al. (2010), well with the value less than 1% of phenol red transport under this condition was considered suitable for use in the transport study. The Caco-2 cell monolayers were believed to form a brush border microvilli that resembles the luminal membrane of the intestinal epithelium. The structural and functional differentiation of the brush border microvilli is associated with polarization of the epithelial monolayers with the presence of tight junctions. The present study exhibited that Caco-2 cultured on Transwell insert can differentiate spontaneously as well as express numerous morphological and functional properties of characteristics of mature enterocytes. The main advantage of this cellular line was associated with its stability when grown as monolayers on Transwell inserts that resemble the parental Caco-2 parent cell line (Soler et al., 2010).
3.3. Identification of apigenin and its metabolite
Identification of apigenin and its metabolite in the basolateral compartment after incubation for 2 h in humidified atmosphere is tabulated in Table 1. The compounds produced by the intestinal cells were identified and detected by comparing the ESI-MS spectra in full scan mode and its retention time with those the standards. Results of LC-MS/MS analysis revealed that apigenin was identified on the basis that the peak of parent ion (M+) at m/z 269.0498 and fragment ions were at m/z 176.9943, 112.9858, and 68.9968 at 17.29 min. The ESI-MS spectrum of the bioaccessible apigenin eluted at 14.86 min produced a parent ion (M+) at m/z 445.0767, with formation of four fragment ions at m/z 269.0453, 217.0033, 141.0168 and 113.0241. Therefore, it was confirmed the identification of metabolite as apigenin glucuronide.
 Click to view | Table 1. LC-MS/MS of apigenin and its metabolite formed after incubation using Caco-2 cells monolayer as a model of the human intestinal epithelium |
Meanwhile, Figure 3 demonstrates the ESI-MS/MS spectra of apigenin (a) and apigenin glucuronide (b) detected in the basolateral compartment while the Figure 4 shows the ESI-MS/MS spectra of apigenin (a) and apigenin glucuronide (b) detected in the apical compartment after incubation of bioaccessible apigenin prepared in modified HBSS. Both figures show similar fragmentation patterns of ions for apigenin and its metabolite but only differ on the bidirectional transport from apical to basolateral (a→b) direction and from basolateral to apical (b→a) direction.
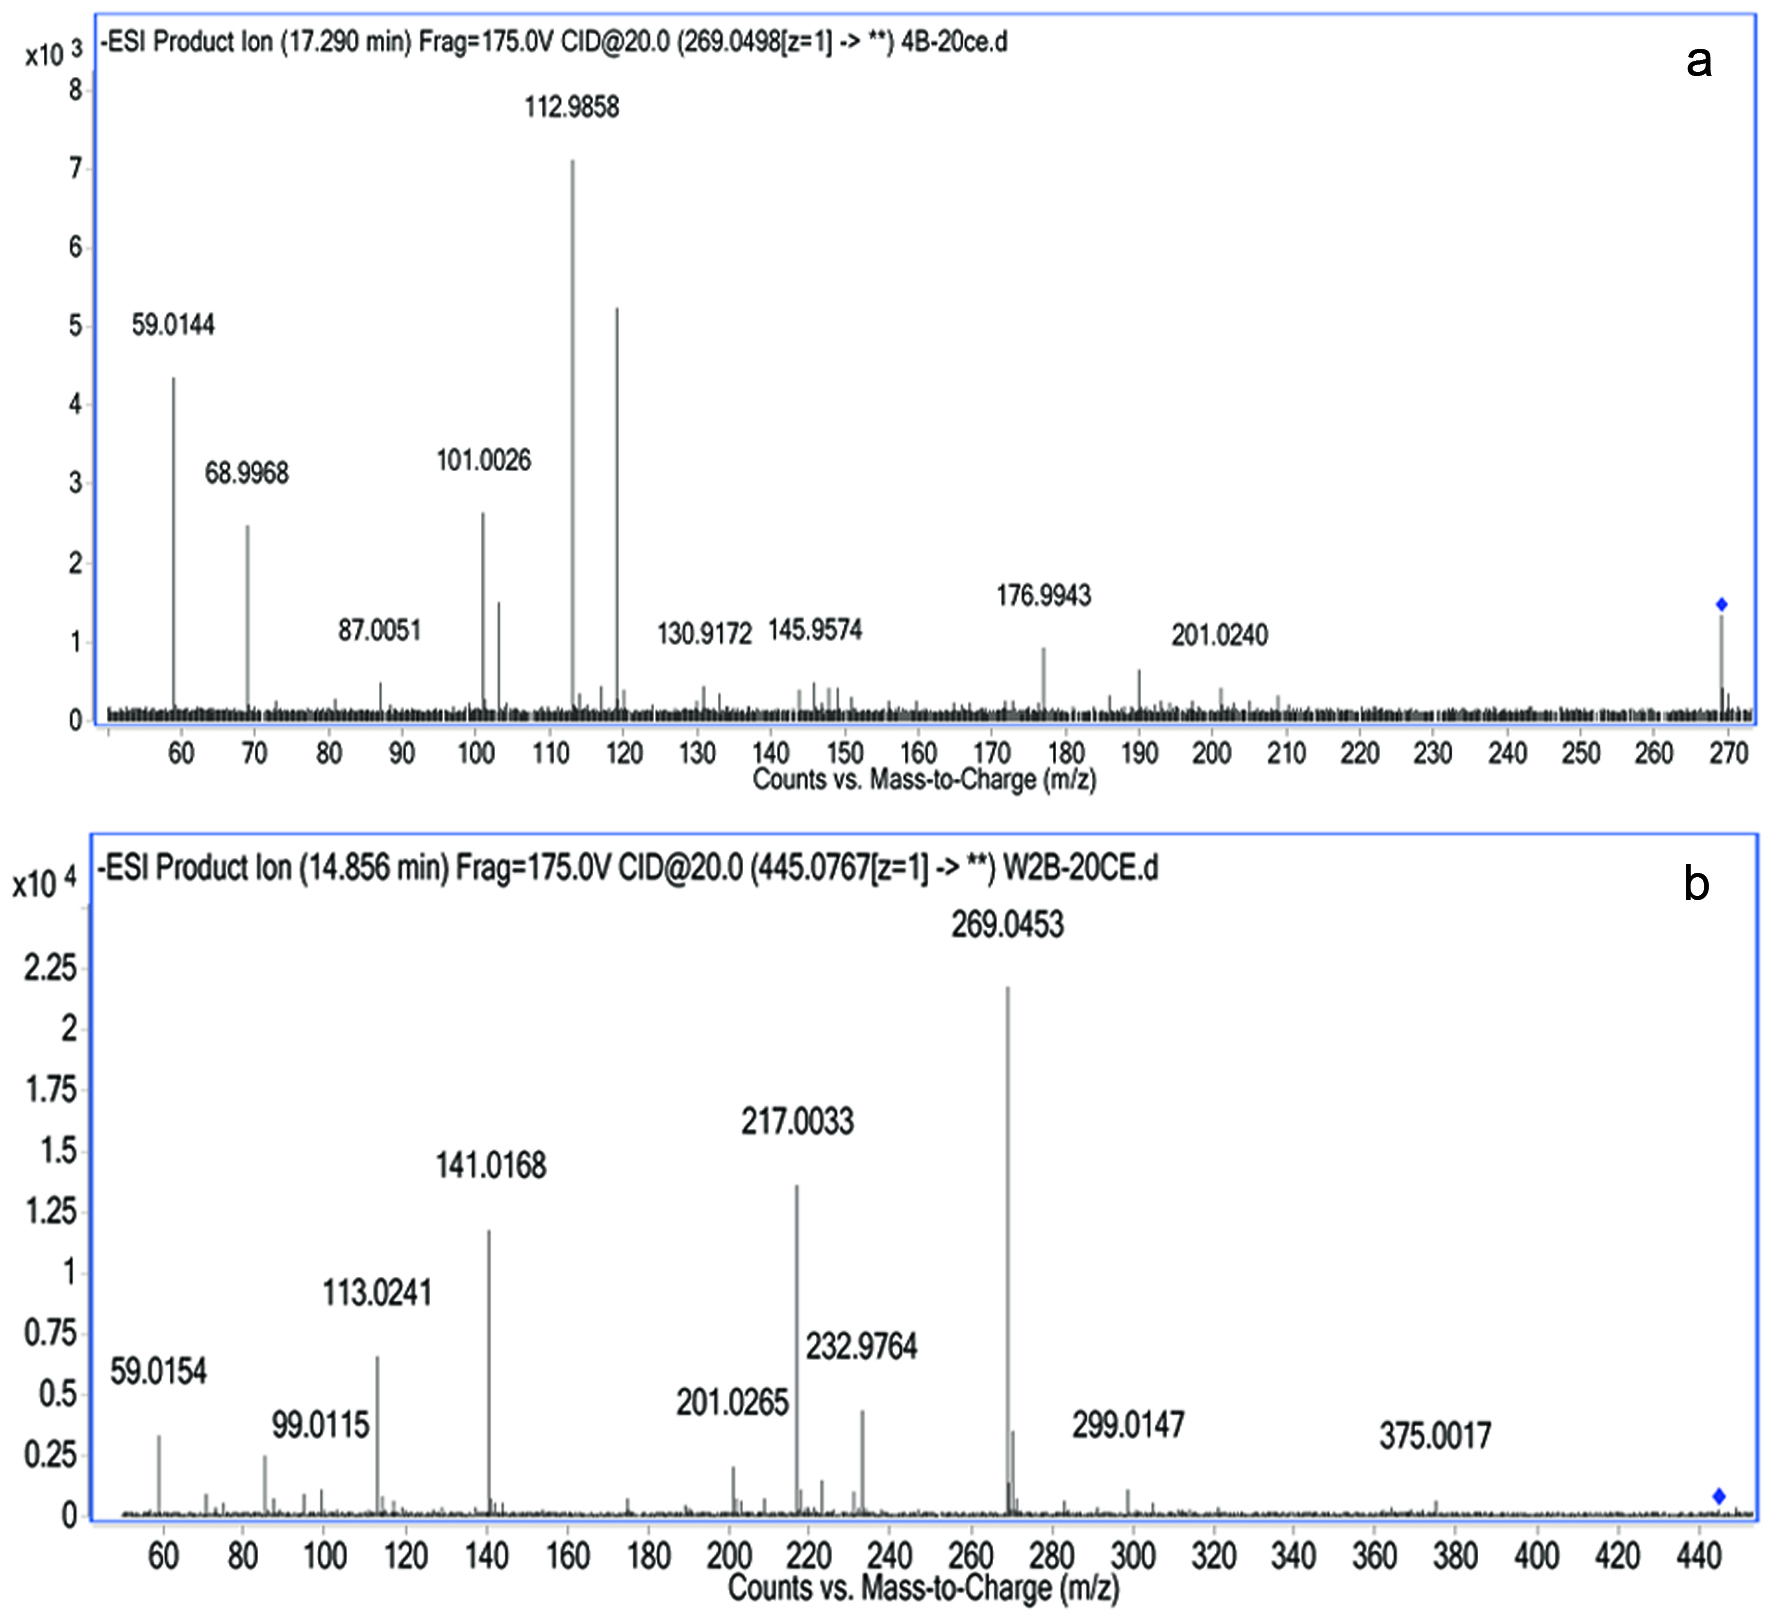 Click for large image | Figure 3. LC-ESI-MS/MS spectra of apigenin (a) and generated metabolite (b) detected in the basolateral compartment after incubation of bioaccessible apigenin prepared in modified HBSS on the apical compartment. |
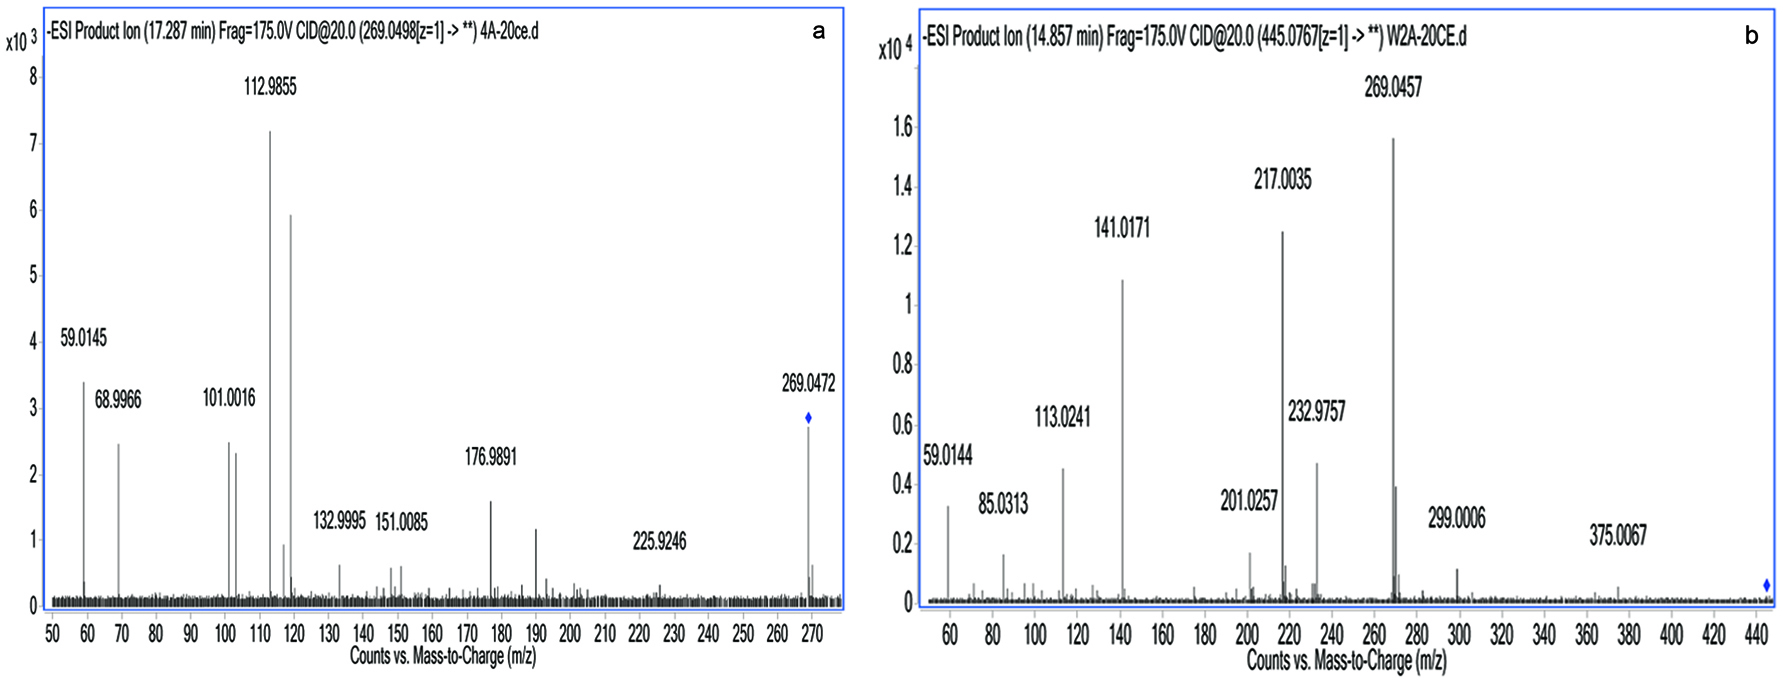 Click for large image | Figure 4. LC-ESI-MS/MS spectra of apigenin (a) and generated metabolite (b) detected in the apical compartment after incubation of bioaccessible apigenin prepared in modified HBSS on the basolateral compartment. |
Using the Caco-2 cell monolayer, the bidirectional transport and metabolism of apigenin and glucuronidated metabolite in bioaccessible fraction were investigated from a to b direction and from b to a direction. Table 2 demonstrates the concentration of apigenin and glucuronidated apigenin produced in the apical and basolateral compartments after 2 h incubation. The concentration of apigenin aglycone absorbed into the basolateral compartment from a to b direction was lower than the concentration effluxed to the apical compartment from b to a direction with the values of 27.99 pmol/cm2·min and 37.29 pmol/cm2·min, respectively. Meanwhile, the glucuronidated apigenin showed preferential apical efflux (6.55 pmol/cm2·min) compared to the basolateral absorption (5.71 pmol/cm2·min).
Click to view | Table 2. Metabolism of apigenin by Caco-2 cells |
Previous study reported that during transport through the Caco-2 cell monolayer, apigenin was metabolized into a number of Phase II conjugates, most notably glucuronides and sulphates (Gradolatto et al., 2008). The main reason for its poor bioavailability could be due to the extensive first-pass metabolism (Tang et al., 2012). In the current study, it demonstrated that the major form of compound transported across the cells was aglycone. Glucuronidation of apigenin also occurred at the highest concentration in apical efflux metabolized by UDP-glucuronosyltransferase (UGT). The enzyme that contributes to glucuronidation of flavonoids in humans is also present in Caco-2 cells (Galijatovic et al., 2001). Contrary to expectations, no sulfated apigenin detected in media solutions, and possible explanation for this could be related to the structure of apigenin with only one substituted hydroxyl group on the b ring, which is less susceptible to sulphation. Lower conjugation activity of the Caco-2 strain used in the study might also be a possible reason for the present result as reported by Fadhilah and Williamson (2014).
Since Caco-2 cell is an in vitro model for the intestinal absorption, it is important to know the directional movement of parent compound in Caco-2 cells from apical to basolateral and from basolateral to apical directions. The intestinal apparent permeability coefficient (Papp) of apigenin aglycone was calculated to facilitate the estimation of absorption and transport through the Caco-2 cell monolayer. As shown in Figure 5, the apigenin aglycone demonstrates higher permeability value (Papp) in b to a direction (17.89 × 10⁻⁶ cm·sec−1) than its permeability in opposite direction (12.44 × 10⁻⁶ cm·sec−1), suggesting that the permeability value is dependent on direction. This observation supports the idea that the secretion rate of apigenin transport (Papp from b to a) direction was greater than the absorptive rate of transport (Papp from b to a) direction, and considered as moderate permeability based on the Papp values. Nevertheless, there were no changes in permeability value of apigenin glucuronide in both directions, which is also suggested as moderate permeability since the Papp value were less than 20 × 10−6 cm·sec−1 (Breemen and Li, 2005).
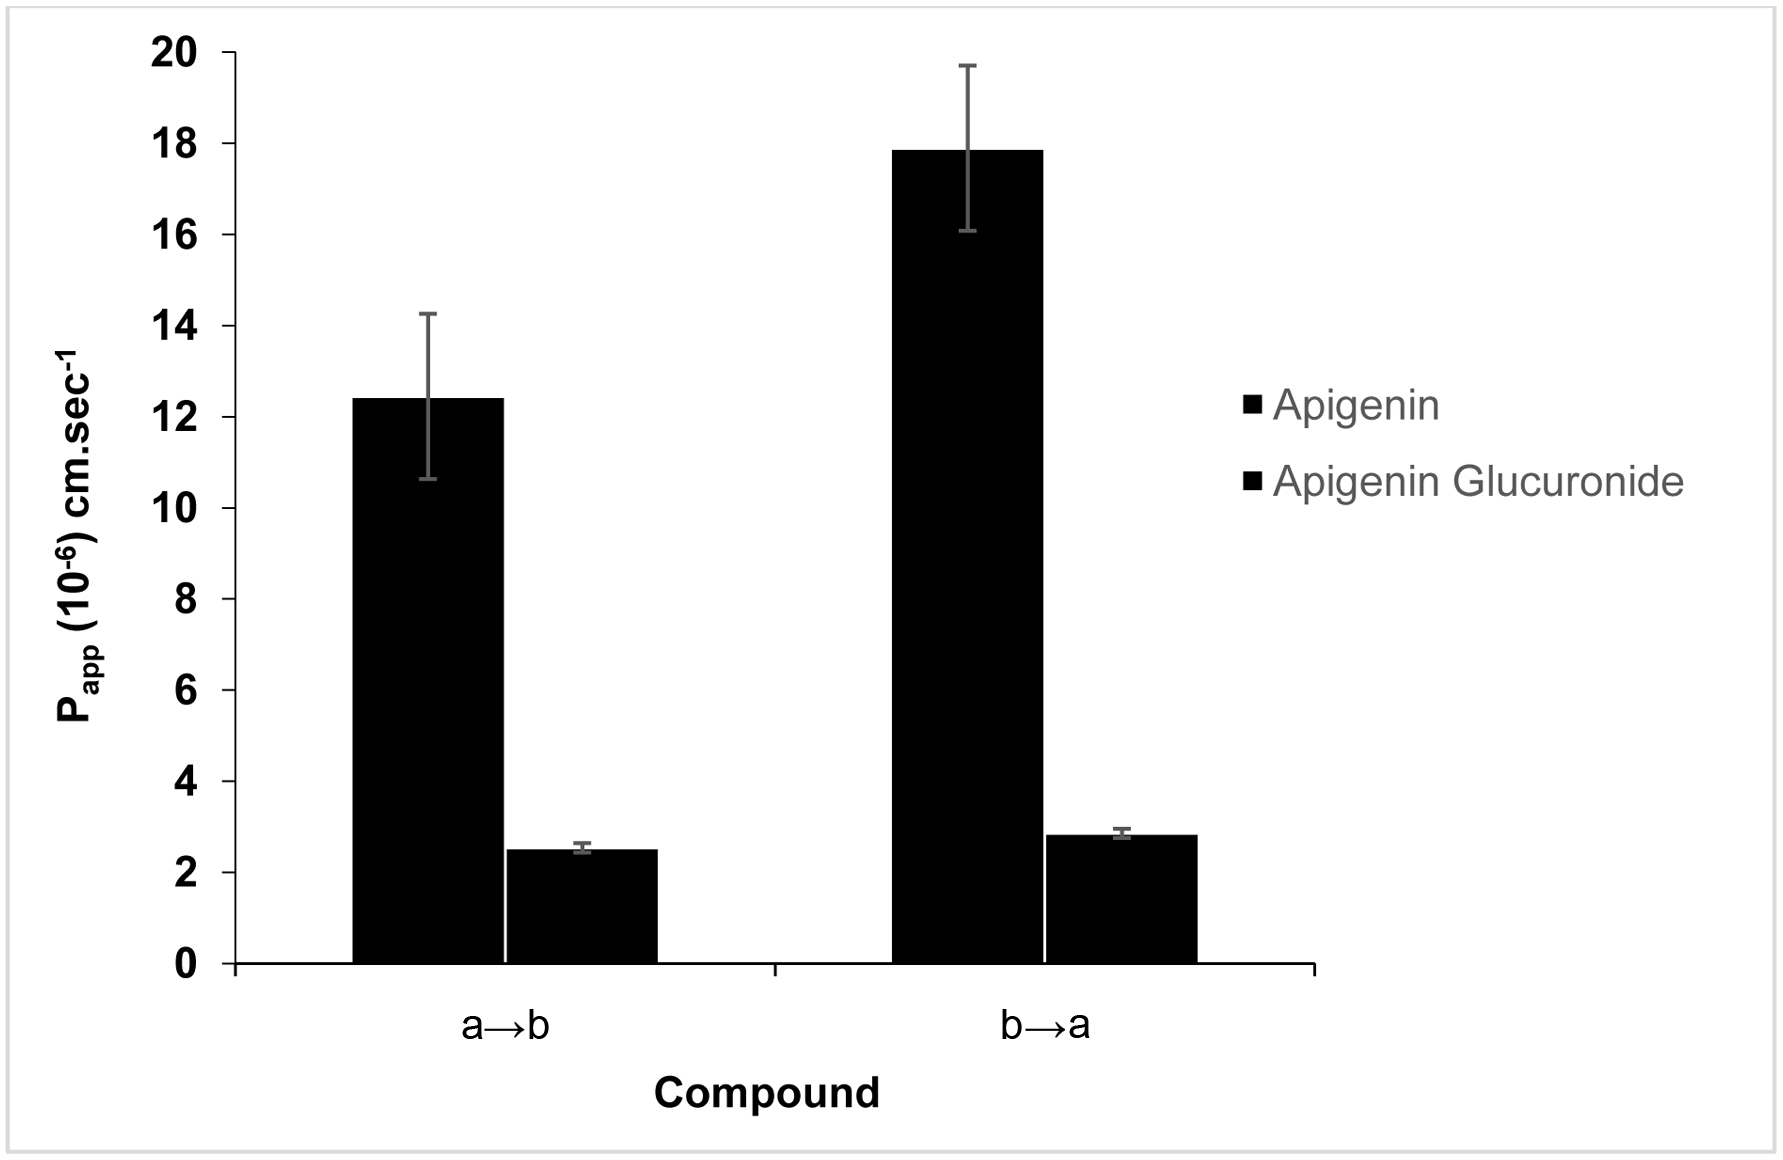 Click for large image | Figure 5. Transport of apigenin and its metabolite across Caco-2 cell monolayers from apical to basolateral (a→b) and basolateral to apical (b→a) directions. |
Indication of transport mechanism can be determined based on the efflux ratio of apparent permeability values (Pappba/Pappab). In general, efflux ratio more than 2 is an indicative of active efflux in which the compound is actively pumped back into the intestinal lumen, resulting in reducing its intestinal absorption. The values lower than 0.5 indicated an active influx, while a value equal to 1 was a predictive of passive diffusion (Hubatsch et al., 2007). It is noticeable that the efflux ratio of apigenin aglycone was 1.5, suggesting a passive diffusion transport mechanism. The results were consistent with previous study by Tang et al. (2017), where the efflux ratio of apigenin was reported as 1, which also indicated the same transport mechanism.
In line with previous observation, it was observed that glucuronidation of apigenin occurred inside the Caco-2 cells, and transported back to the culture medium. According to Hu et al. (2003), when the apigenin permeates the Caco-2 cell monolayer, the glucuronidated apigenin was biotransformed in the cells and subsequently expelled back to apical side mainly by P-glycoprotein (P-gp) and multidrug resistance-related proteins (MRPs). Thus, the intracellular concentration of apigenin has reduced, resulting in decreasing its bioavailability. These carrier proteins were abundant in apical membranes of pharmacologically important epithelial barriers such as the intestinal epithelium (Ueda et al., 1999). In Caco-2 cells, P-gp has shown to be highly expressed, make it suitable as cellular model for studying the intestinal permeability of flavonoids.
| 4. Conclusion | ▴Top |
Data obtained could support the use of in vitro Caco-2 cell model as a standard tool for prediction of in vivo studies in determining the intestinal absorption of apigenin. The present study has shown that apigenin from Water Lily mango pulp was taken up and metabolized into glucuronide conjugate possibly by a phase II metabolic glucuronyltransferase when incubated in Caco-2 cell monolayer. However, no sulfate conjugate present, which is in contrast to the expectation from the in vivo study. It was noticeable that the apigenin glucuronide was preferentially effluxed to the apical compartment possibly by the action of P-glycoprotein and multidrug resistance proteins. Apigenin transport demonstrated a medium permeability for both directions from apical to basolateral and basolateral to apical directions based on the apparent permeability values, which was less than 20 × 10−6 cm·sec−1. Results on efflux ratio indicated that both compounds were transported through the simple diffusion mechanism as the value of efflux ratio for apigenin and apigenin glucuronide reported as 1.5 and 1, respectively.
| Availability of data and material | ▴Top |
All data are presented in the main paper.
Acknowledgments
The authors would like to thank the Ministry of Higher Education, Universiti Teknologi MARA and Universiti Putra Malaysia for the technical support throughout the study. We also thank to Mr. Mohd Izwan Mohamad Yusof from iPROMISE UiTM for providing service, advice and shared knowledge on LCMS-QTOF-MS. Our appreciation goes to all the highly dedicated, helpful, knowledgeable and very responsible technical staffs of Nutrition and Dietetics Department, Faculty of Medicine and Health Sciences, UPM especially to Mr. Syed Hasbullah, Mr. Eddie, Mrs. Maznah Ahmad and Mrs. Suryani.
The authors would like to thank the Universiti Putra Malaysia, Serdang, Selangor, Malaysia for the financial support under the Putra Grant-IPS (Project No: GP-IPS/2017/9527300).
Conflict of interest
The authors declare no competing interests.
| References | ▴Top |