Figures
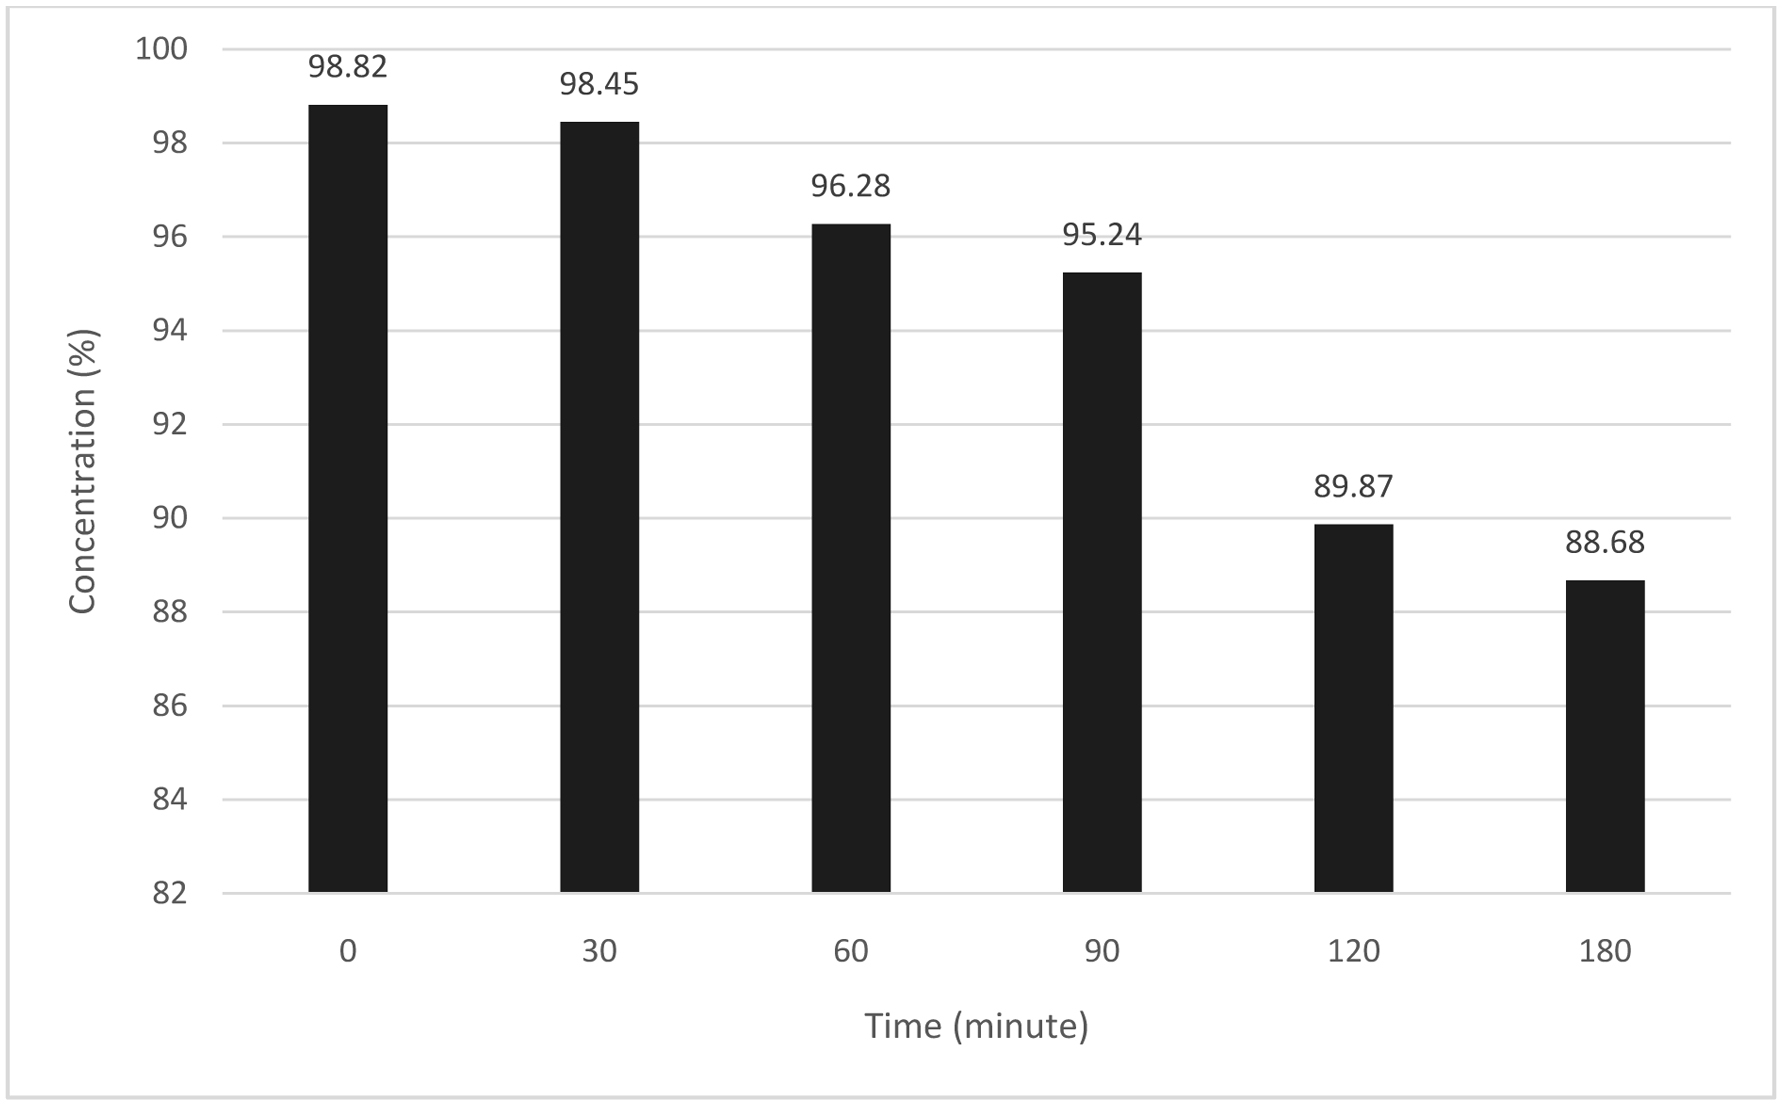
Figure 1. Stability of apigenin in transport buffer solution at pH 7.4 incubated over 180 min at 37 °C. Stock solution of apigenin was diluted to a final concentration of DMSO (0.4%) in transport buffer solution containing HBSS supplemented with 1.8 mM CaCl2 and 100 µM ascorbic acid.
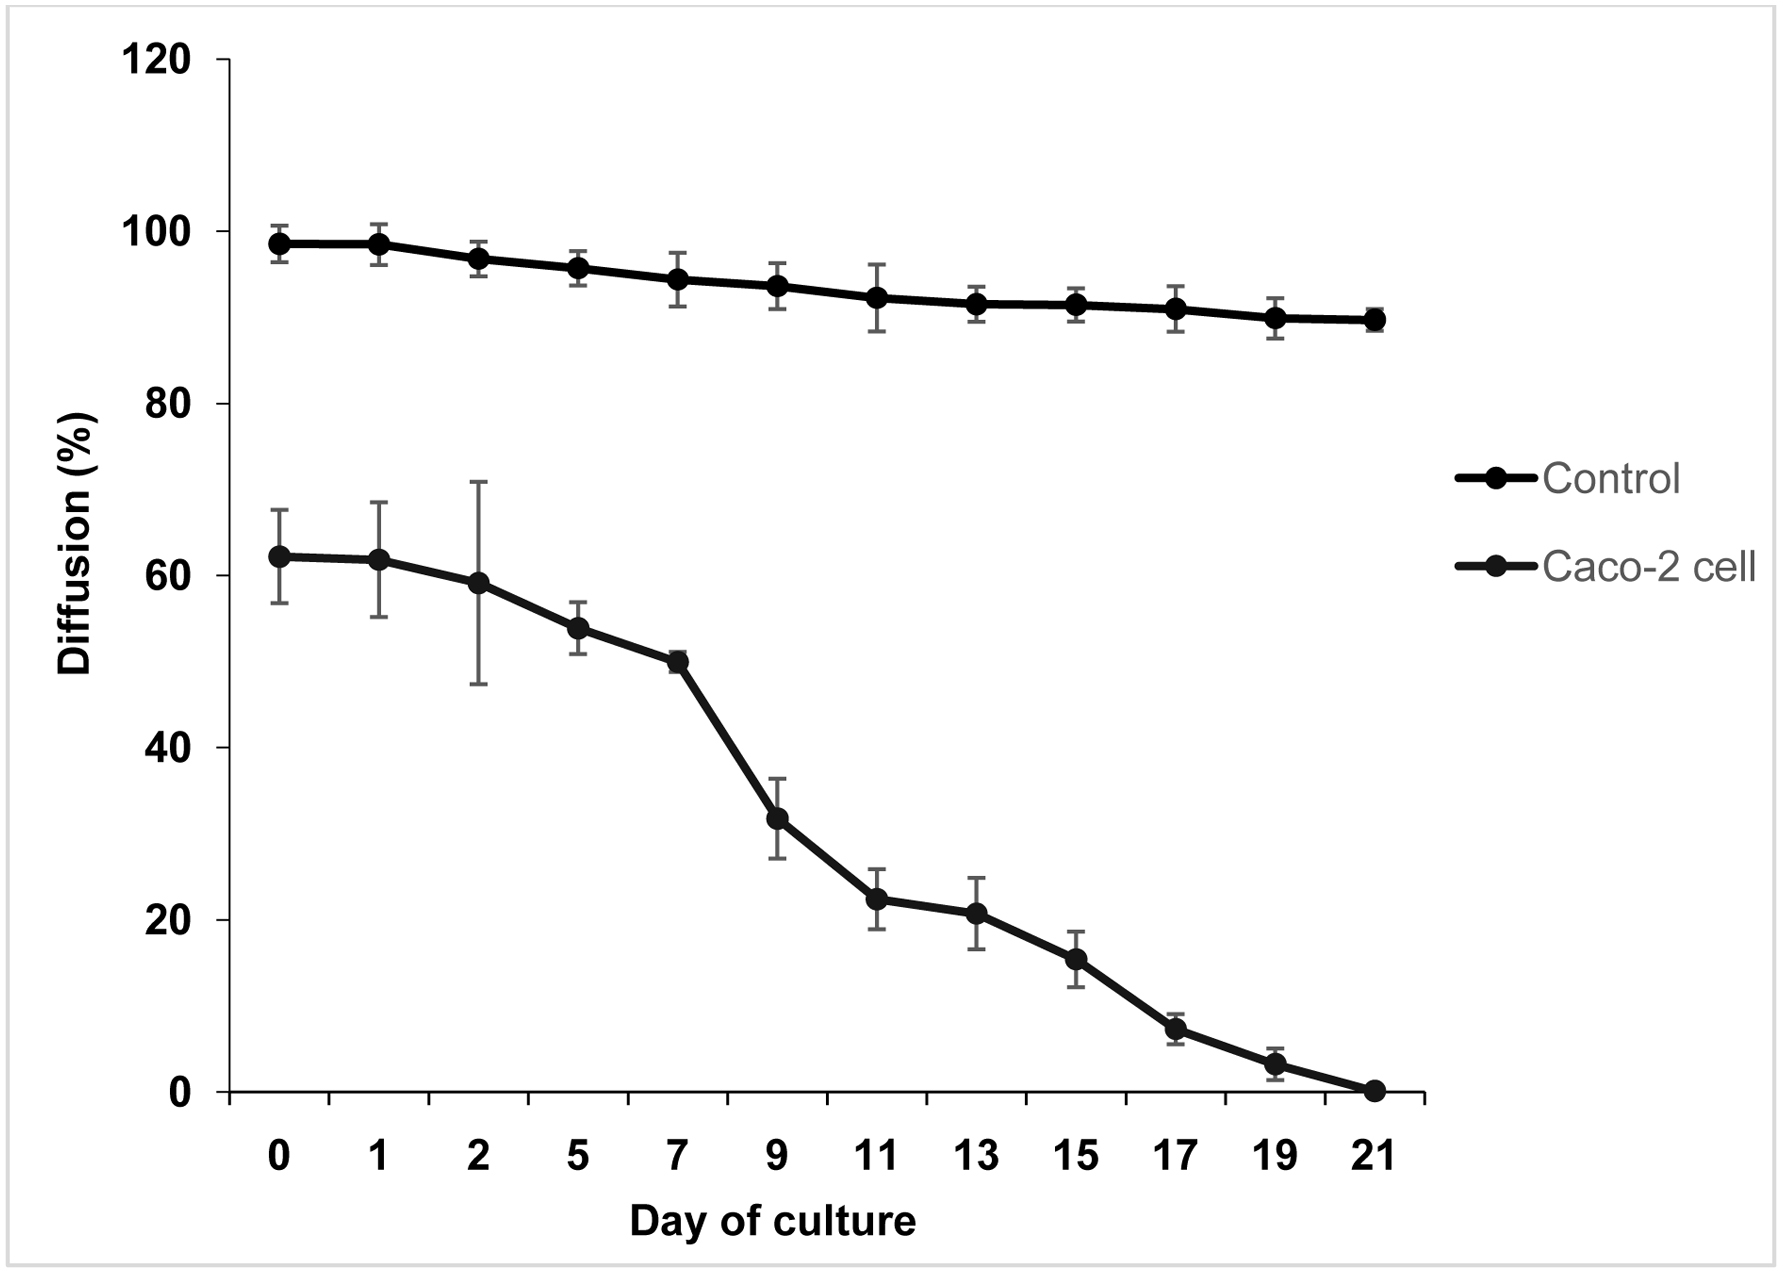
Figure 2. Passage of phenol red across Caco-2 cell monolayers after 1 h incubation. DMEM containing phenol red was applied to the apical compartment whereas PBS was loaded to the basolateral compartment, then incubated for 1 h at 37 °C.
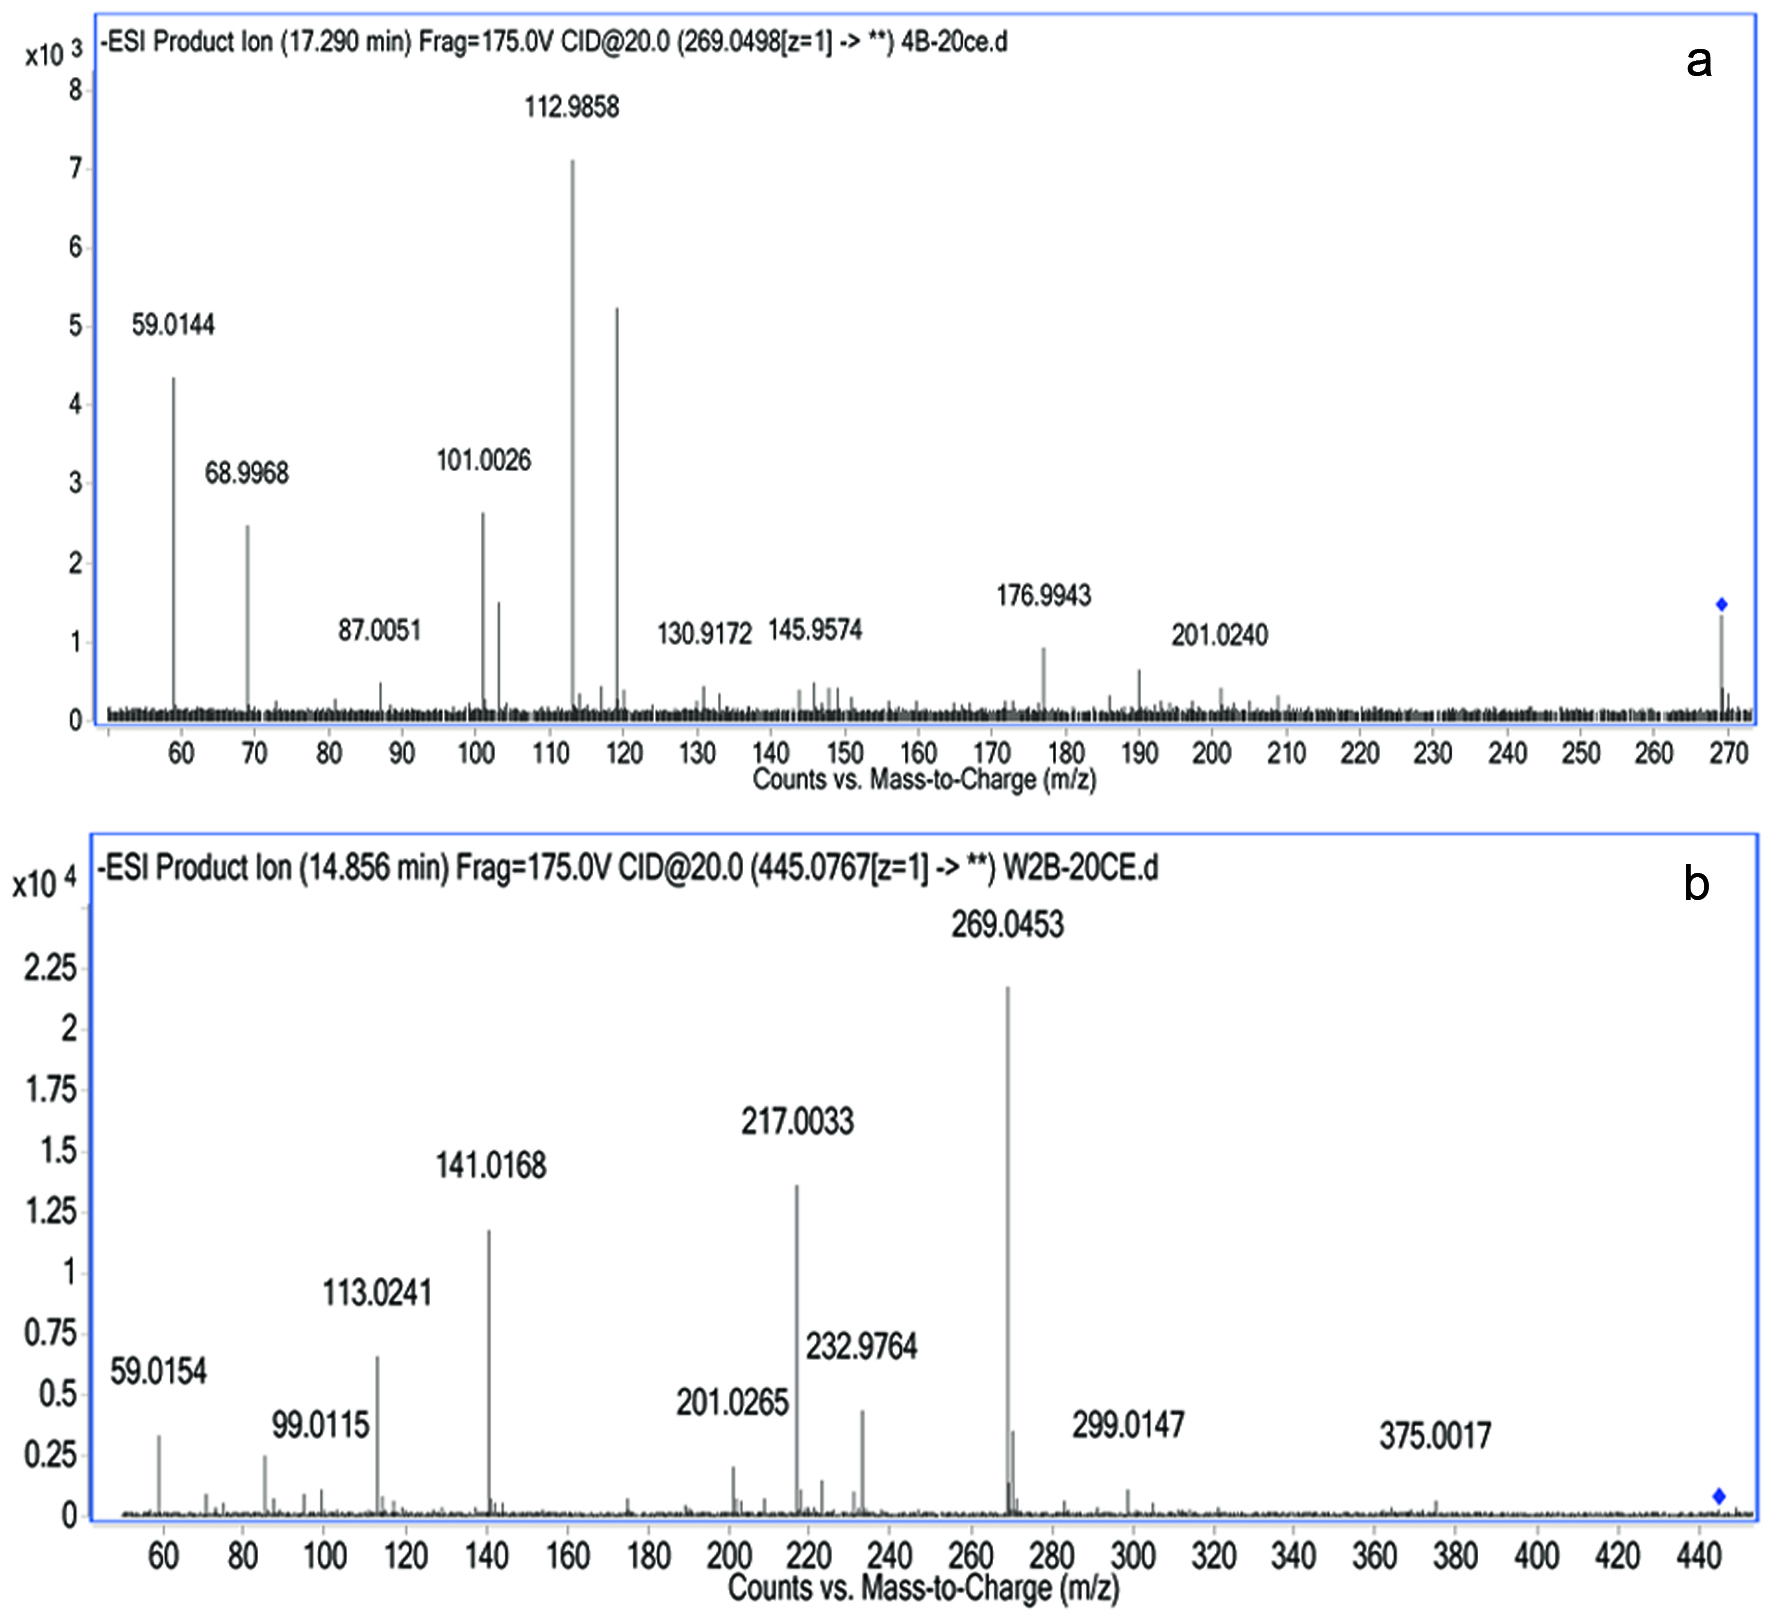
Figure 3. LC-ESI-MS/MS spectra of apigenin (a) and generated metabolite (b) detected in the basolateral compartment after incubation of bioaccessible apigenin prepared in modified HBSS on the apical compartment.
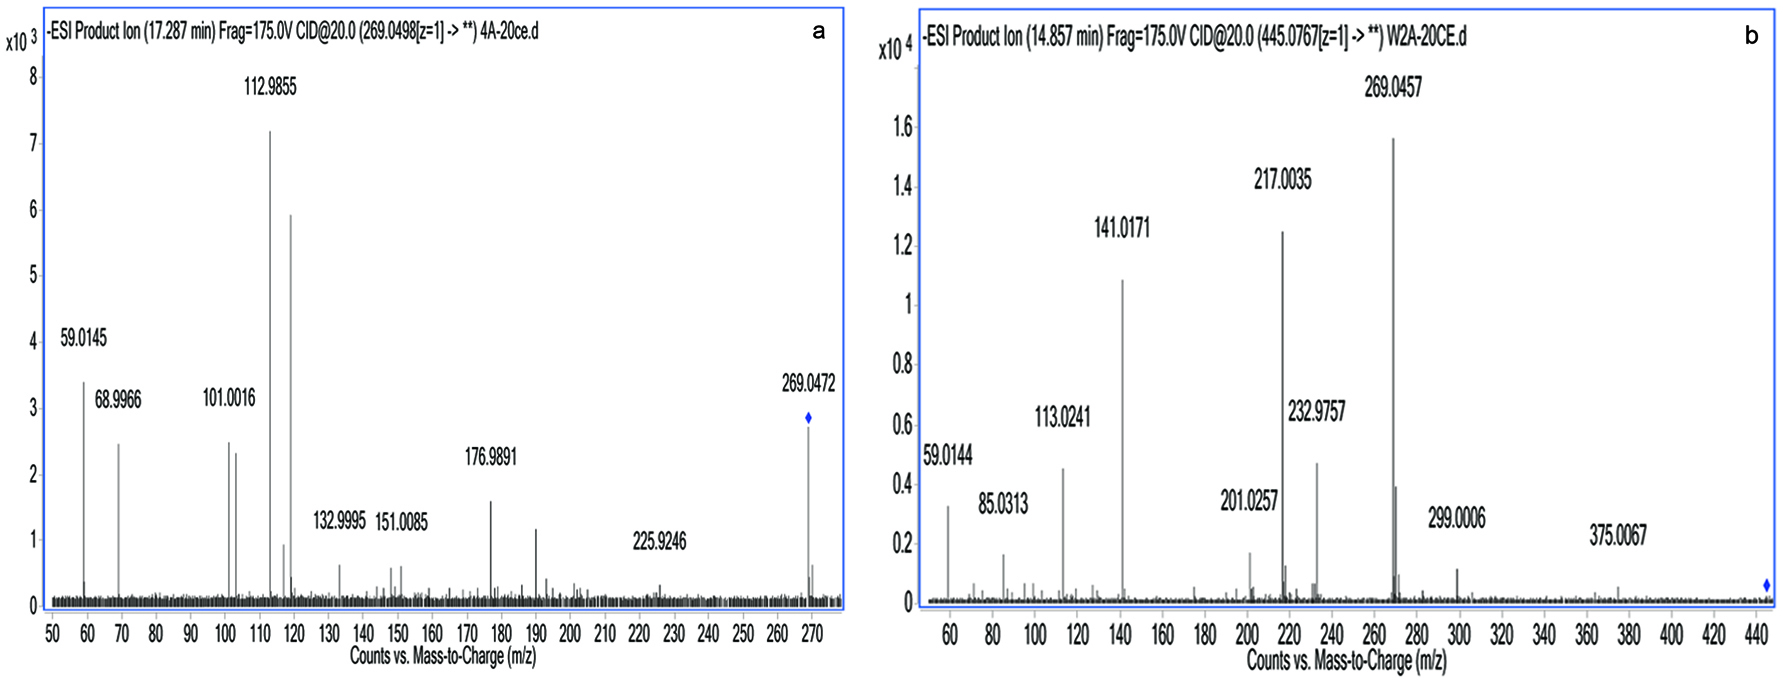
Figure 4. LC-ESI-MS/MS spectra of apigenin (a) and generated metabolite (b) detected in the apical compartment after incubation of bioaccessible apigenin prepared in modified HBSS on the basolateral compartment.
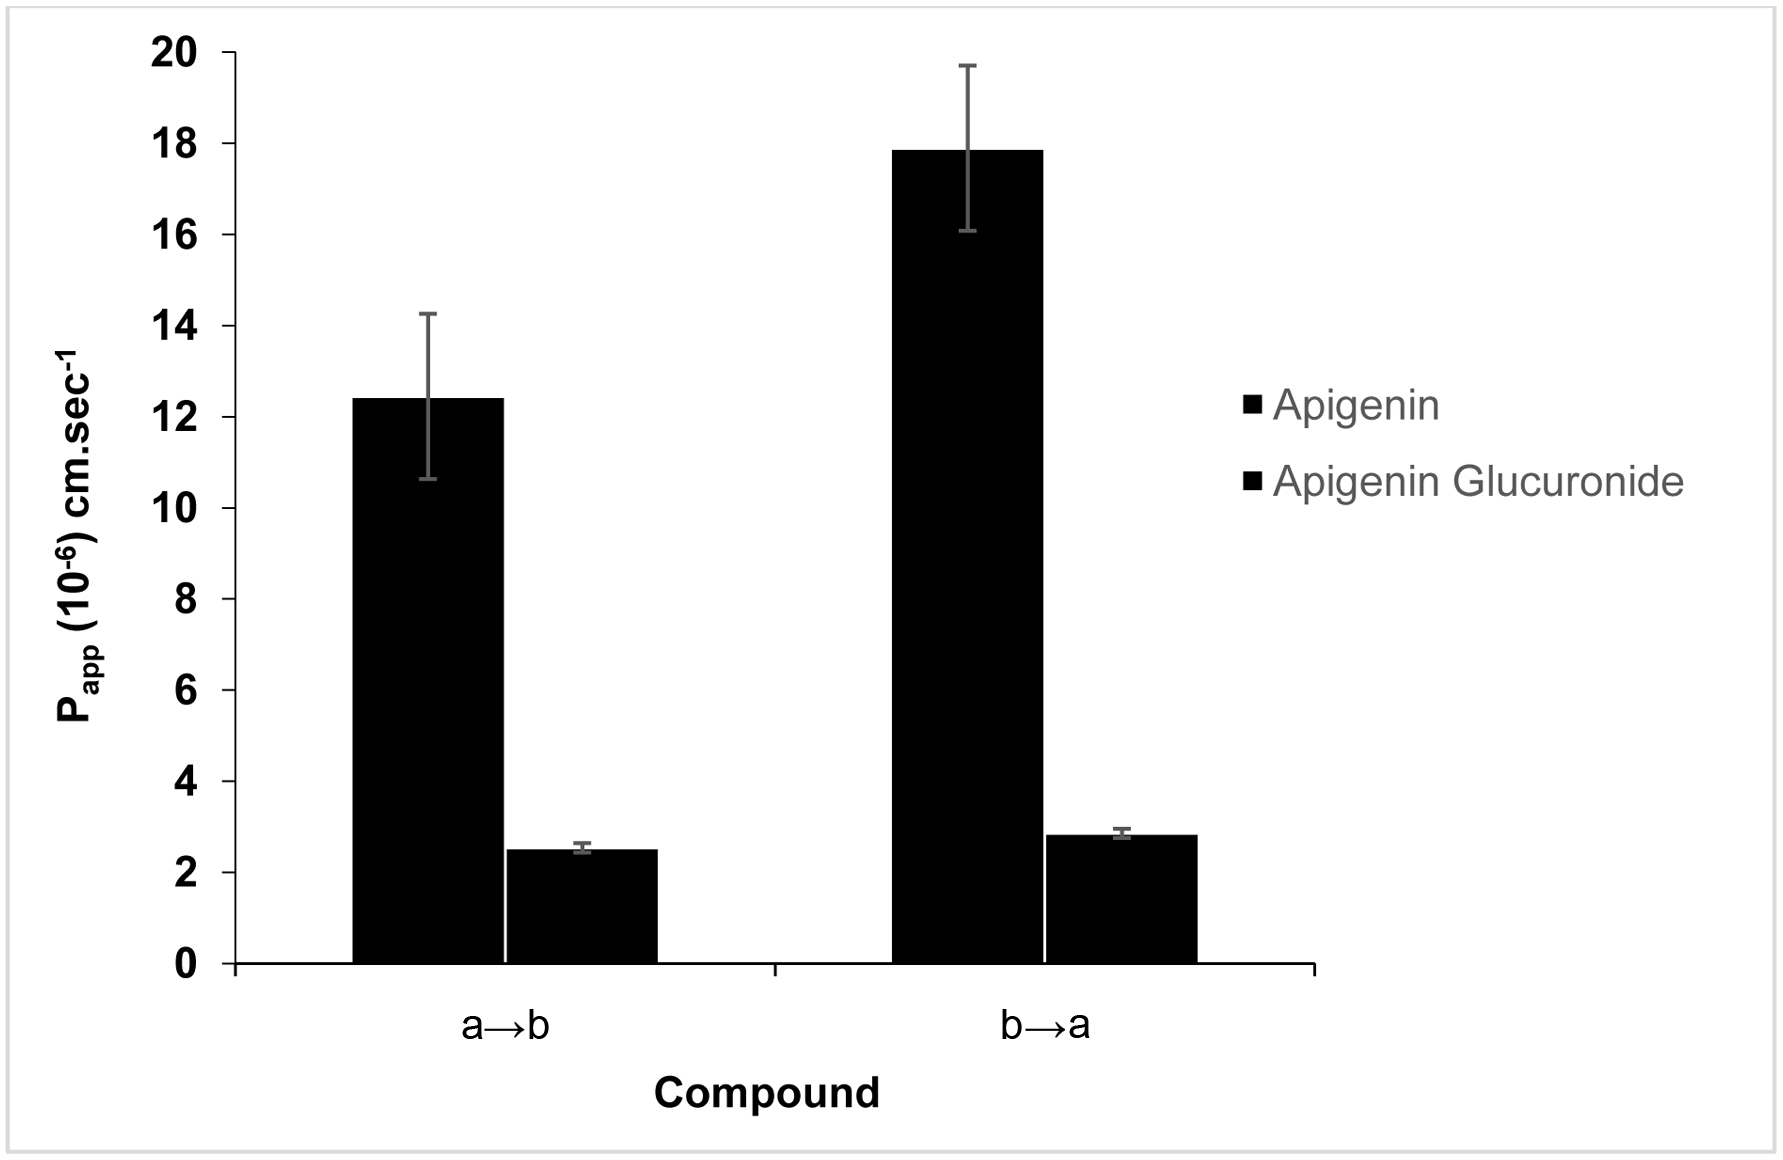
Figure 5. Transport of apigenin and its metabolite across Caco-2 cell monolayers from apical to basolateral (a→b) and basolateral to apical (b→a) directions.
Tables
Table 1. LC-MS/MS of apigenin and its metabolite formed after incubation using Caco-2 cells monolayer as a model of the human intestinal epithelium
| Peak | Compound | Retention time (min) | Theoretical [M-H]− (m/z) | Experimental [M-H]− (m/z) | Fragment ion [M-H]− (m/z) |
|---|
| 1 | Apigenin | 17.29 | 269.0467 | 269.0498 | 176.9943
112.9858
68.9968 |
| 2 | Apigenin glucuronide | 14.86 | 445.0849 | 445.0767 | 269.0453
217.0033
141.0168
113.0241 |
Table 2. Metabolism of apigenin by Caco-2 cells
| Metabolite | Transport | Metabolite production (pmol/cm2·min) |
|---|
| Apical | Basolateral |
|---|
| The culture incubated for 2 h in the presence of bioaccessible apigenin. a→b indicates the transport of compounds from apical to basolateral, b→a indicates the transport of compounds from basolateral to apical. a: Apical; b: Basolateral |
| Apigenin | a→b | 51.33 ± 2.08 | 27.99 ± 1.40 |
| b→a | 37.29 ± 1.94 | 43.65 ± 2.22 |
| Apigenin glucuronide | a→b | 4.61 ± 0.56 | 5.71 ± 0.48 |
| b→a | 6.55 ± 0.87 | 5.31 ± 0.52 |