Figures
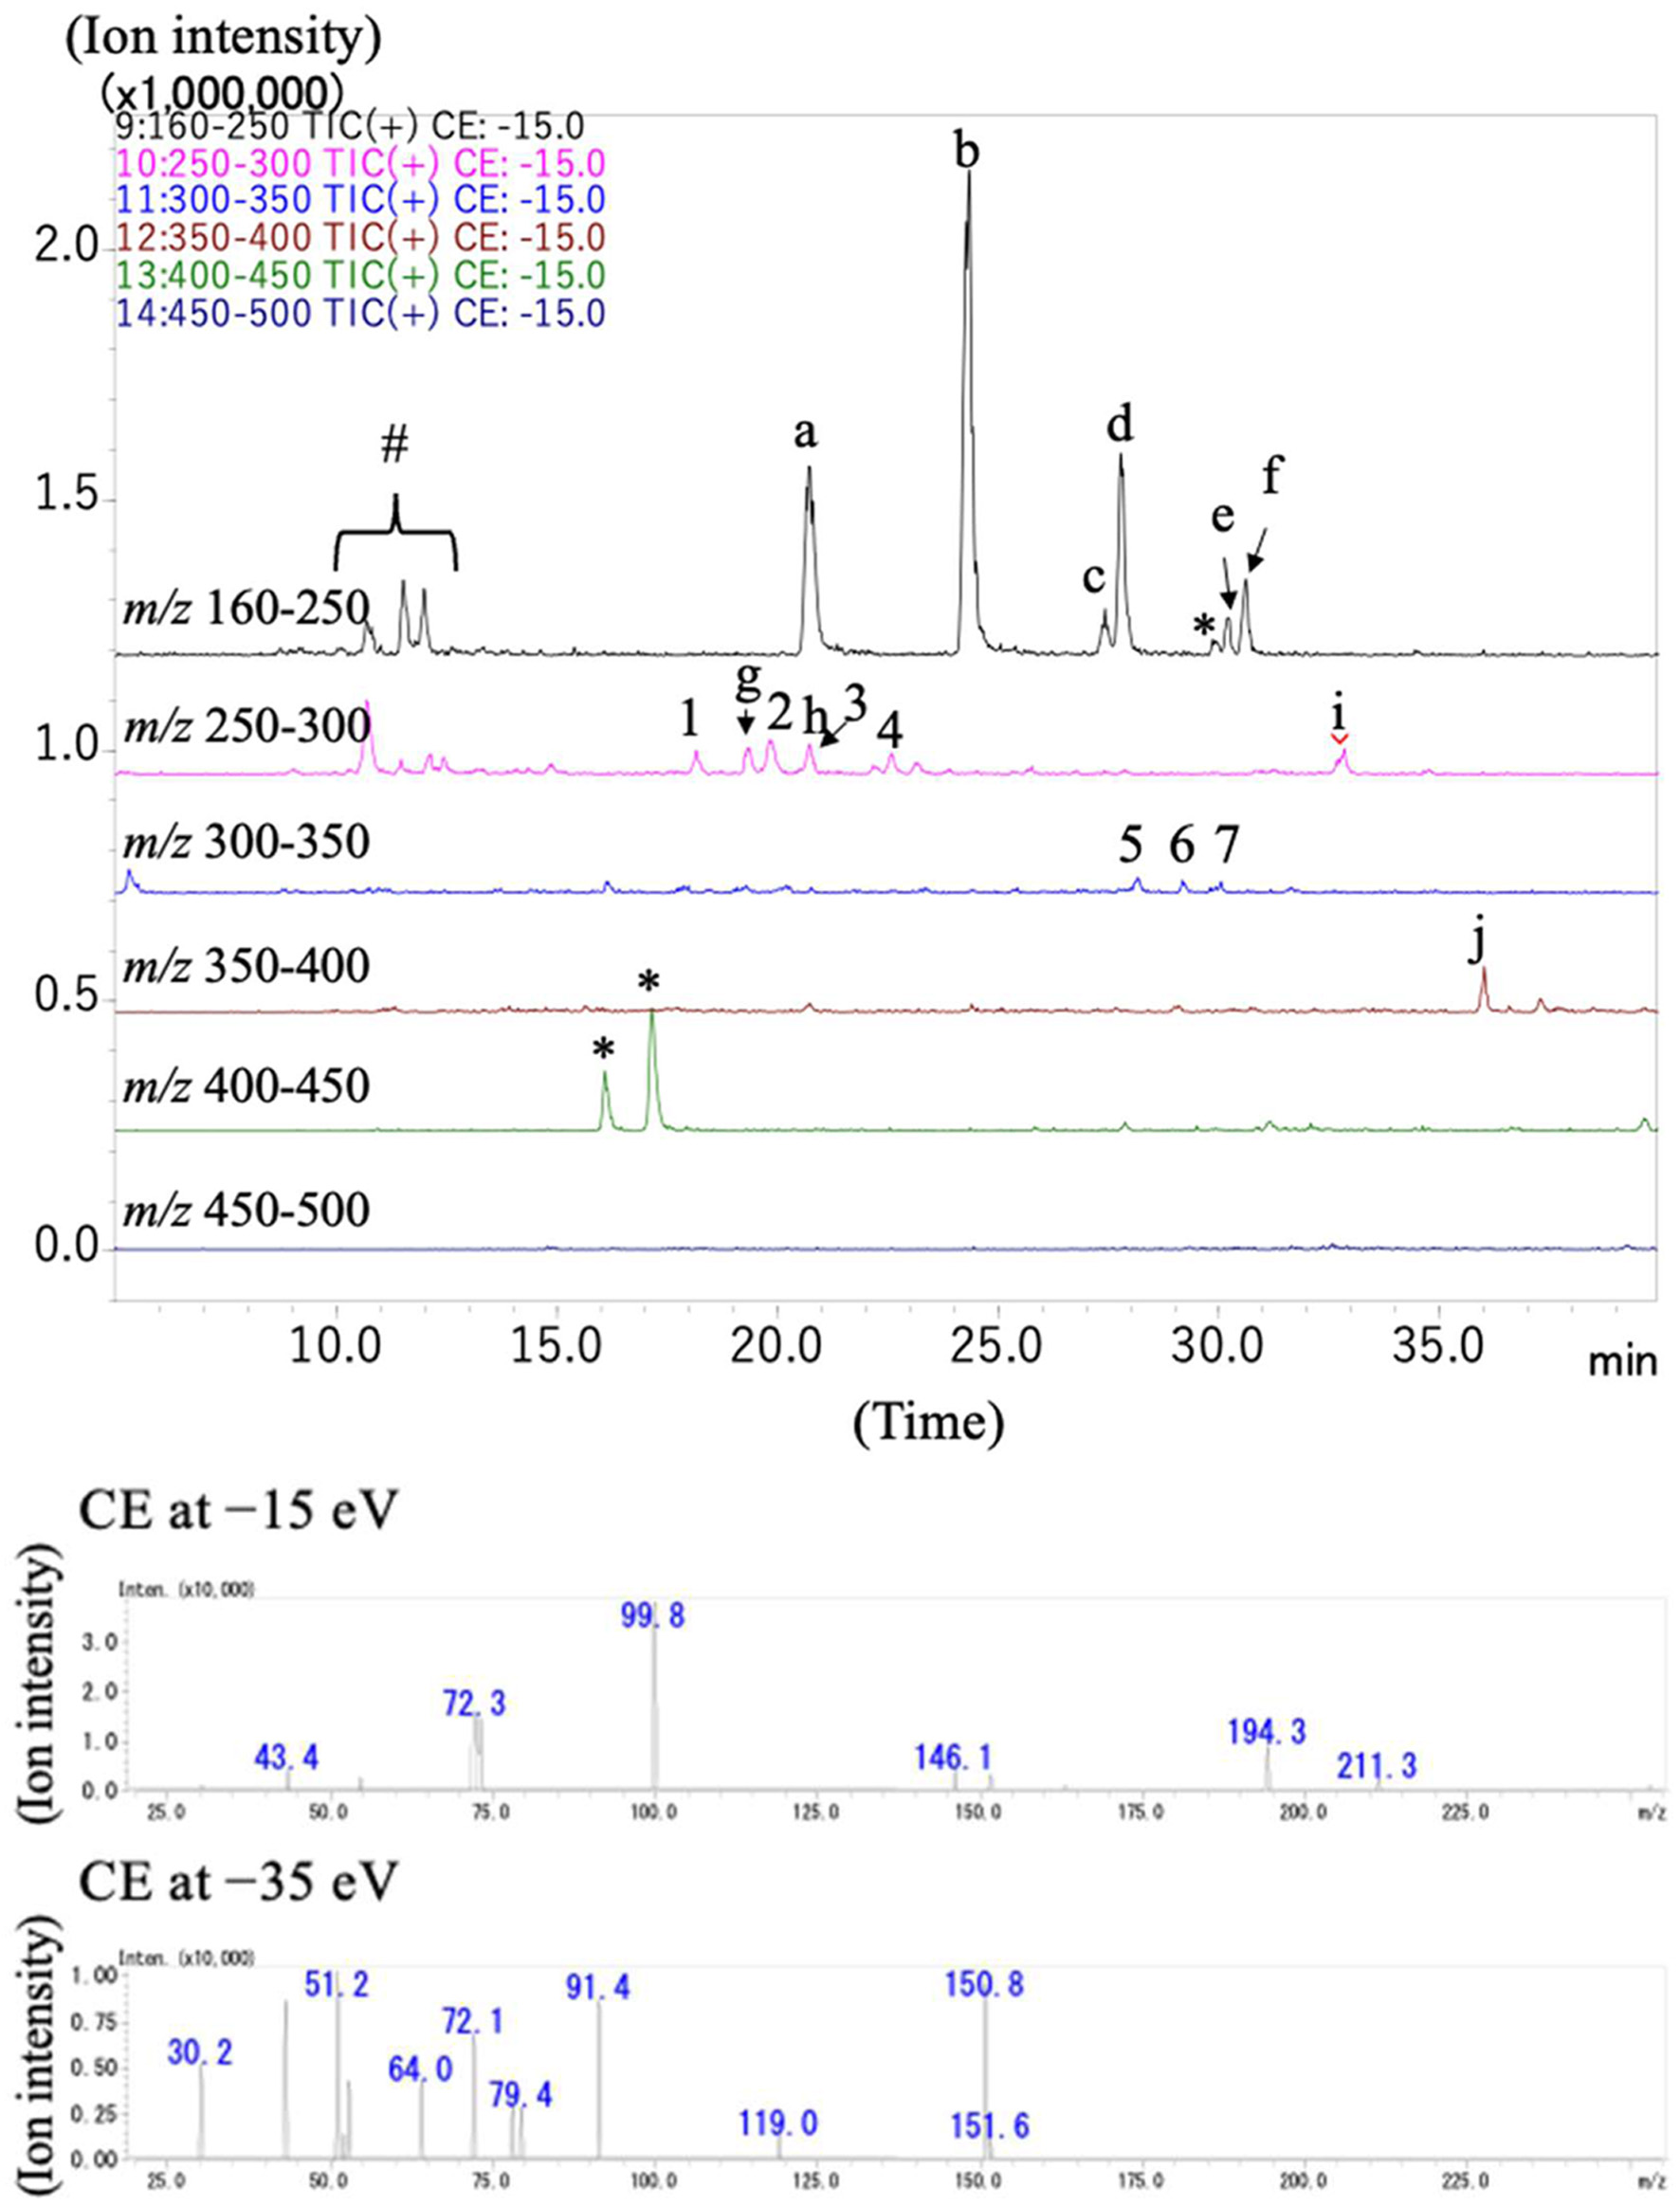
Figure 1. Mass chromatograms of 2-nitrophenylhydrazides of a cecal content of the rat in the HRP group in neutral loss scan mode (upper panel) and spectra of the product ions from precursor ions in peak 1 (lower panel). The peaks marked with lowercase in the chromatograms were estimated to be SCFAs and organic acids based on their retention time and m/z. The peaks marked with number were estimated to be modified amino acids consisting of SCFAs and amino acids on the basis of their m/z and mass spectra of product ion scanning. The peaks marked with sharp (#) were derived from the reagents and the peaks with asterisks could not be assigned to be any organic acids and modified amino acids. The product ion scan was carried out using collision energies at −35 and −15 eV.
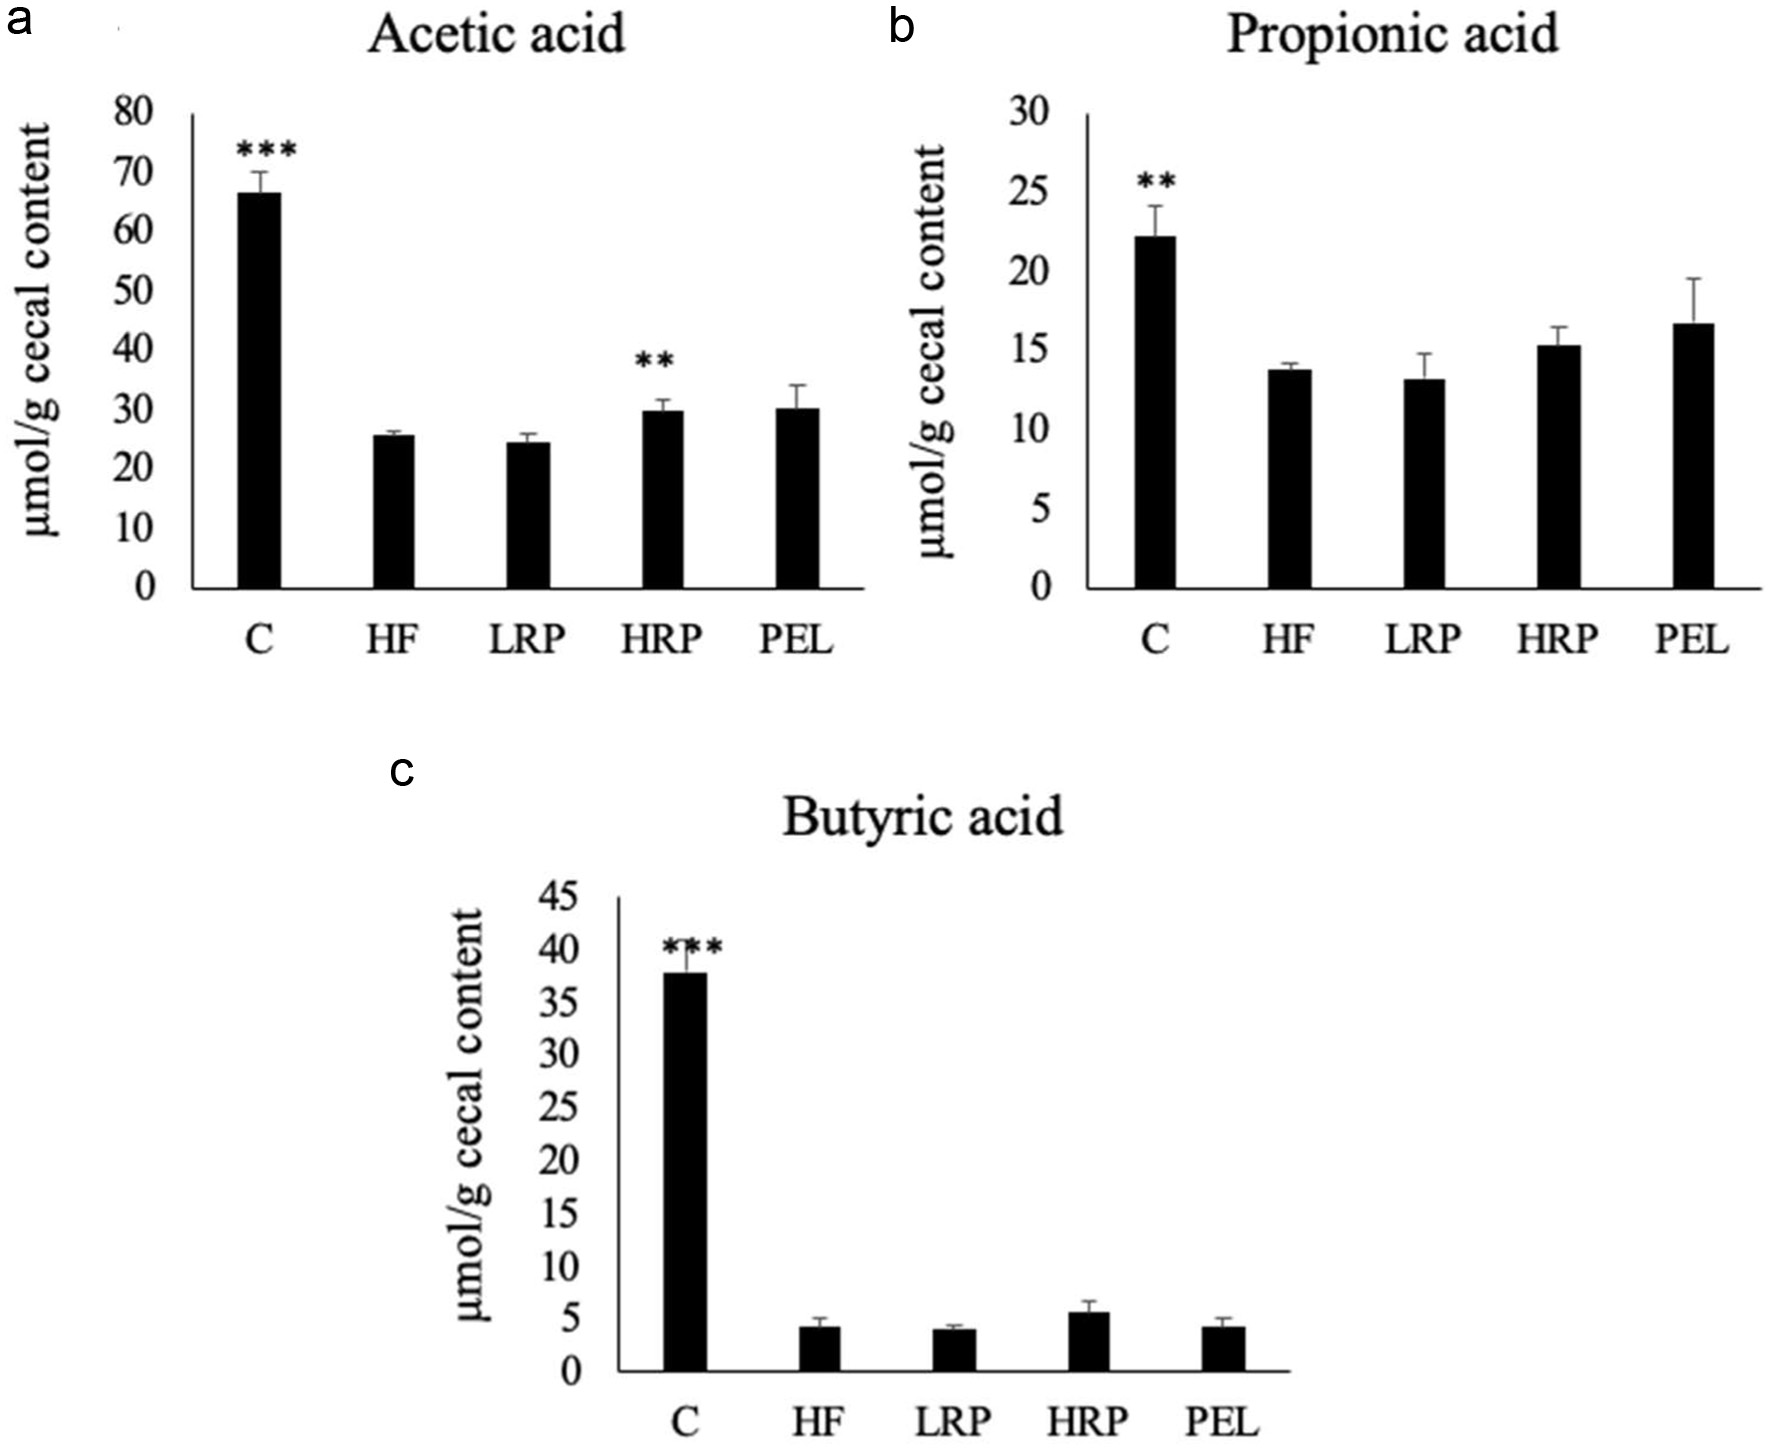
Figure 2. Concentrations of (a) acetic acid, (b) propionic acid, and (c) butyric acid in the cecal contents of rats. Data are shown as mean ± standard error (a–e, n = 4). Asterisks indicate significant differences compared to the HF group evaluated by Steel’s test (** p < 0.01, *** p < 0.001).
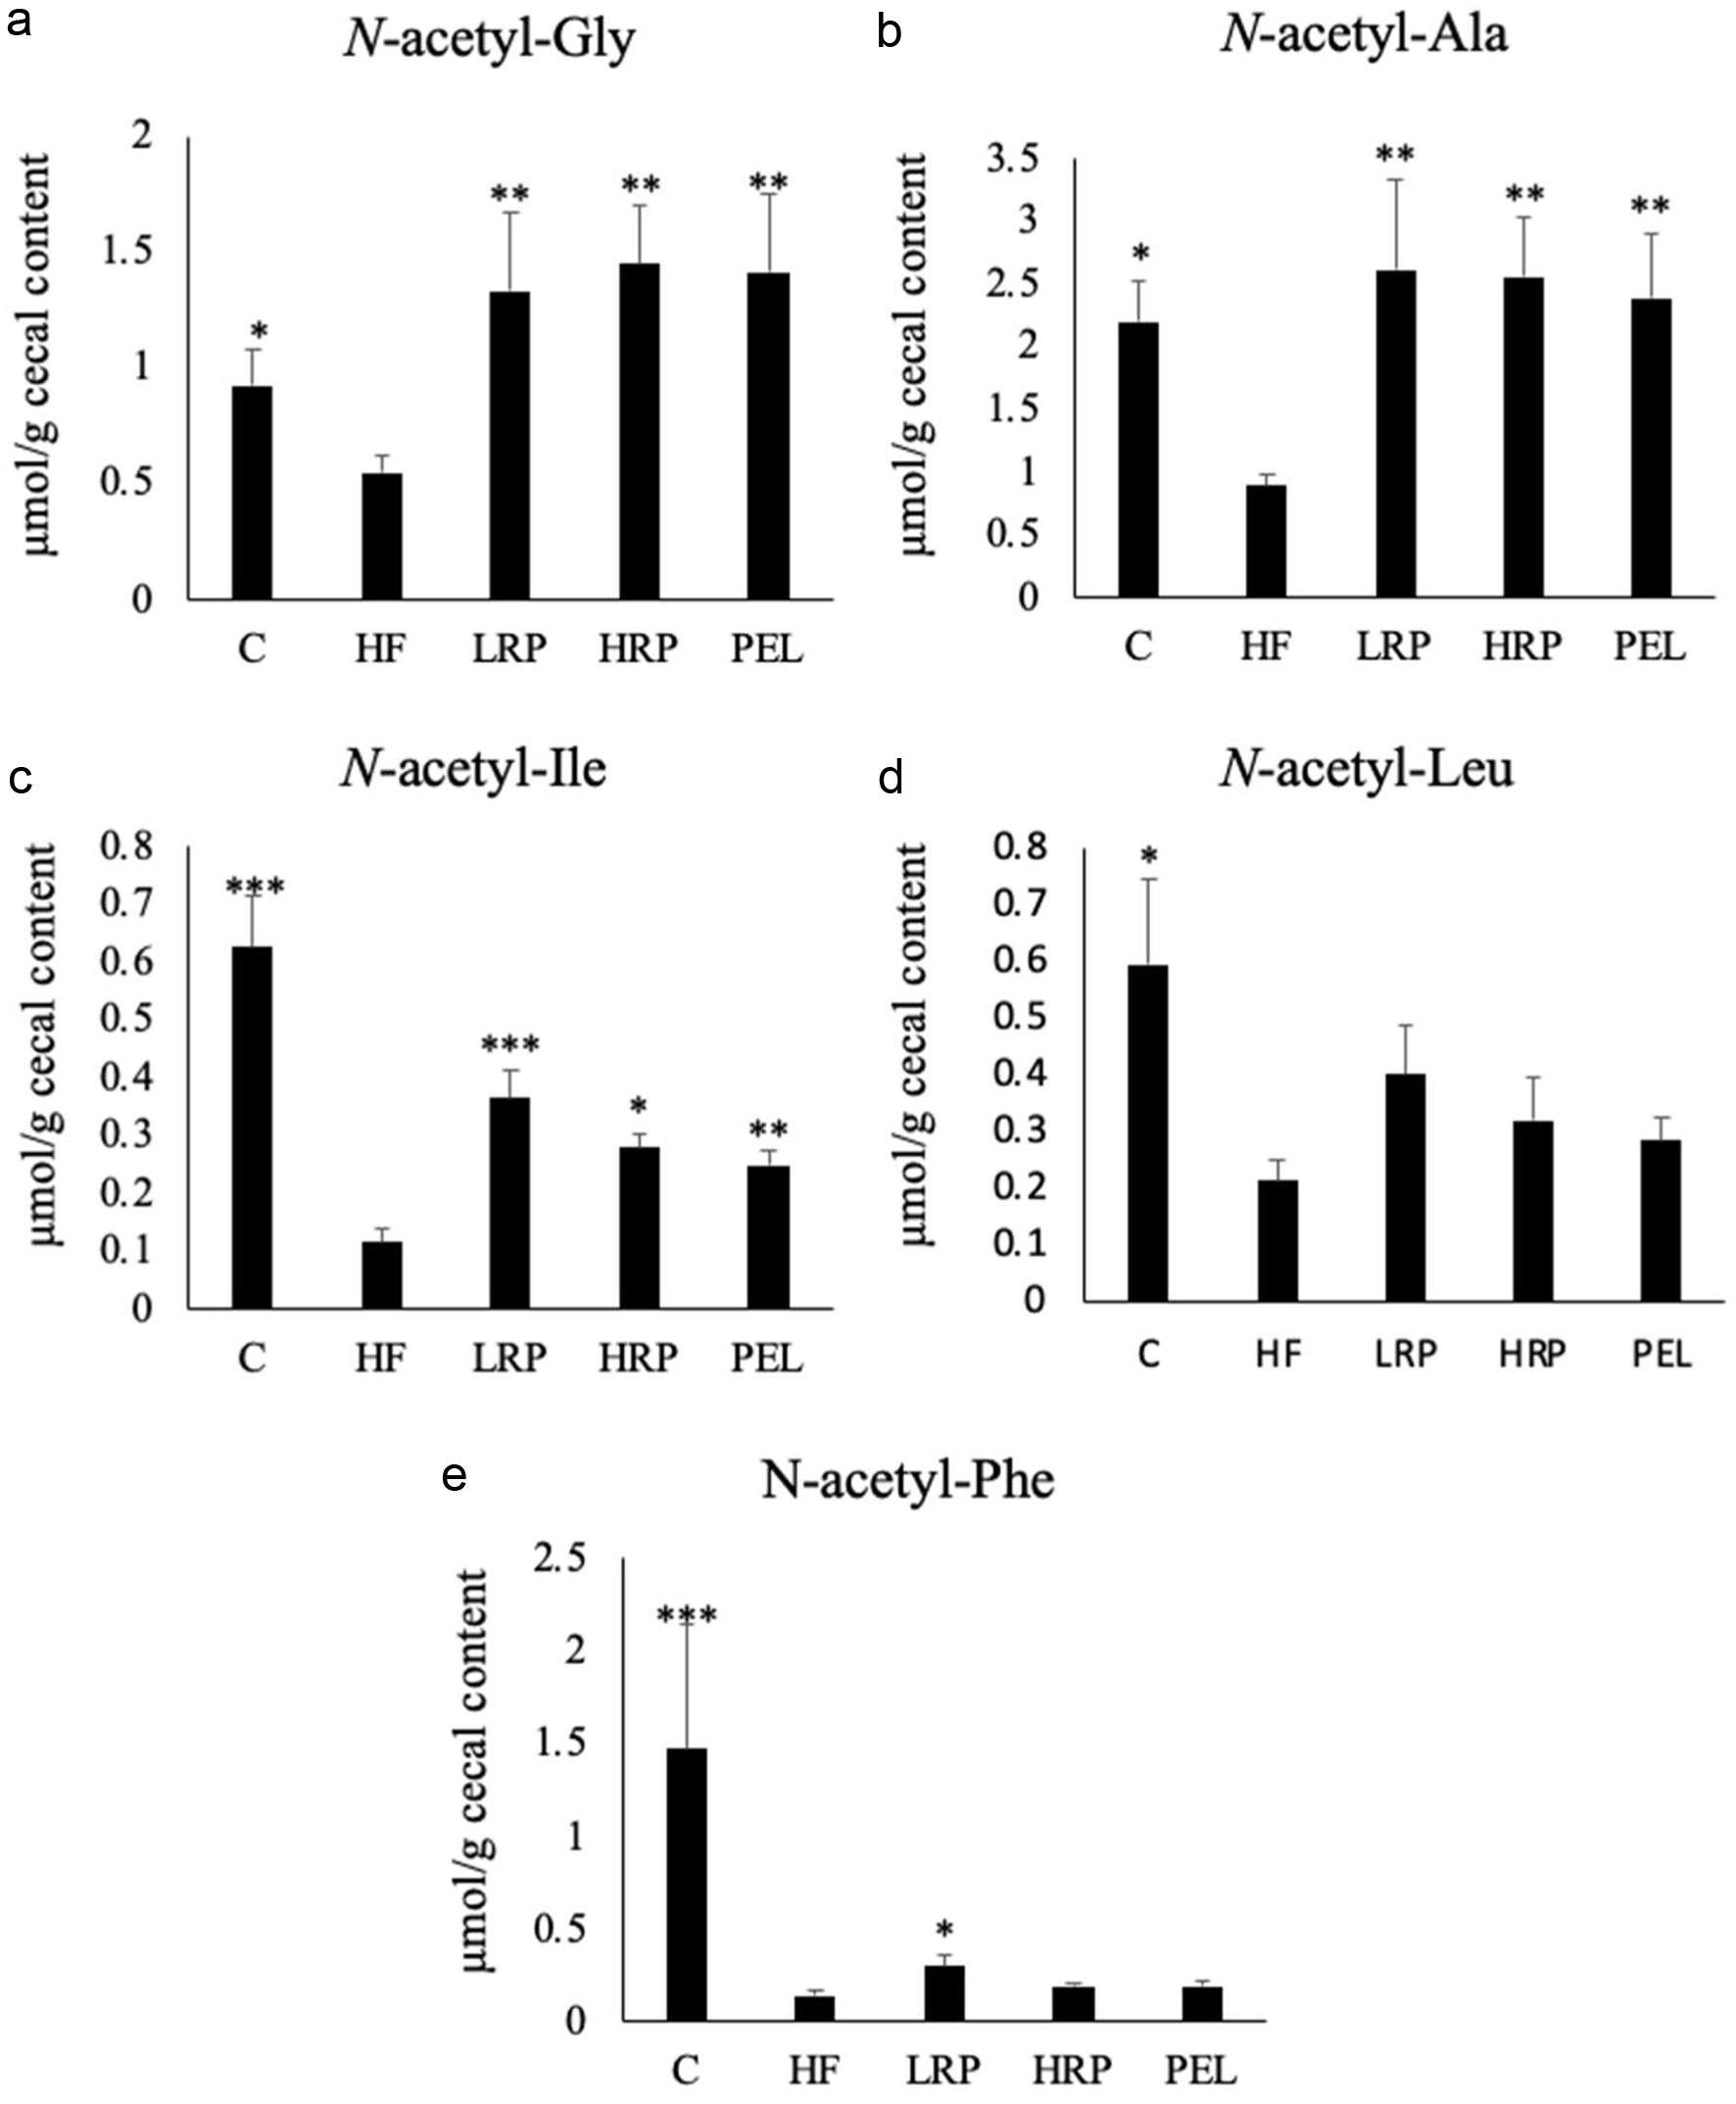
Figure 3. Concentrations of (a) N-acetyl-Gly, (b) N-acetyl-Ala, (c) N-acetyl-Ile, (d) N-acetyl-Leu, and (e) N-acetyl-Phe in the cecal content of rats. Data are shown as mean ± standard error (a–e, n = 4). Asterisks indicate significant differences compared to the HF group evaluated by Steel’s test (* p < 0.05, ** p < 0.01, *** p < 0.001).
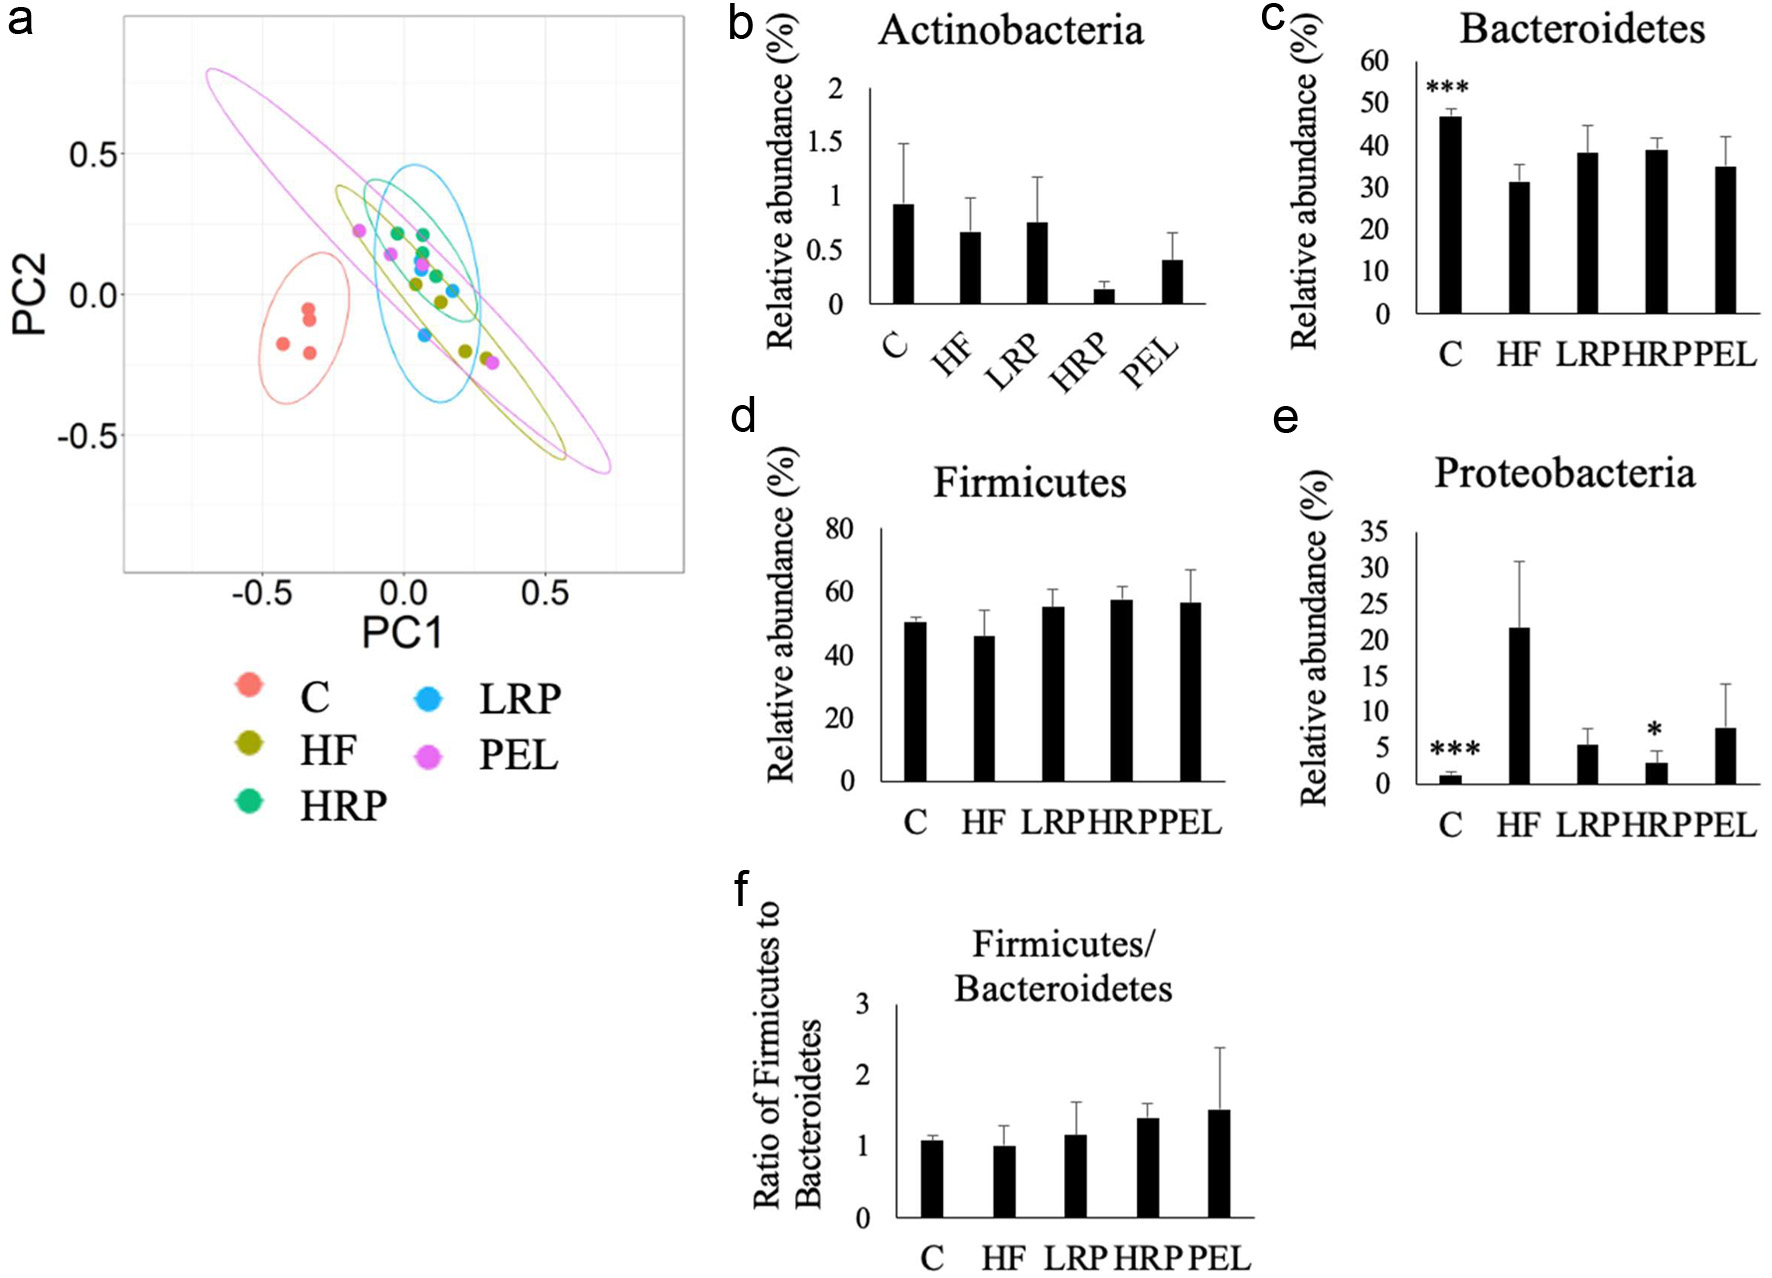
Figure 4. Non-metric multidimensional scaling (NMDS) plot of rat fecal microbiota based on Bray-Curtis distance (a) and the relative abundance of Actinobacteria (b), Bacteroidetes (c), Firmicutes (d), and Proteobacteria (e) and the ratio of Firmicutes to Bacteroidetes (f) in the rat fecal microbiota. Data are shown as mean ± standard error (b–f, n = 4). Asterisks indicate significant differences compared to the HF group by Steel test (* p < 0.05, *** p < 0.001).
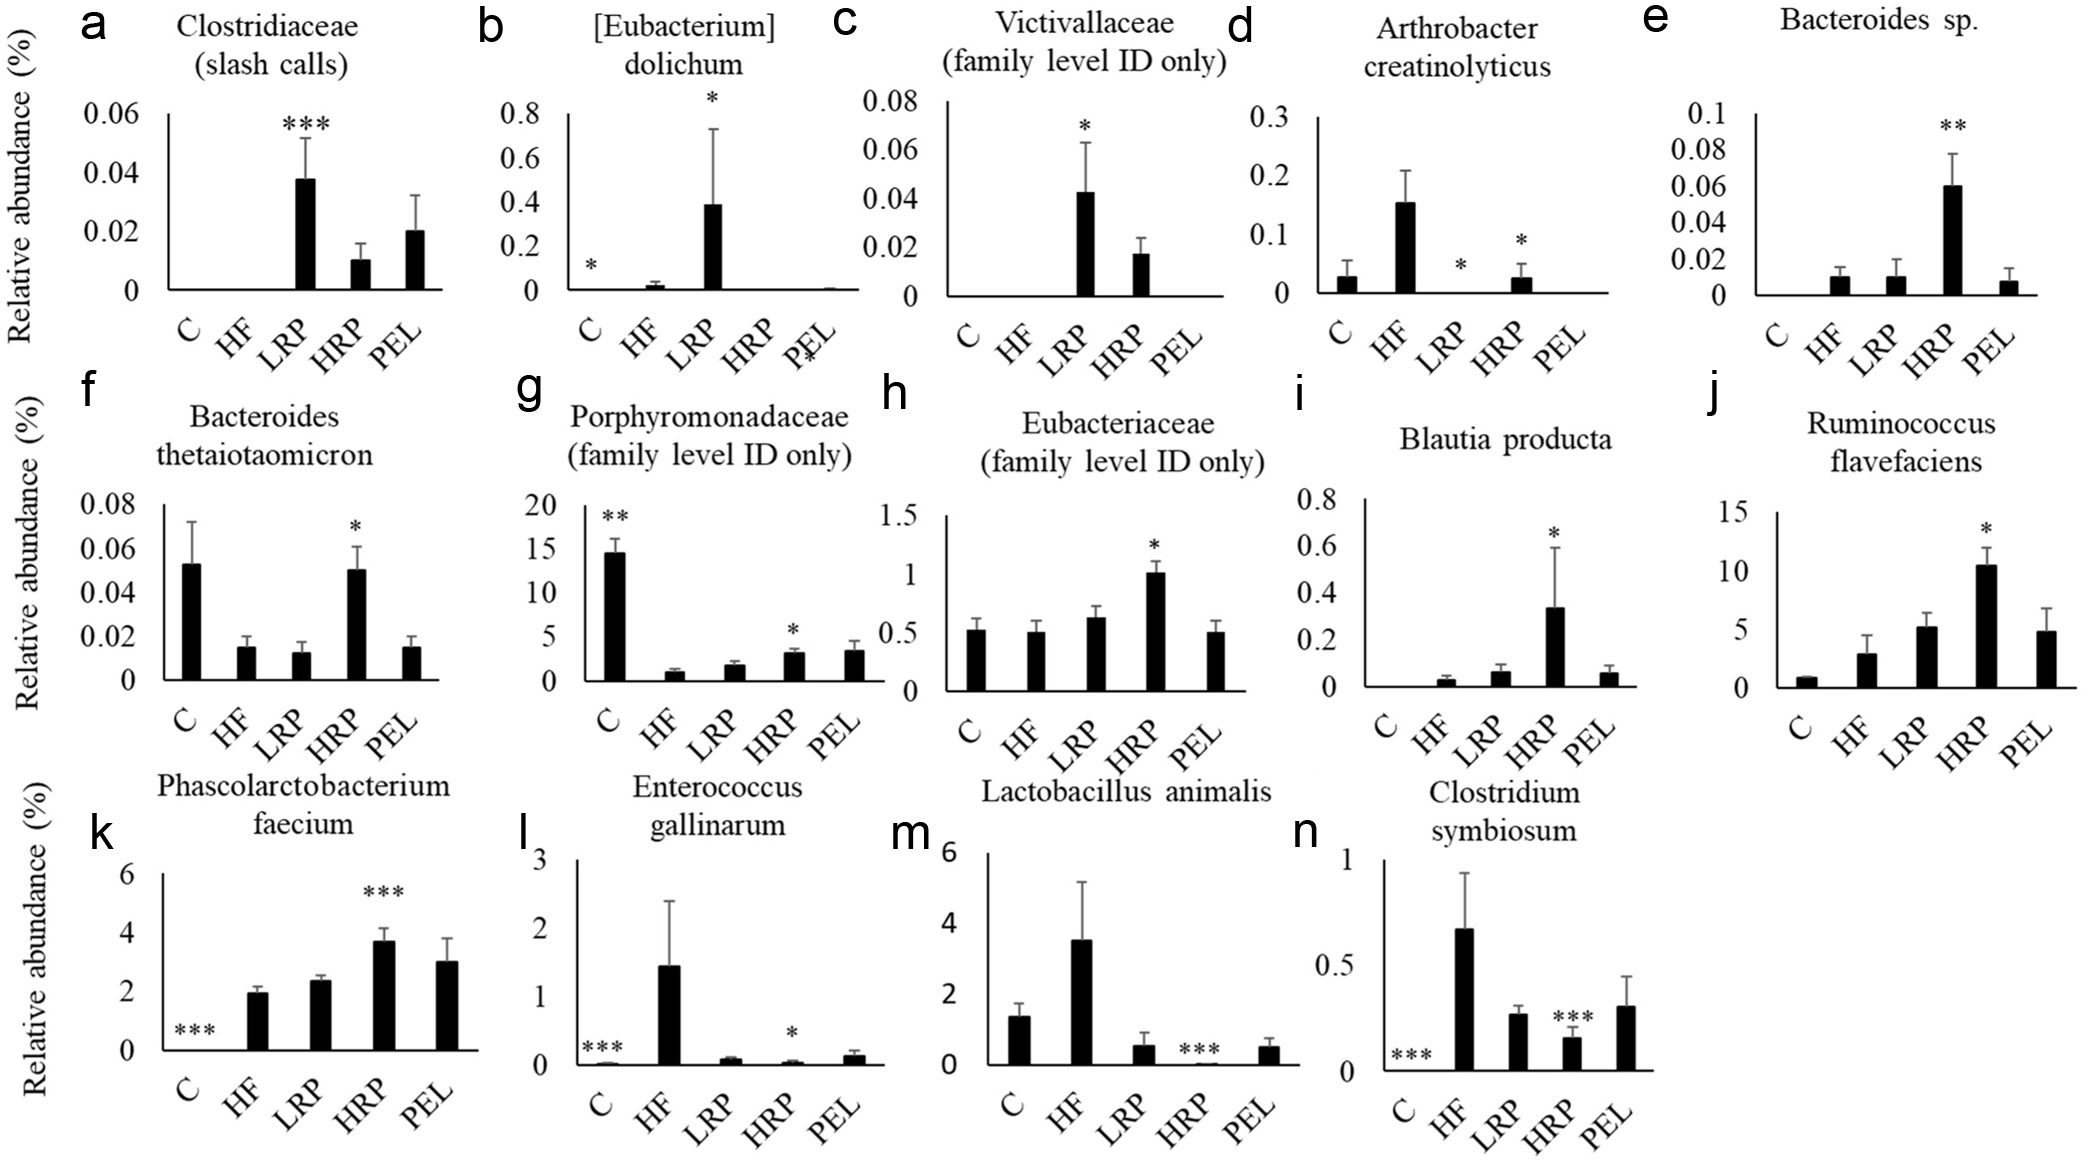
Figure 5. Relative abundance of Clostridiaceae (slash calls) (a), [Eubacterium] dolichum (b), Victivallaceae (family level ID only) (c), Arthrobacter creatinolyticus (d), Bacteroides sp. (e), Bacteroides thetaiotaomicron (f), Porphyromonadaceae (family level ID only) (g), Eubacteriaceae (family level ID only) (h), Blautia producta (i), Ruminococcus flavefaciens (j), Phascolarctobacterium faecium (k), Enterococcus gallinarum (l), Lactobacillus animalis (m), and Clostridium symbiosum (n) in the rat fecal microbiota. “Slash calls” indicate ambiguous assignments where sequences matched multiple taxa with similar confidence and could not be uniquely assigned to a single genus. Square brackets in [Eubacterium] dolichum denote a taxon that is currently considered misclassified in that genus and awaits formal taxonomic revision. “Family level ID only” indicates sequences that could be classified with sufficient confidence only to the family rank based on the 16S rRNA gene. Data are shown as mean ± standard error (A–N, n = 4). Asterisks indicate significant differences compared to the HF group by Steel’s test (* p < 0.05, *** p < 0.001).
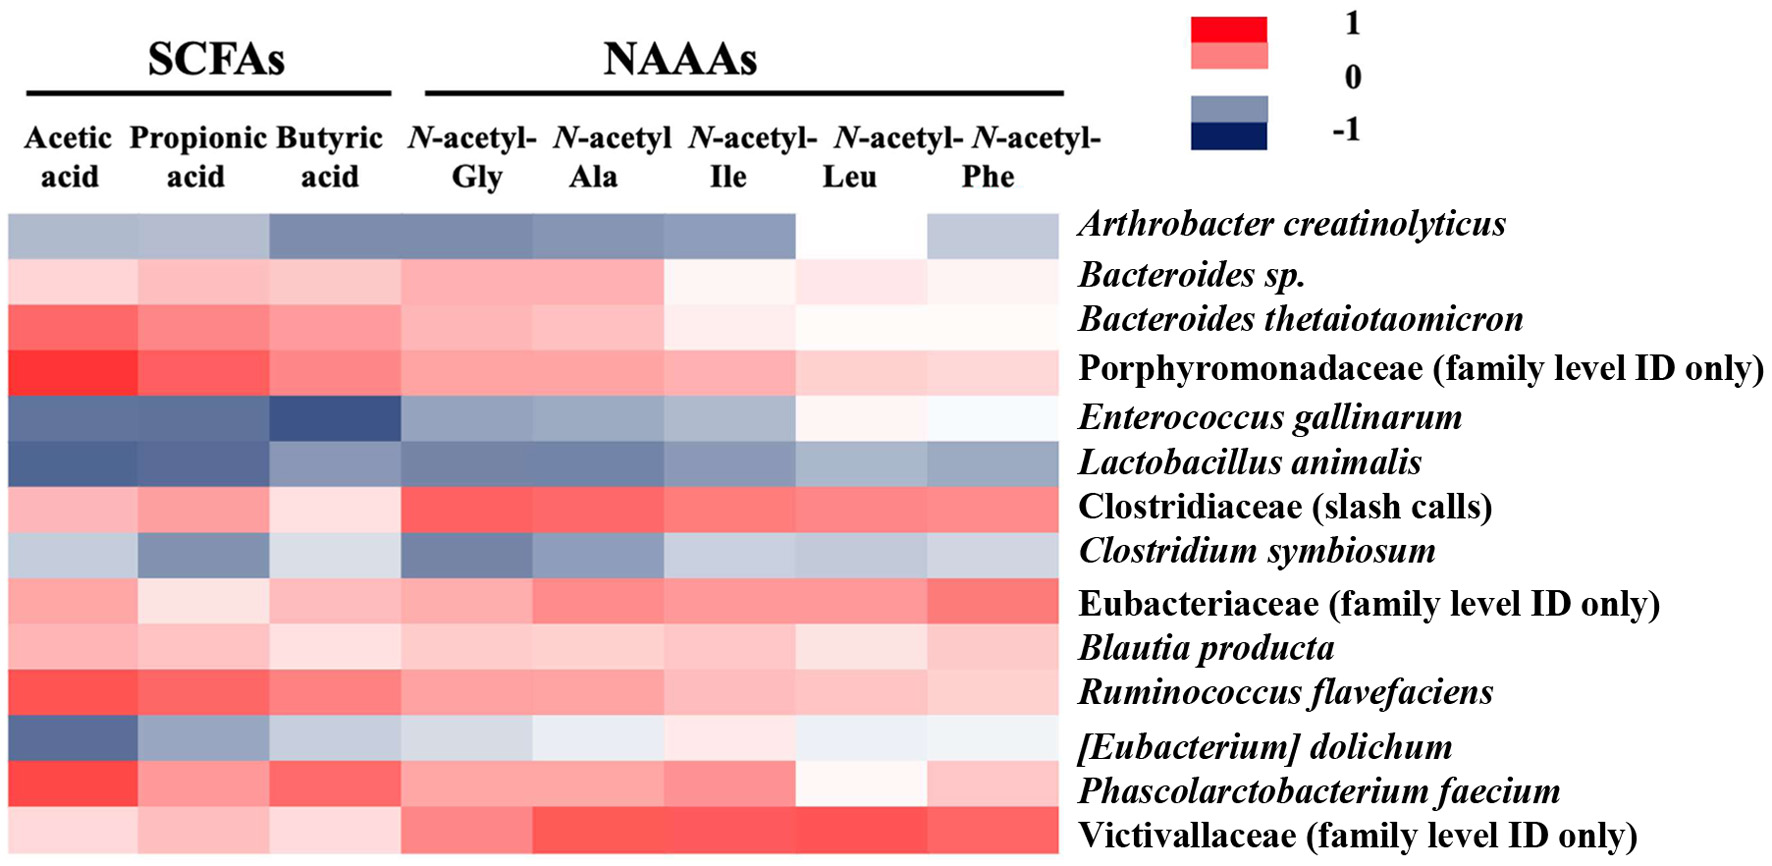
Figure 6. A heat map of Spearman’s rank correlation coefficients between fecal microbial species and SCFAs and NAAAs.
Tables
Table 1. Summary of estimated SCFAs and organic acids in the rat cecal contents
| Peak | Estimated compound | Precursor ion (m/z) |
|---|
| a | Acetic acid | 196 |
| b | Propionic acid | 210 |
| c | Isobutyric acid | 224 |
| d | Butyric acid | 224 |
| e | Isovaleric acid | 238 |
| f | Valeric acid | 238 |
| g | Pyroglutamic acid | 265 |
| h | Succinic acid | 254 |
| i | Capronic acid | 252 |
| j | Pyruvic anid (with two 2-NPH) | 359 |
Table 2. Summary of estimated modified amino acids in the rat cecal contents
| Peak number | Estimated compound | Precursor ion (m/z) | Product ions (m/z) |
|---|
| Asterisks (*) indicate immonium ions of amino acids. |
| 1 | N-acetyl-glycine | 253 | 30 (Gly*), 43, 72, 100, 194, 211 |
| 2 | N-acetyl-alanine | 267 | 44 (Ala*), 86, 114, 208 |
| 3 | N-propionyl-glycine | 267 | 30 (Gly*), 57, 73, 86, 114, 194, 211 |
| 4 | N-propionyl-alanine | 281 | 44 (Ala*), 57, 100, 128 |
| 5 | N-acetyl-isoleucine/leucine | 309 | 86 (Ile/Leu*), 128, 156 |
| 6 | N-acetyl-phenylalanine | 343 | 120 (Phe*), 162, 190 |
| 7 | N-propionyl-isoleucine/leucine | 323 | 57, 86 (Ile/Leu*), 142, 170 |
Table 3. Initial and final body weight and total food intake in rats
| C | HF | LRP | HRP | PEL |
|---|
| Data are shown as mean ± standard deviation (n = 4). |
| Initial body weight (g) | 176.93 ± 11.68 | 177.75 ± 7.15 | 177.33 ± 6.36 | 177.55 ± 5.77 | 178.10 ± 6.30 |
| Final body weight (g) | 380.08 ± 34.36 | 386.95 ± 1.49 | 377.65 ± 18.18 | 385.53 ± 5.74 | 400.03 ± 15.41 |
| Total food intake (kcal) | 2,383.49 ± 259.79 | 2,440.92 ± 52.39 | 2,336.15 ± 162.91 | 2,405.56 ± 69.64 | 2,565.55 ± 85.26 |
Table 4. Summary of blood biochemical values in rats
| C | HF | LRP | HRP | PEL |
|---|
| Data are shown as mean ± standard deviation (n = 4). Asterisks indicate significant difference compared to the HF group by Dunnett’s test (** p < 0.01). |
| Albumin (g/dL) | 3.67 ± 0.11 | 3.98 ± 0.07 | 3.83 ± 0.05 | 3.88 ± 0.10 | 3.73 ± 0.06 |
| Creatinine (mg/dL) | 0.28 ± 0.01 | 0.31 ± 0.01 | 0.33 ± 0.02 | 0.32 ± 0.01 | 0.30 ± 0.00 |
| AST (IU/L) | 58.75 ± 2.13 | 63.25 ± 1.14 | 72.75 ± 3.66 | 67.00 ± 1.84 | 64.25 ± 2.48 |
| ALT (IU/L) | 43.25 ± 3.49 | 47.25 ± 2.33 | 53.50 ± 1.30 | 47.25 ± 3.96 | 46.50 ± 2.25 |
| Alkaline phosphatase (IU/L) | 960.00 ± 36.78** | 1,323.25 ± 110.57 | 1,255.00 ± 42.11 | 1,205.50 ± 55.37 | 1,108.75 ± 12.46 |
| Total cholesterol (mg/dL) | 69.00 ± 3.79 | 79.75 ± 0.74 | 79.75 ± 2.97 | 82.25 ± 1.78 | 81.25 ± 4.08 |
| Triglyceride (mg/dL) | 105.50 ± 11.29 | 137.50 ± 9.25 | 163.25 ± 24.67 | 182.50 ± 17.90 | 241.00 ± 18.39** |
| Glucose (mg/dL) | 147.75 ± 4.90 | 152.25 ± 1.88 | 147.75 ± 8.63 | 162.00 ± 10.68 | 154.25 ± 3.25 |