Figures
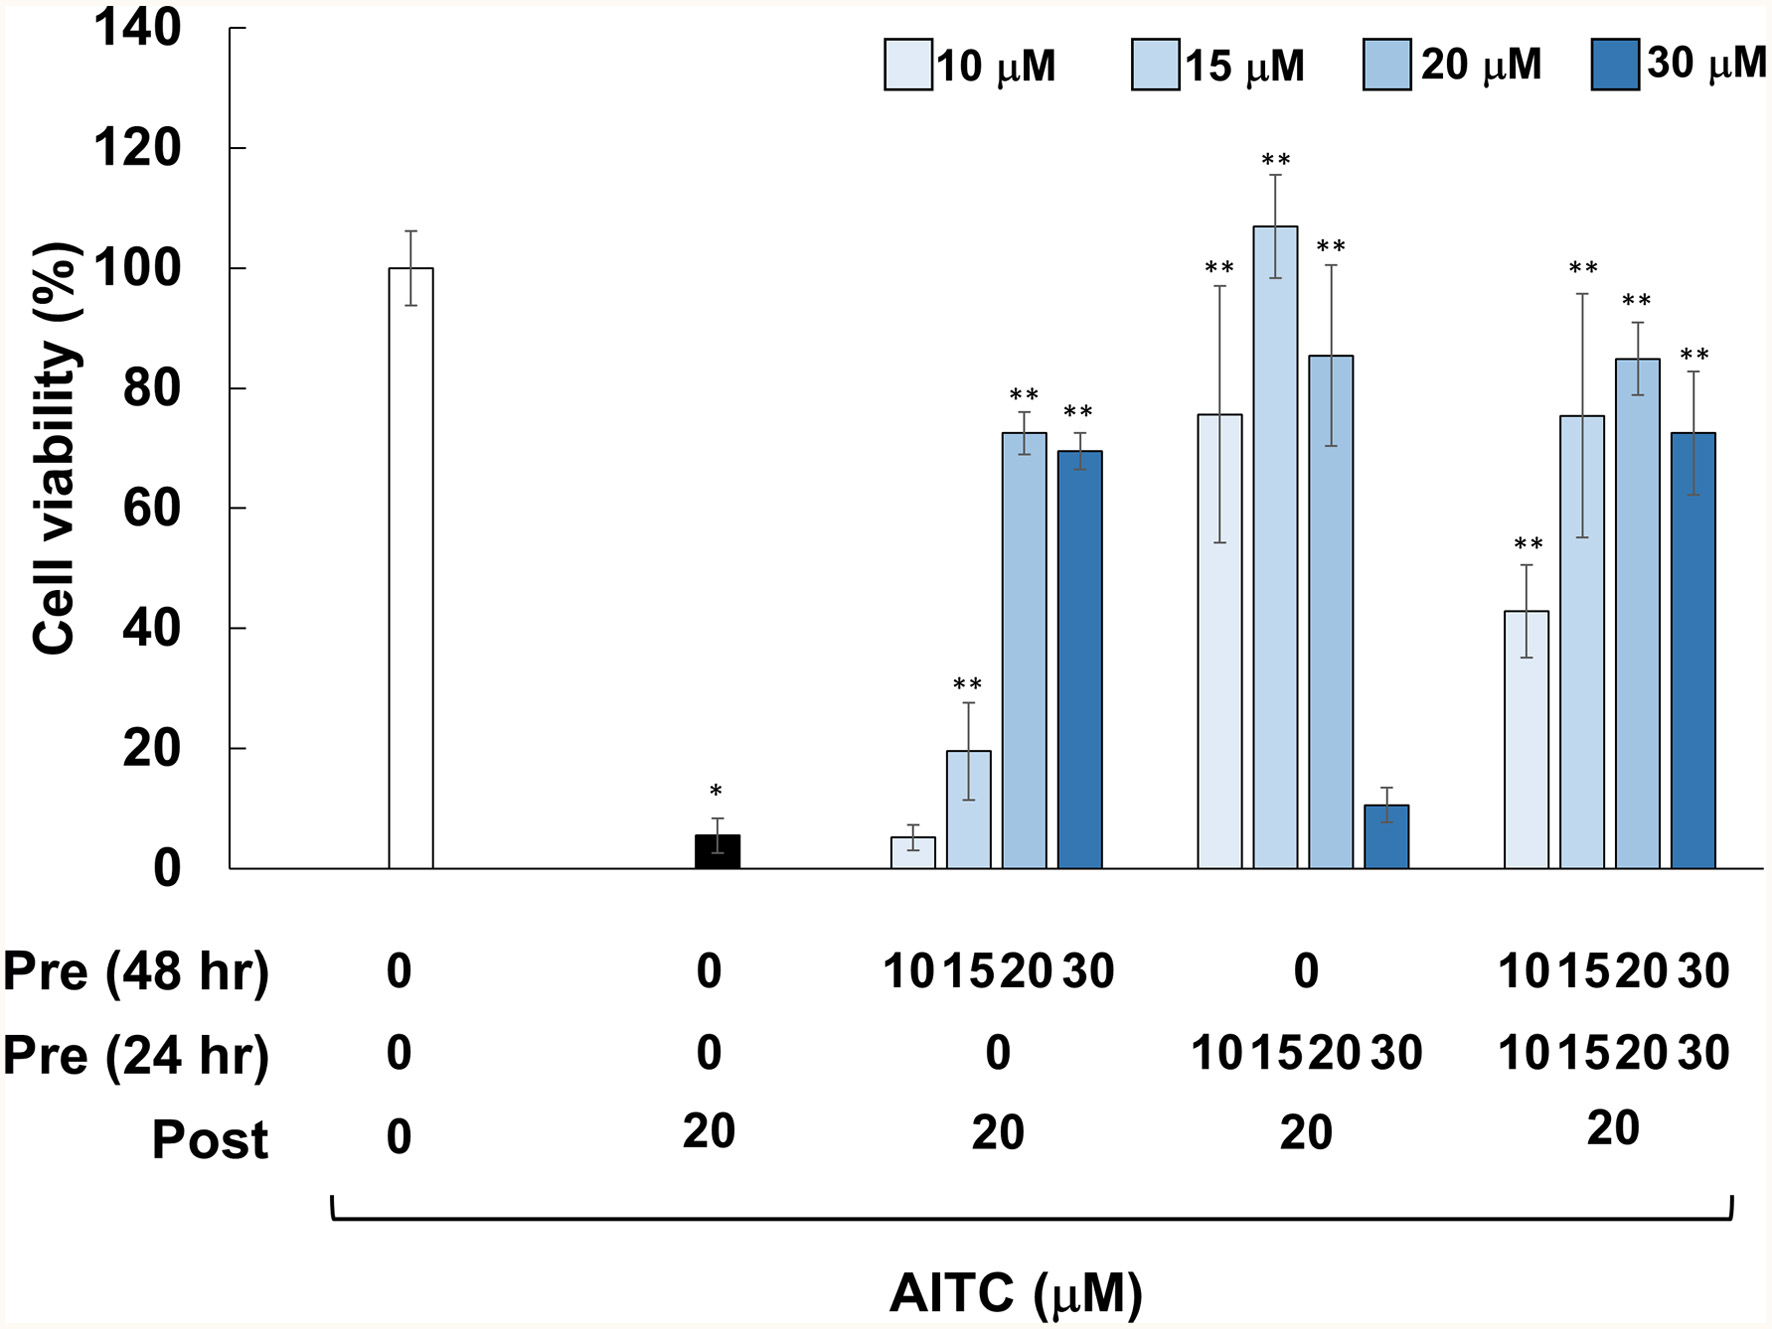
Figure 1. Effects of pretreatments with AITC on cytotoxicity induced by AITC posttreatment. RGM1 cells (2 x 10⁵/200 μL) were exposed to the vehicle (DMSO) or AITC (10–30 μM) for 24 hr. After washing, the cells were treated with the vehicle or AITC (10–30 μM) for another 24 hr, and then incubated with the vehicle or AITC (20 μM) for 24 hr, followed by measurement of cell viability. The data are shown by means ± SD (n = 4), *p < 0.05 versus Control (vehicle treatments at 3 times), **p < 0.05 vs. AITC (20 μM) after vehicle treatment twice (black bar) in Student’s t-test.
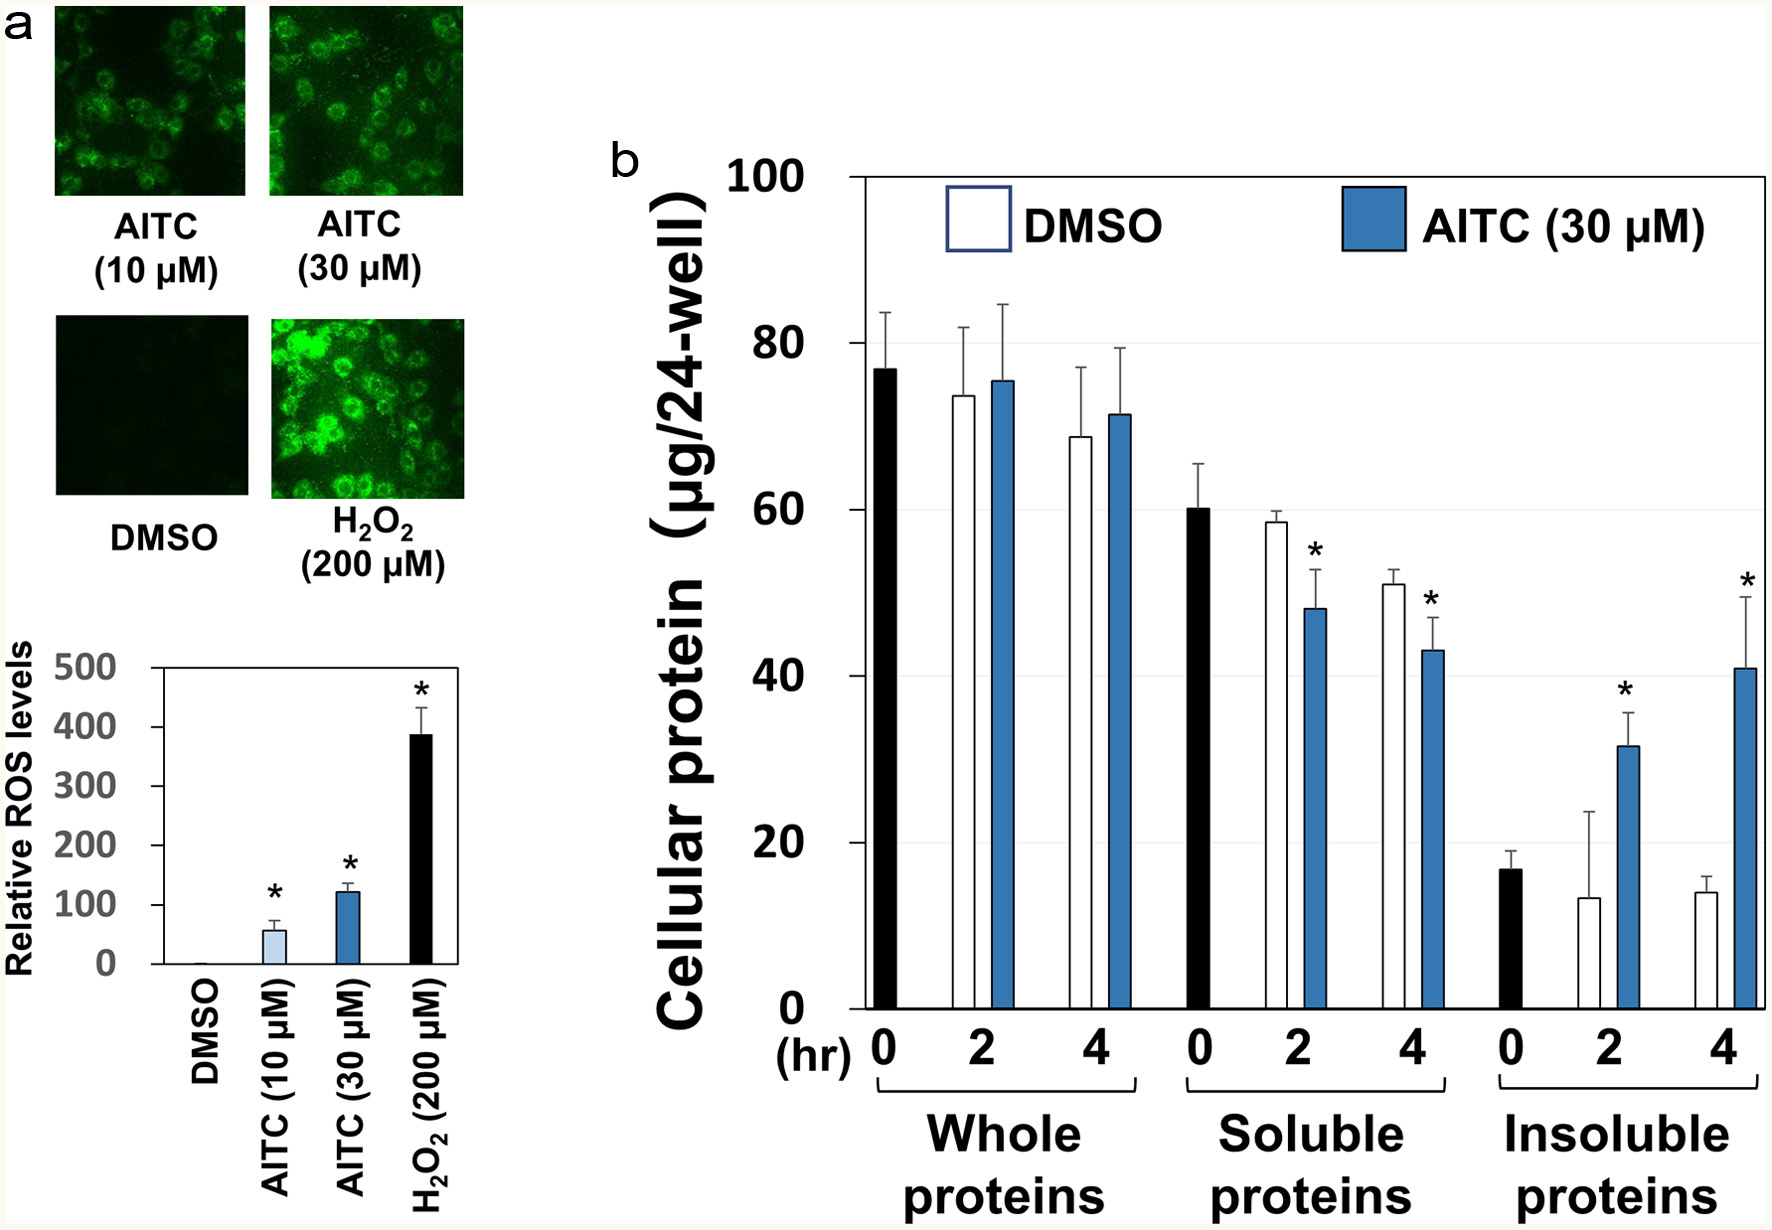
Figure 2. Oxidative stress and proteostress induced by AITC. Panel A, RGM1 cells (5 x 10⁵/mL), seeded on eight consecutive chamber slides, were exposed to DCFH-DA (10 µM) for 30 min. Then, each sample (10 or 30 µM AITC, 200 µM H2O2, 0.5% DMSO) was added and incubated for 30 min. After the chamber was removed, a coverslip was mounted with 50% glycerol/PBS and observed using a confocal laser microscope for detecting intracellular ROS generation. For semi-quantification, RGM1 cells (2 x 10⁵/200 µL) were preincubated on a 96-well black plate (clear bottom) overnight. After washing, DCFH-DA was added and incubated for 30 min. Then, the cells were washed, and each sample was added and incubated at 37°C for 30 min. After washing with PBS, the fluorescence of the media was measured at Ex505 nm and Em525 nm by a microplate reader. Panel B, after RGM1 cells (5 x 10⁵/mL) were precultured on a 24-well plate overnight, each sample (30 µM AITC or 0.5% DMSO) was added and incubated for 0, 2 or 4 hr. Then, the cells were washed and extracted with regular lysis buffer or high detergency lysis buffer (regular lysis buffer with 2% SDS) for soluble and whole protein determination, respectively, which was quantified by the BCA method. The amounts of insoluble proteins were estimated by subtracting those of the soluble proteins from the whole ones. The data are shown by means ± SD (n = 3), *p < 0.05 versus DMSO by Student’s t-test.
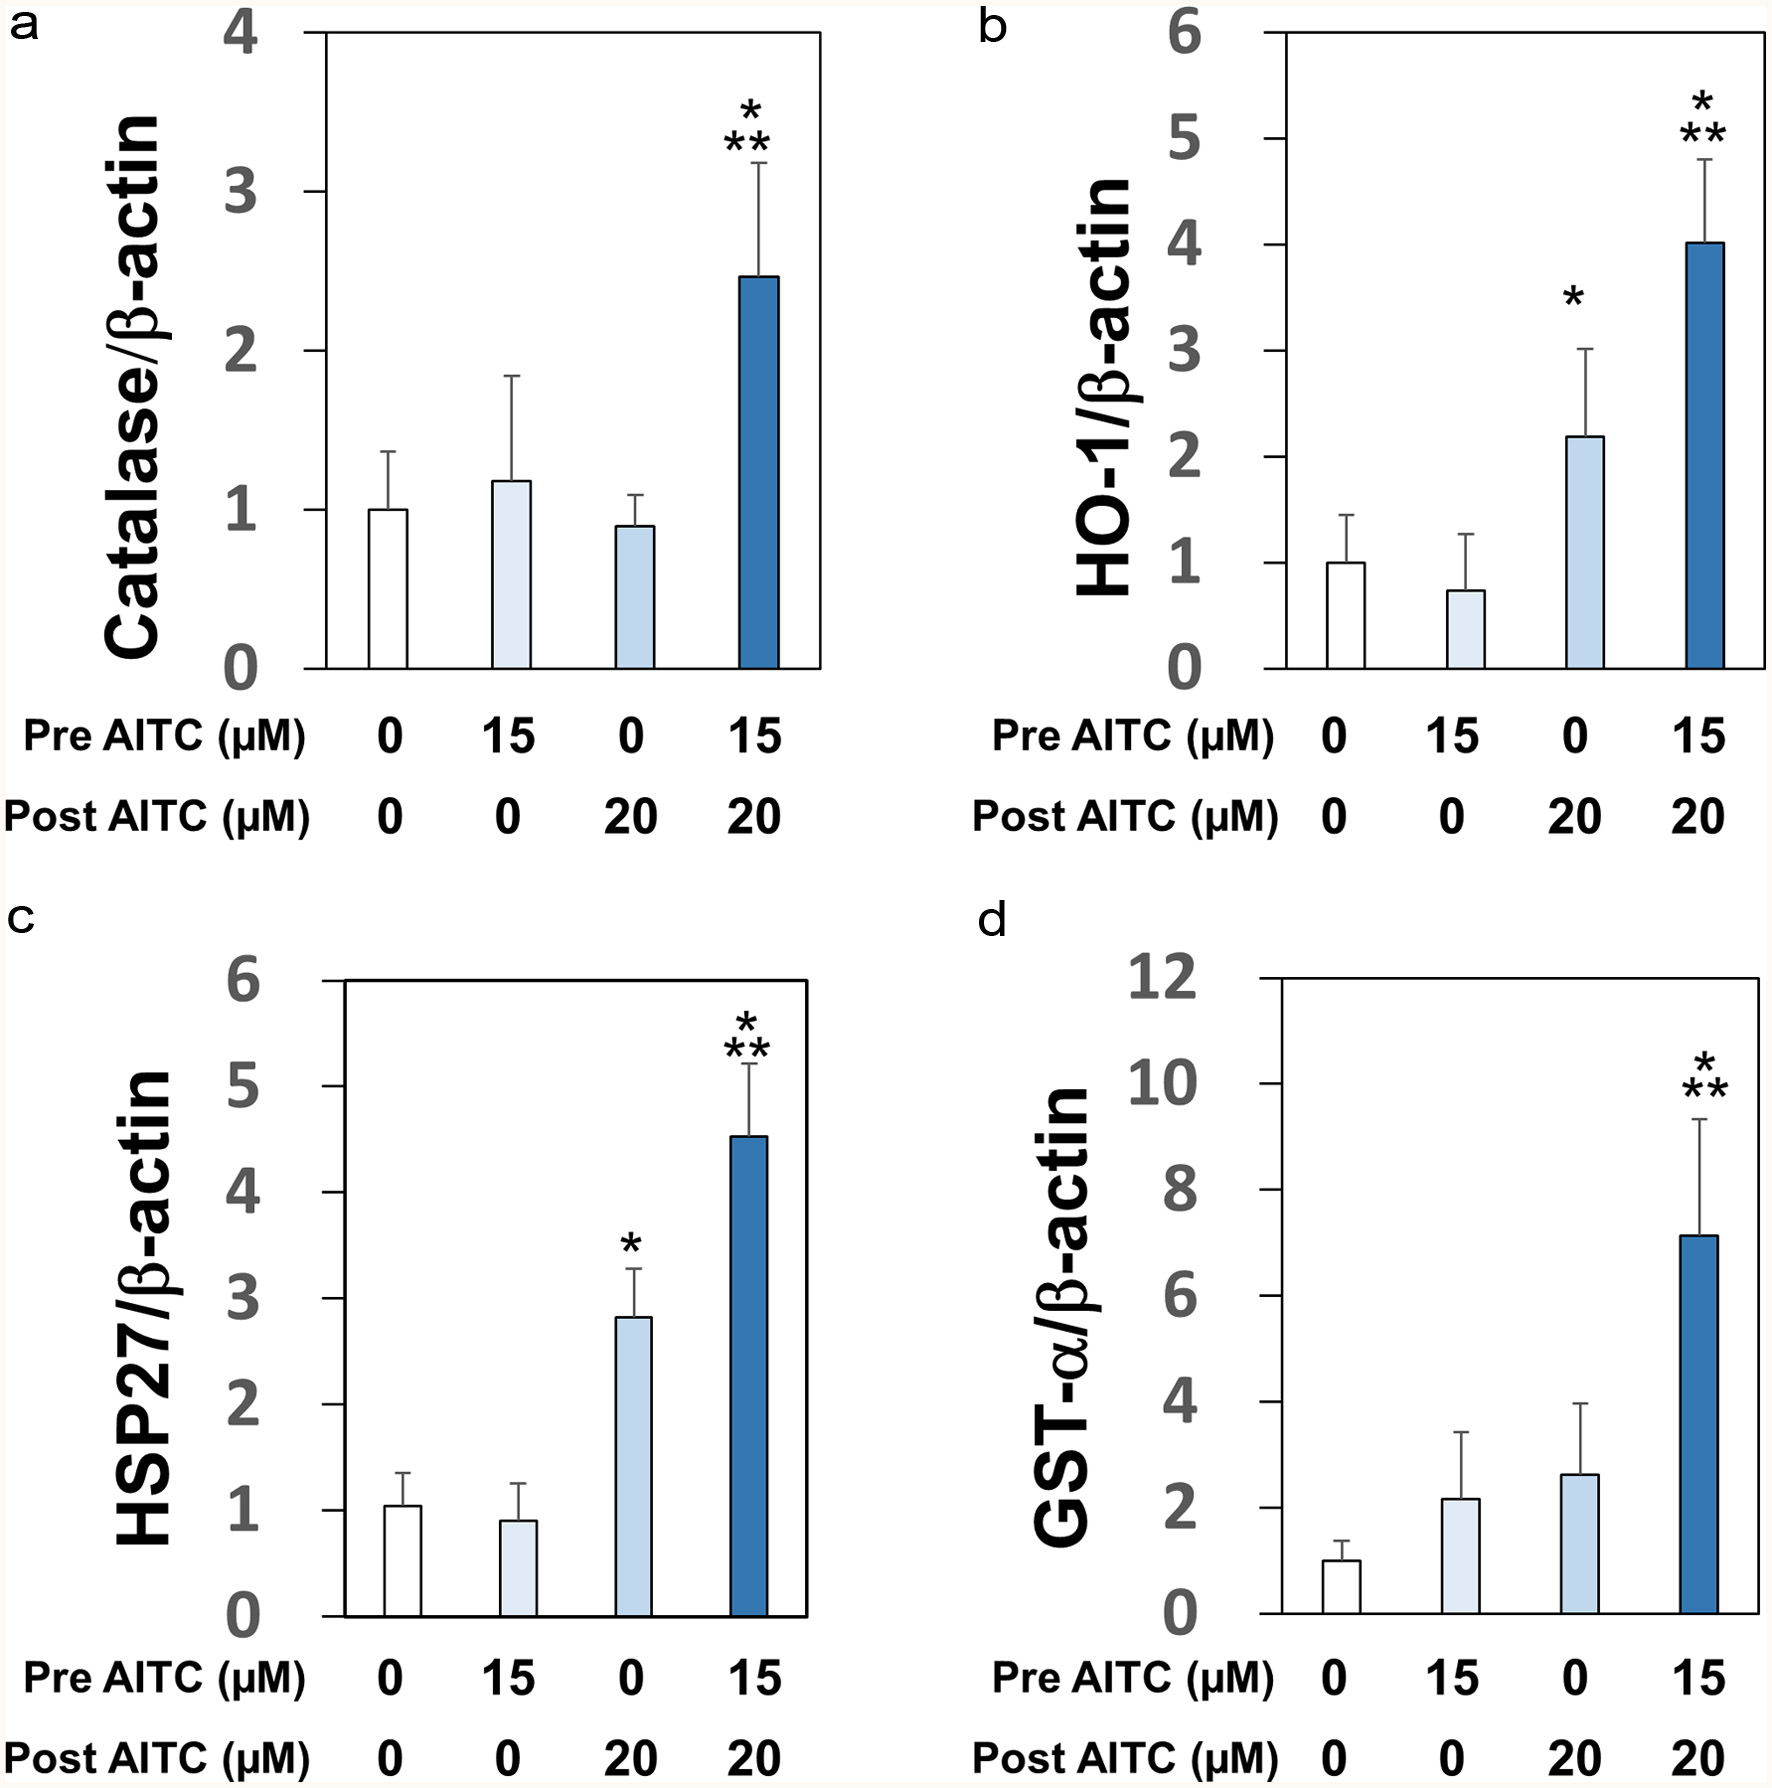
Figure 3. Upregulations of mRNA expression levels of self-defensive enzymes. RGM1 cells (1 x 10⁶/mL) preincubated on a 12-well plate overnight were exposed to AITC (0 or 15 μM), and incubated for 24 hr. After another washing, the cells were exposed to AITC (0 or 20 µM). cDNA was synthesized using total RNA (1 µg). PCR was performed with a sense- and antisense-primer for catalase (Panel A), HO-1 (Panel B), HSP27 (Panel C), GST-α (Panel D), and β-actin (internal standard). The data are shown by means ± SD (n = 4), *p < 0.05 versus vehicle, **p < 0.05 versus post AITC (20 μM) by Student’s t-test.
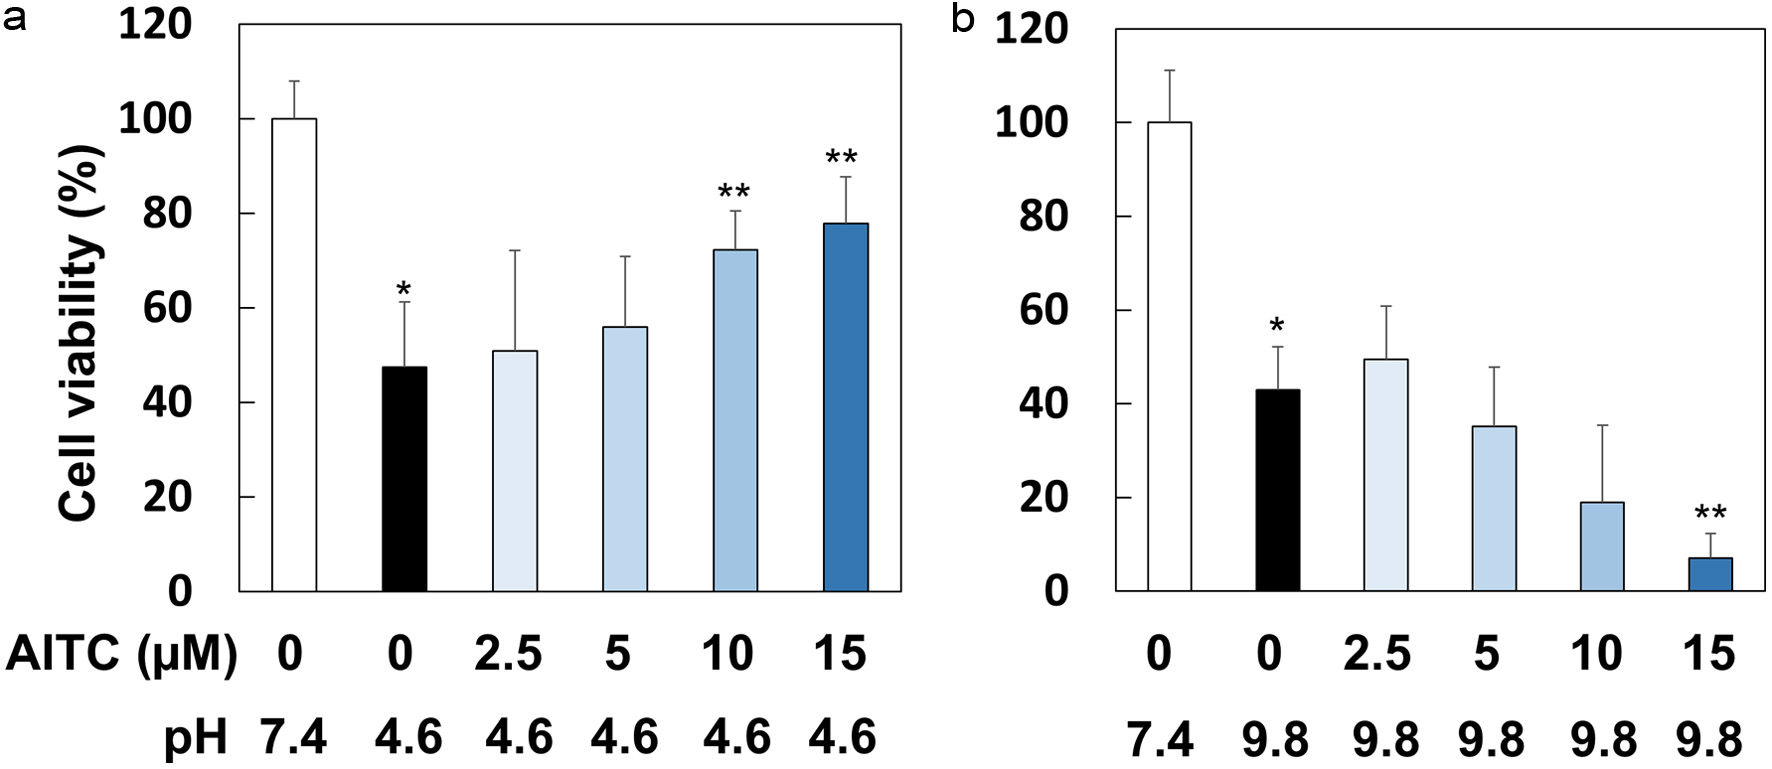
Figure 4. AITC protected RGM1 cells from acidic but not alkaline stress conditions. RGM1 cells (2 x 10⁵/200 μL) were preincubated on 96-well plate overnight. After washing, they were pretreated with AITC (0, 2.5, 5, 10 and 15 μM) for 1 hr, and then the media were replaced by FBS-free DMEM, in which pH was adjusted to 7.4, 4.6, or 9.8, followed by incubation for 1 hr. Then, the media were replaced to FBS-free DMEM (pH 7.4) followed by a 24 hr-incubation. The data are shown by means ± SD (n = 6–8), *p < 0.01 versus pH 7.4, **p < 0.05 versus AITC (0 µM), pH 4.6 or pH 9.8 by Student’s t-test.
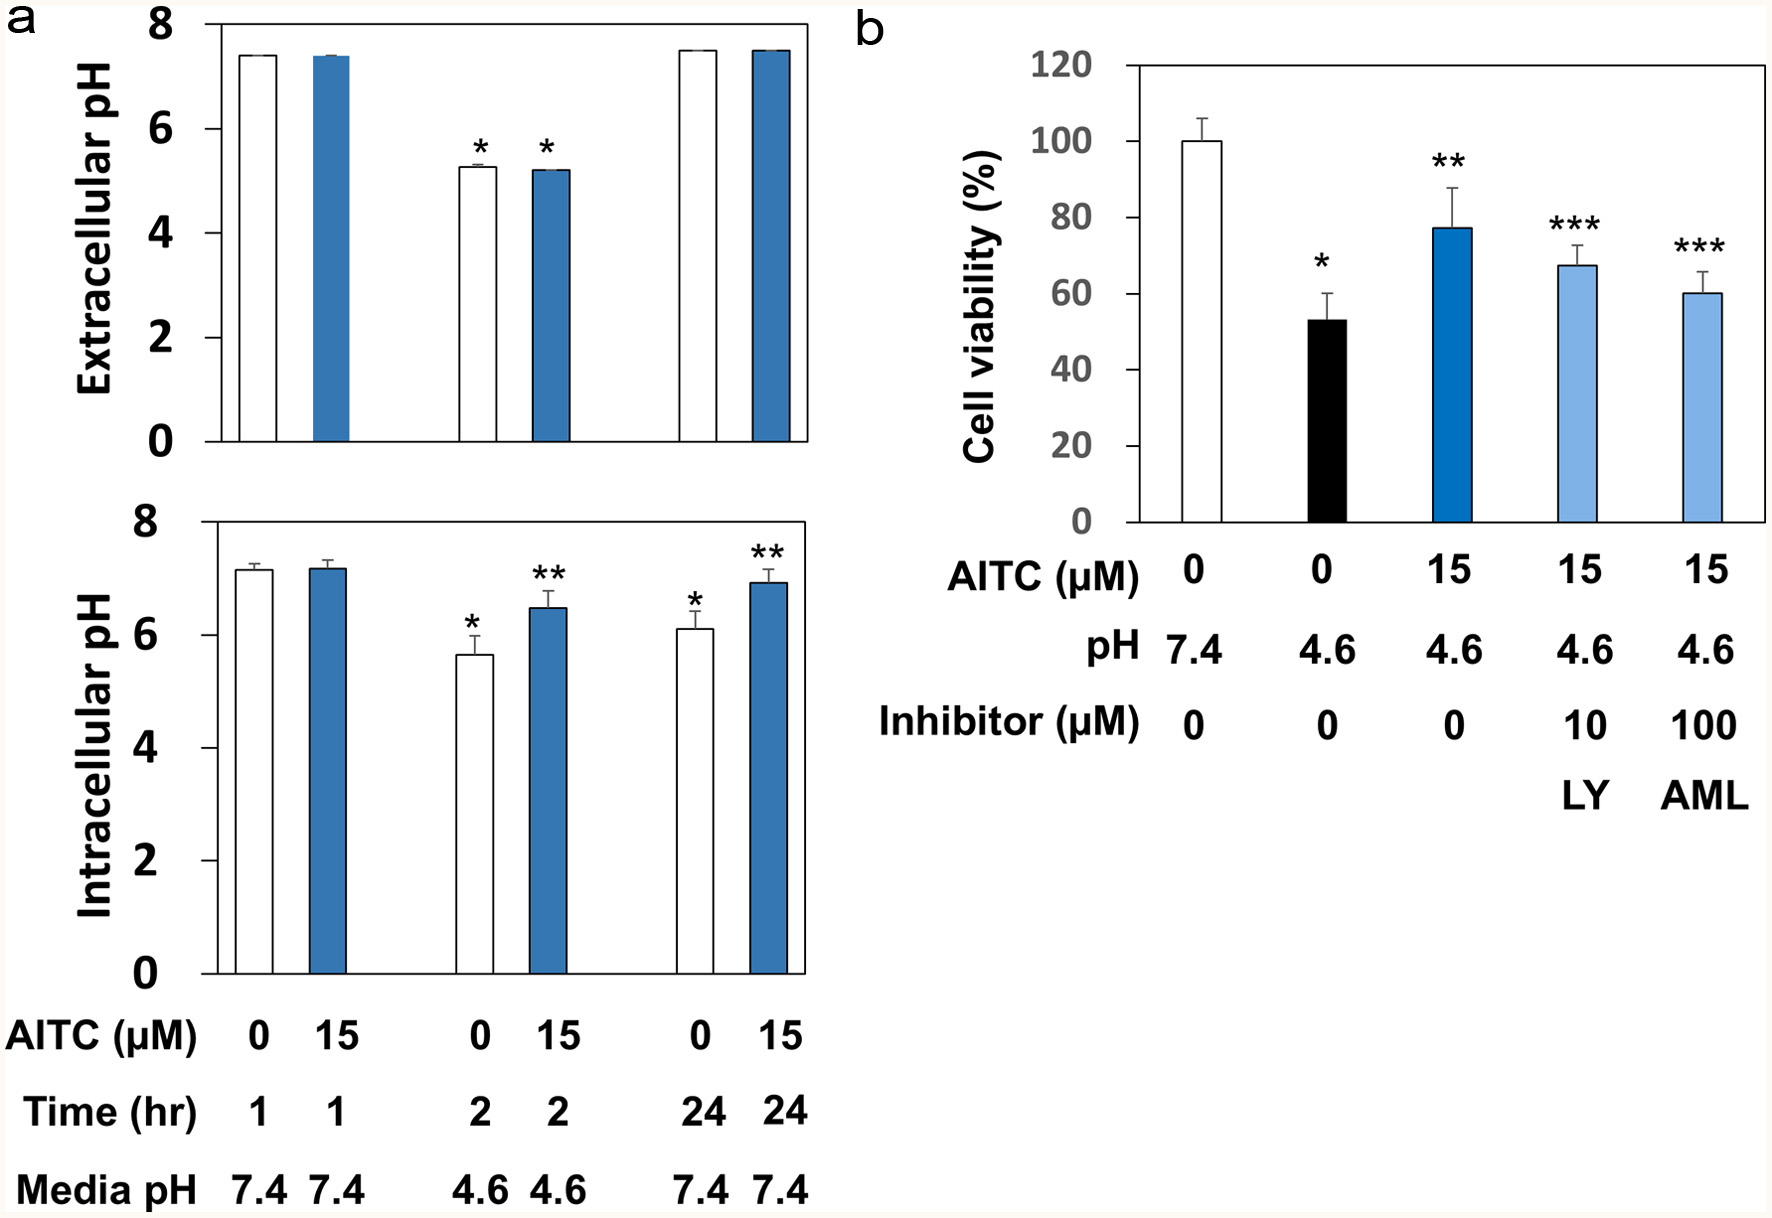
Figure 5. AITC regulated the intracellular pH possibly by targeting PI3K and NHE. Panel A, for extracellular pH measurement, RGM1 cells (1 x 10⁶/mL) were preincubated on a 24-well plate overnight. After washing, the cells were pretreated with AITC (0 or 15 μM) for 1 hr. Then, the media were replaced by FBS-free DMEM, in which the pH was adjusted to 7.4, 4.6, or 9.8. After incubation for 1 hr, the pH of medium was measured. For intracellular pH determination, RGM1 cells (2 x 10⁵/200 μL) were preincubated on a 96-well black plate (clear bottom) overnight. After washing, FBS-free DMEM containing BCECF-AM (final concentration: 5 μM) was added and the cell were incubated for 30 min. After washing, the fluorescence of the media was measured at Ex490 and Em535 nm. The data are shown by means ± SD (n = 4), *p < 0.05 versus pH 7.4, 1 hr, **p < 0.05 versus AITC (0 µM), 2 hr or 24 hr by Student’s t-test. Panel B, RGM1 cells (2 x 10⁵/200 μL) were preincubated on a 96-well plate overnight. After washing, the cells were pretreated with the vehicle, LY294002 (10 μM, PI3K inhibitor), or amiloride (100 μM, NHE inhibitor) for 30 min and then exposed to AITC (15 μM) for 1 hr. After washing, the media were replaced by FBS-free DMEM, in which the pH was adjusted to 4.6, and the cells were incubated for 1 hr. After washing the cells, the media were replaced with FBS-free DMEM (pH 7.4) followed by a 24 hr-incubation. Cell viability was determined as described above. The data are shown by means ± SD (n = 4), *p < 0.05 versus pH 7.4, **p < 0.05 versus AITC (0 µM), pH 4.6, ***p < 0.05 versus AITC (15 µM), pH 4.6 by Student’s t-test. LY, LY294002 (PI3K inhibitor); AML, amiloride (NHE inhibitor).
Table
Table 1. Primers used for RT2-PCR
| Gene | Primer | Sequence (5′-3′) |
|---|
| Catalase | Sense | CCCAGAAGCCTAAGAATGCAA |
| Antisense | TCCCTTGGCAGCTATGTGAGA |
| HO-1 | Sense | CGTGCAGAGAATTCTGAGTTC |
| Antisense | AGACGCTTTACGTAGTGCTG |
| HSP27 | Sense | GGCAAGCACGAAGAAAGG |
| Antisense | GATGGGTAGCAAGCTGAAGG |
| GST-α | Sense | CTGCAGCAGGGGTGGA |
| Antisense | CTCTCTCCTTCATGTCCTTCC |
| β-actin | Sense | CGTCATACTCCTGCTTGCTG |
| Antisense | GTACGCCAACACAGTGCTG |