Figures
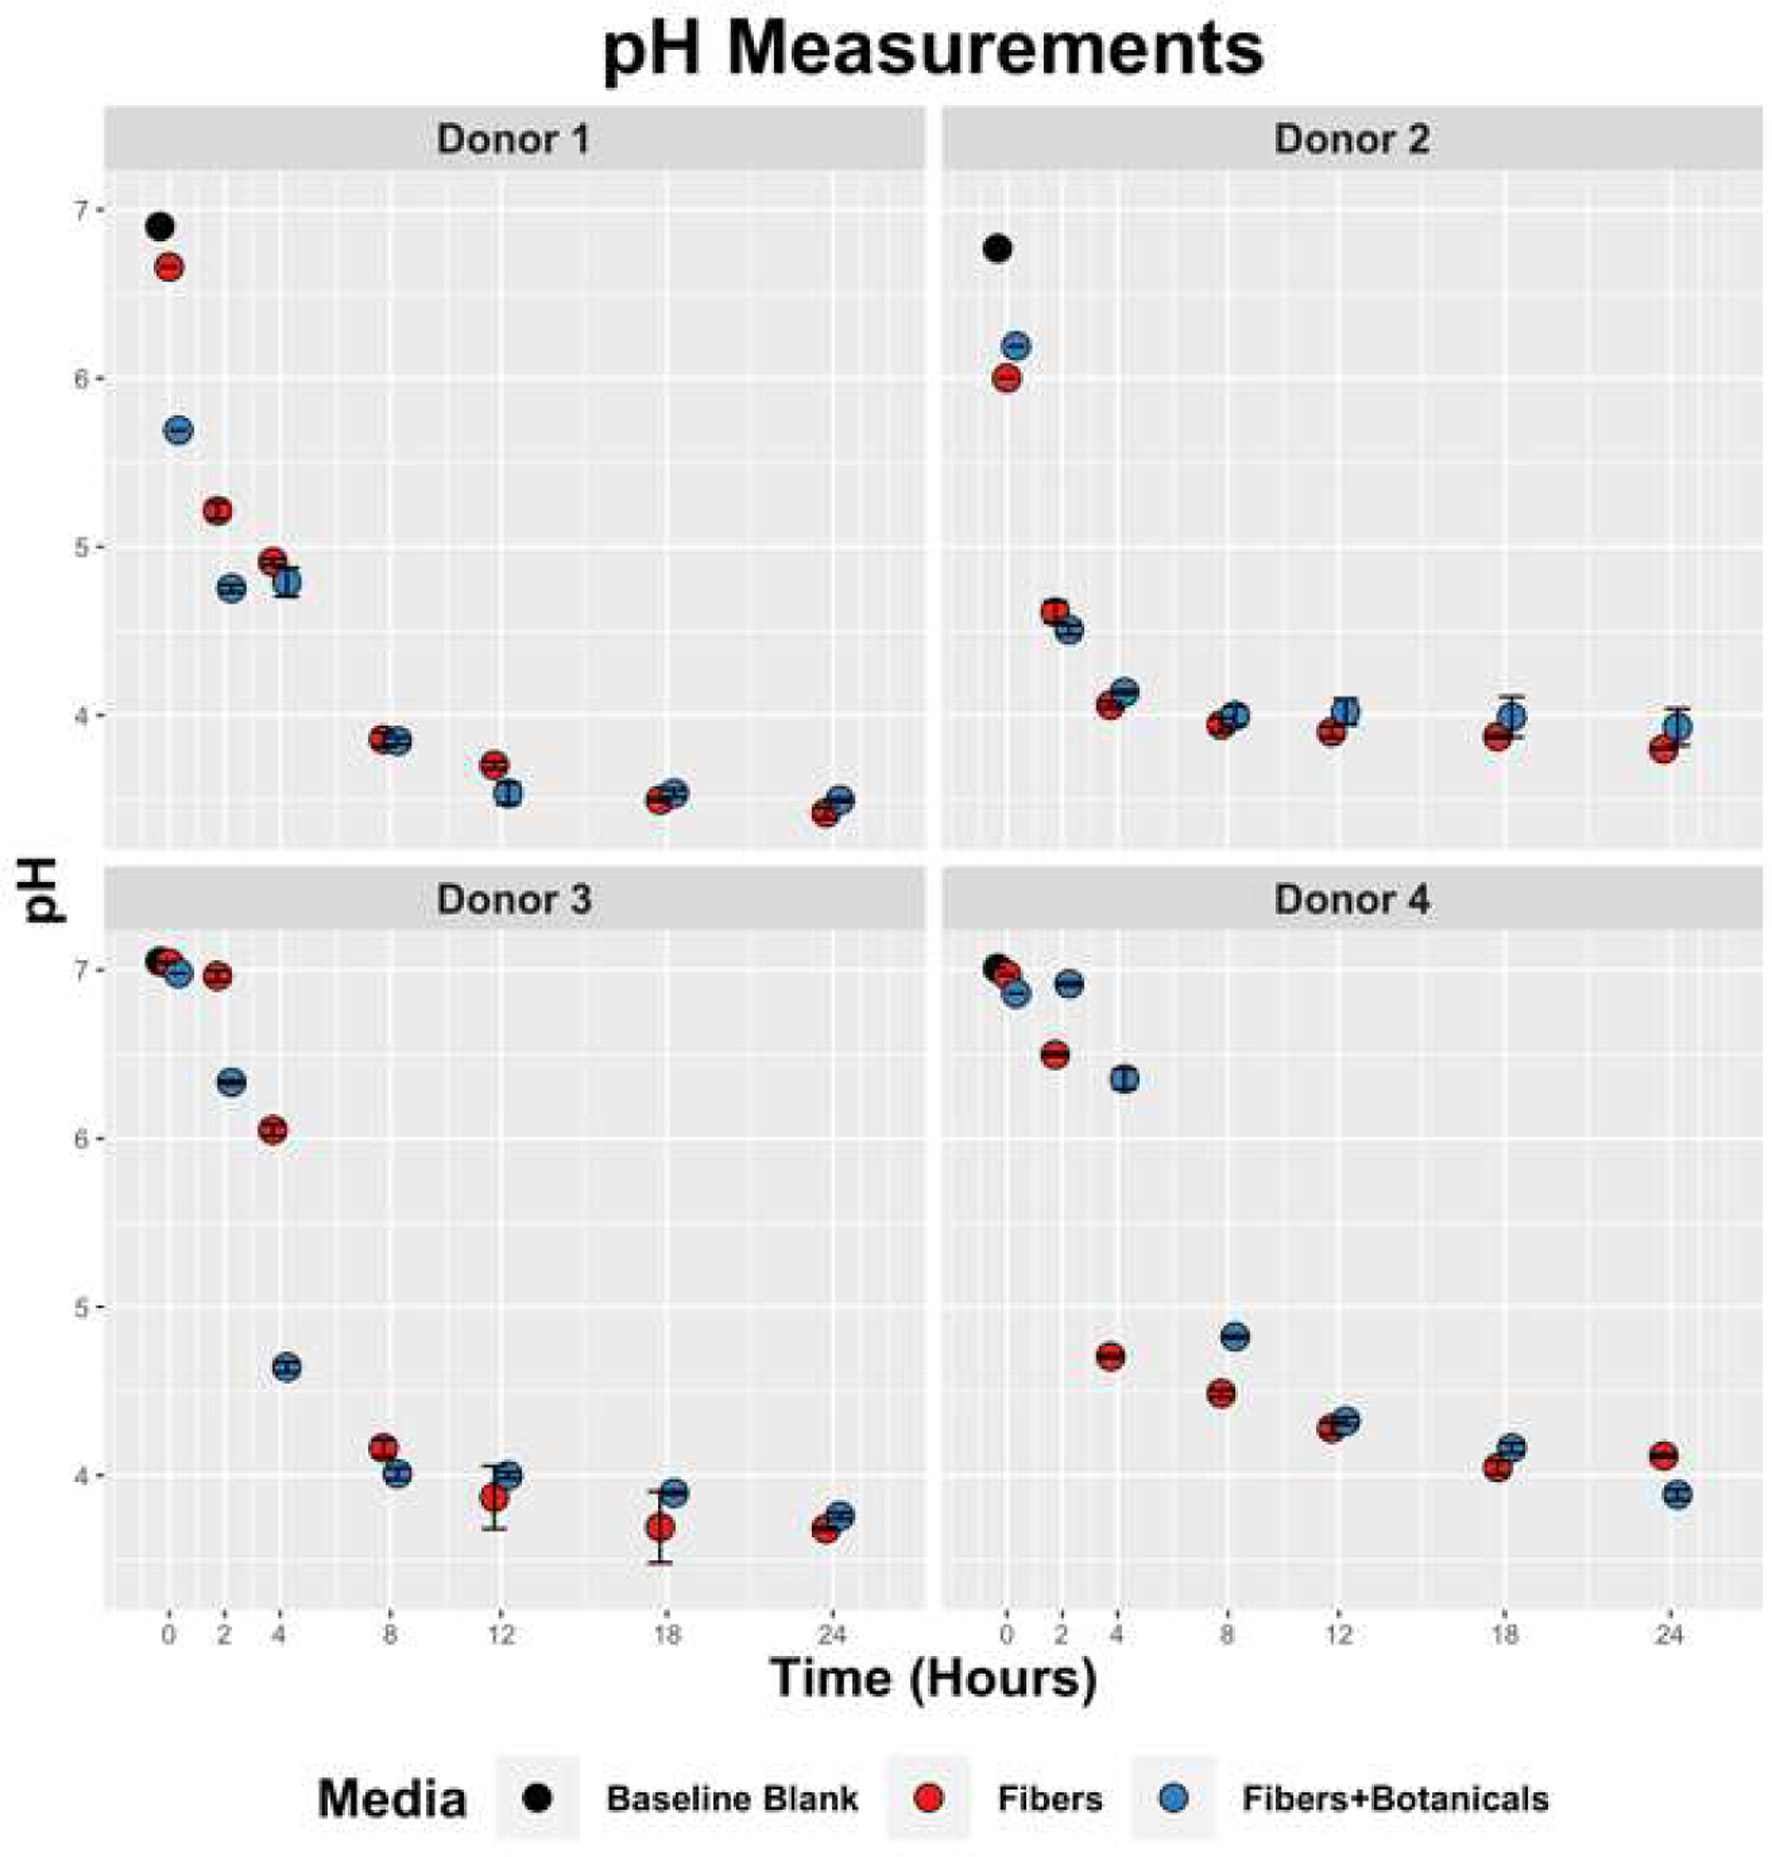
Figure 1. Temporal pH reduction by fecal slurries containing OLISMART fibers or OLISMART fibers supplemented with botanicals.

Figure 2. SCFAs concentrations in baseline controls and fiber fermentations with or without added botanicals. Statistically significant differences are calculated by pairwise t-tests with p < 0.05. Symbol style: p-value < 0.05 (*). Asterisk (*) above specific timepoints (x-axis) indicates statistical significance for timepoint; asterisk (*) in top right corner of panel indicates statistical significance at every timepoint for the donor-acid combination.
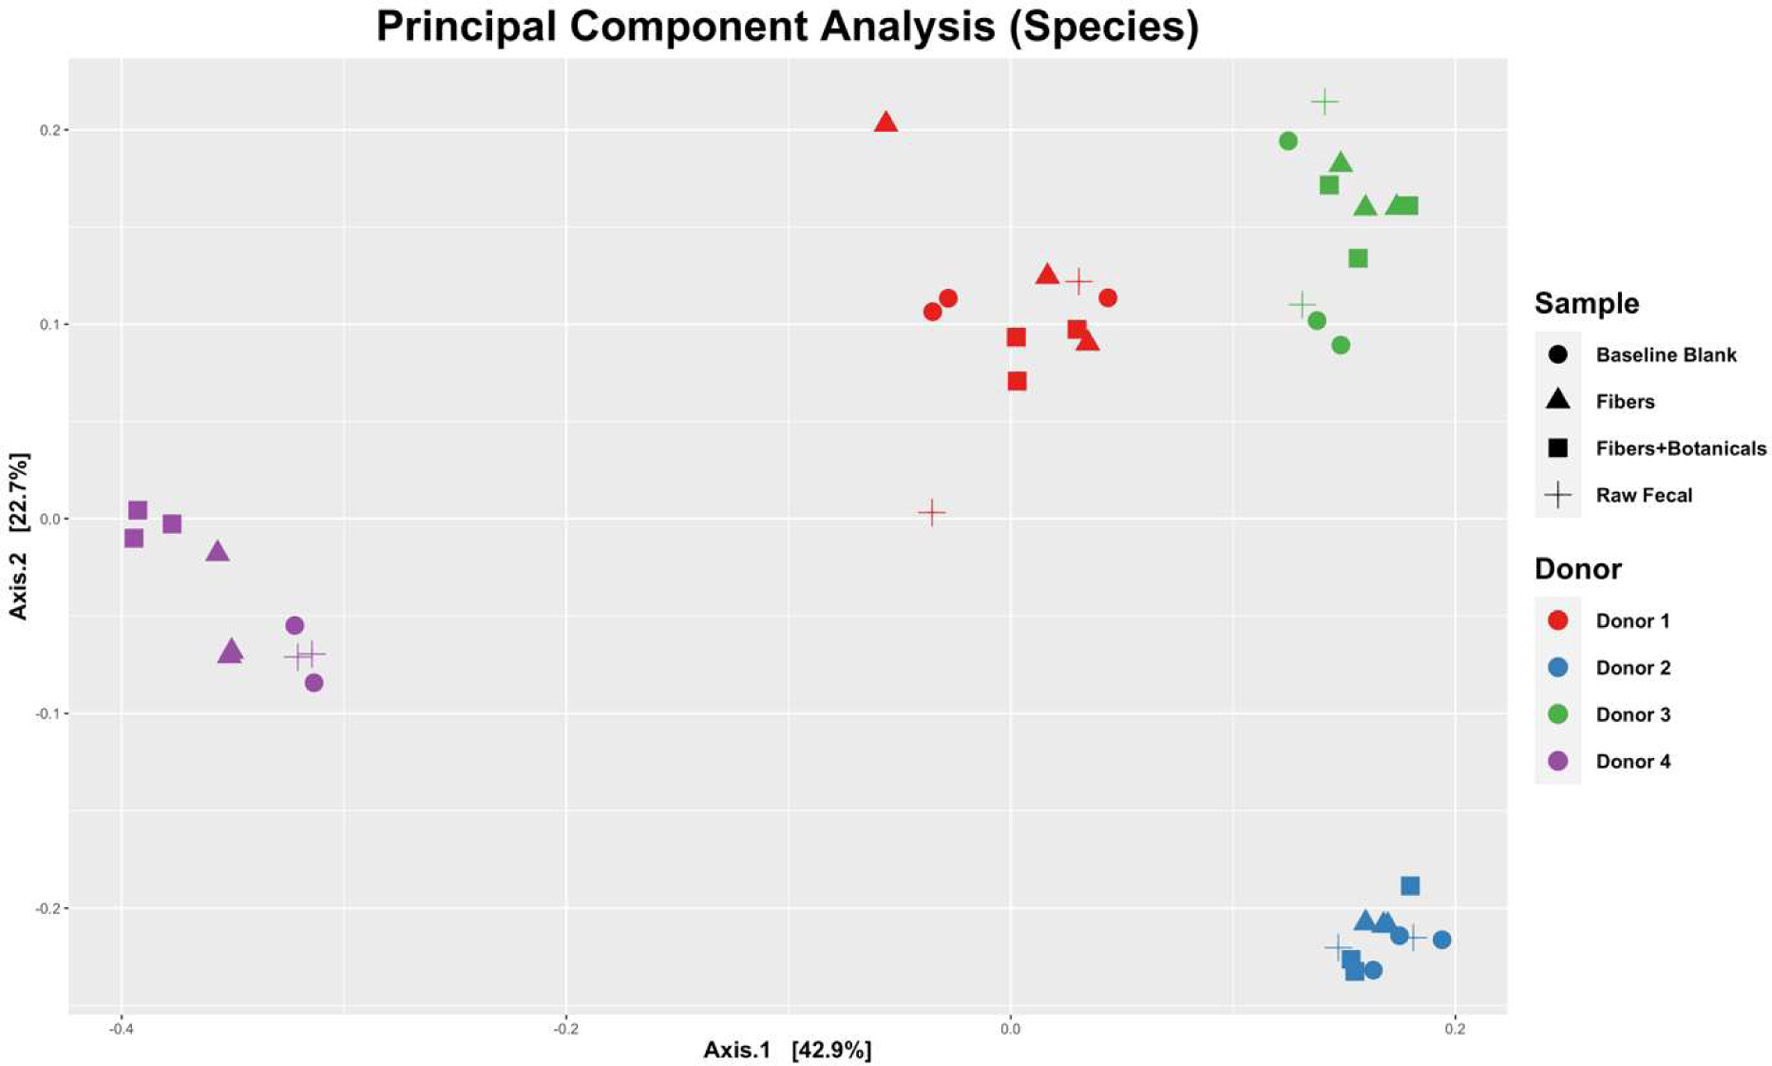
Figure 3. Principal components of analysis (PCoA) plot displaying UniFrac beta-diversity relationships among fecal samples, controls, and fermentations by donors.
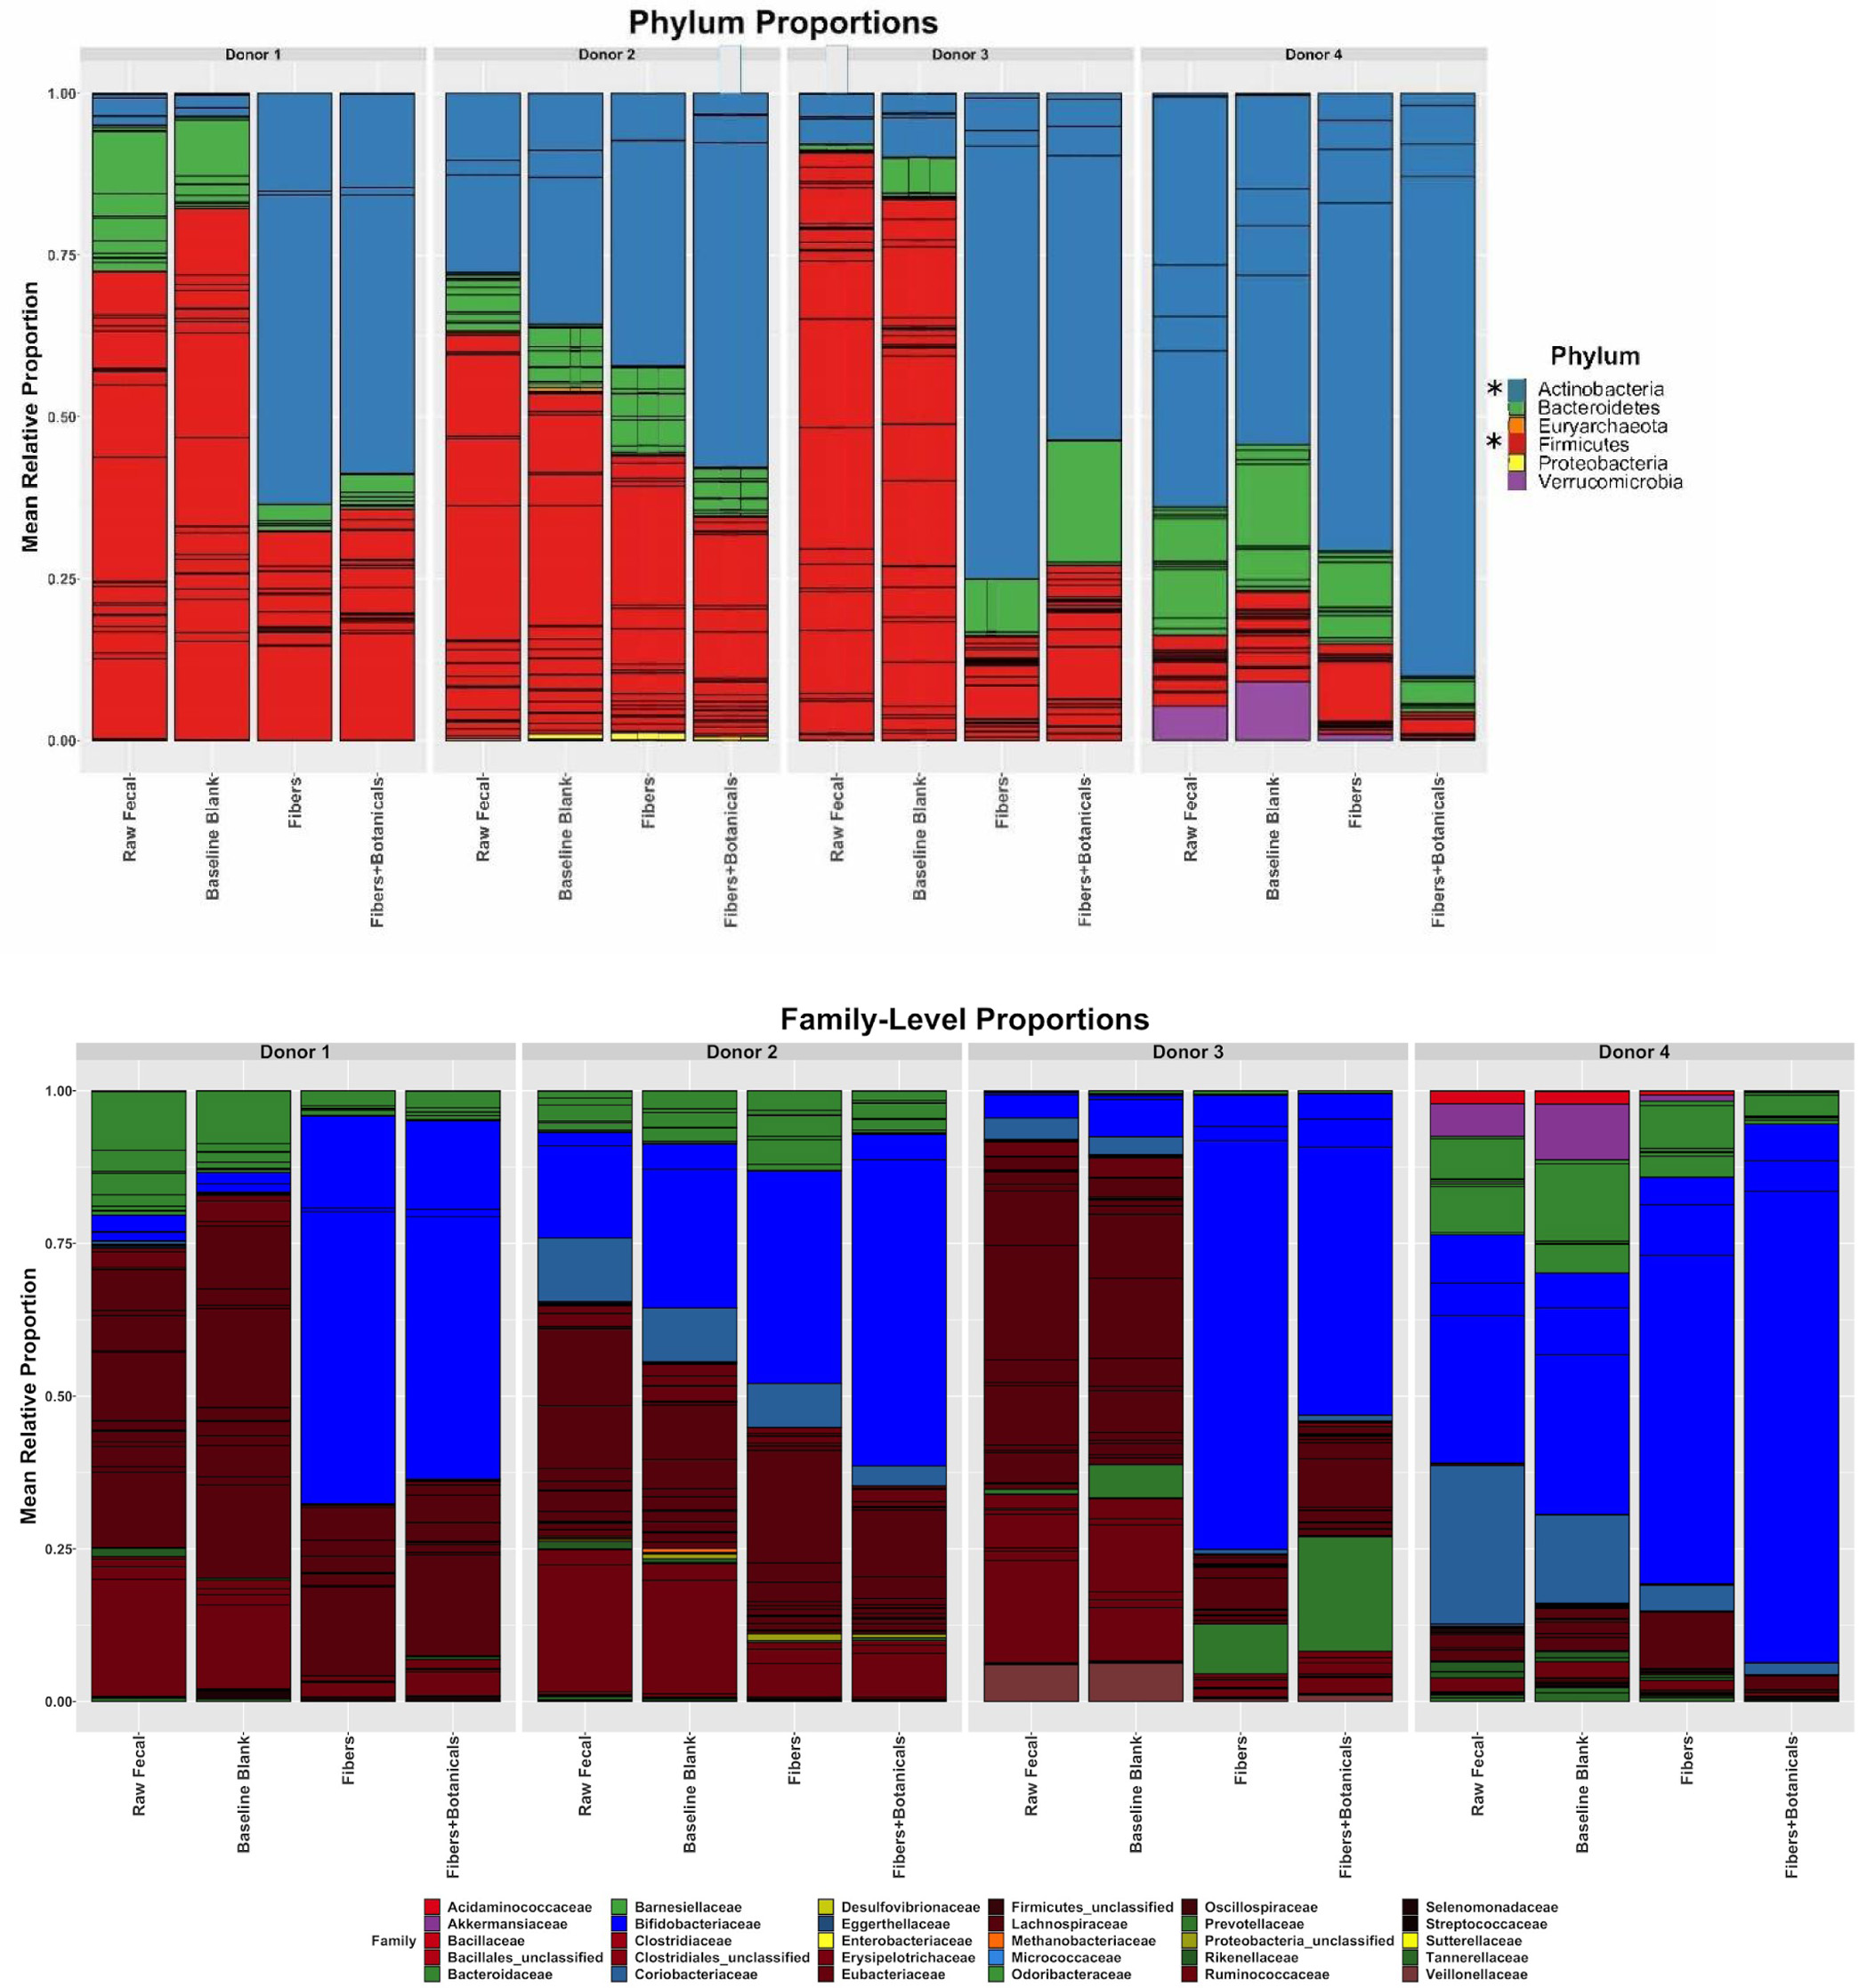
Figure 4. Relative abundances of metagenomic reads from fecal samples, baseline blanks, and fermentations, assigned by bacterial families. Individual OTUs are represented by the internal bars within a family’s color. An asterisk (*) beside legend symbols in panel A denotes significant donor condition effects (p < 0.001, ANOVA) in the same time-dependent direction for all 4 donors.
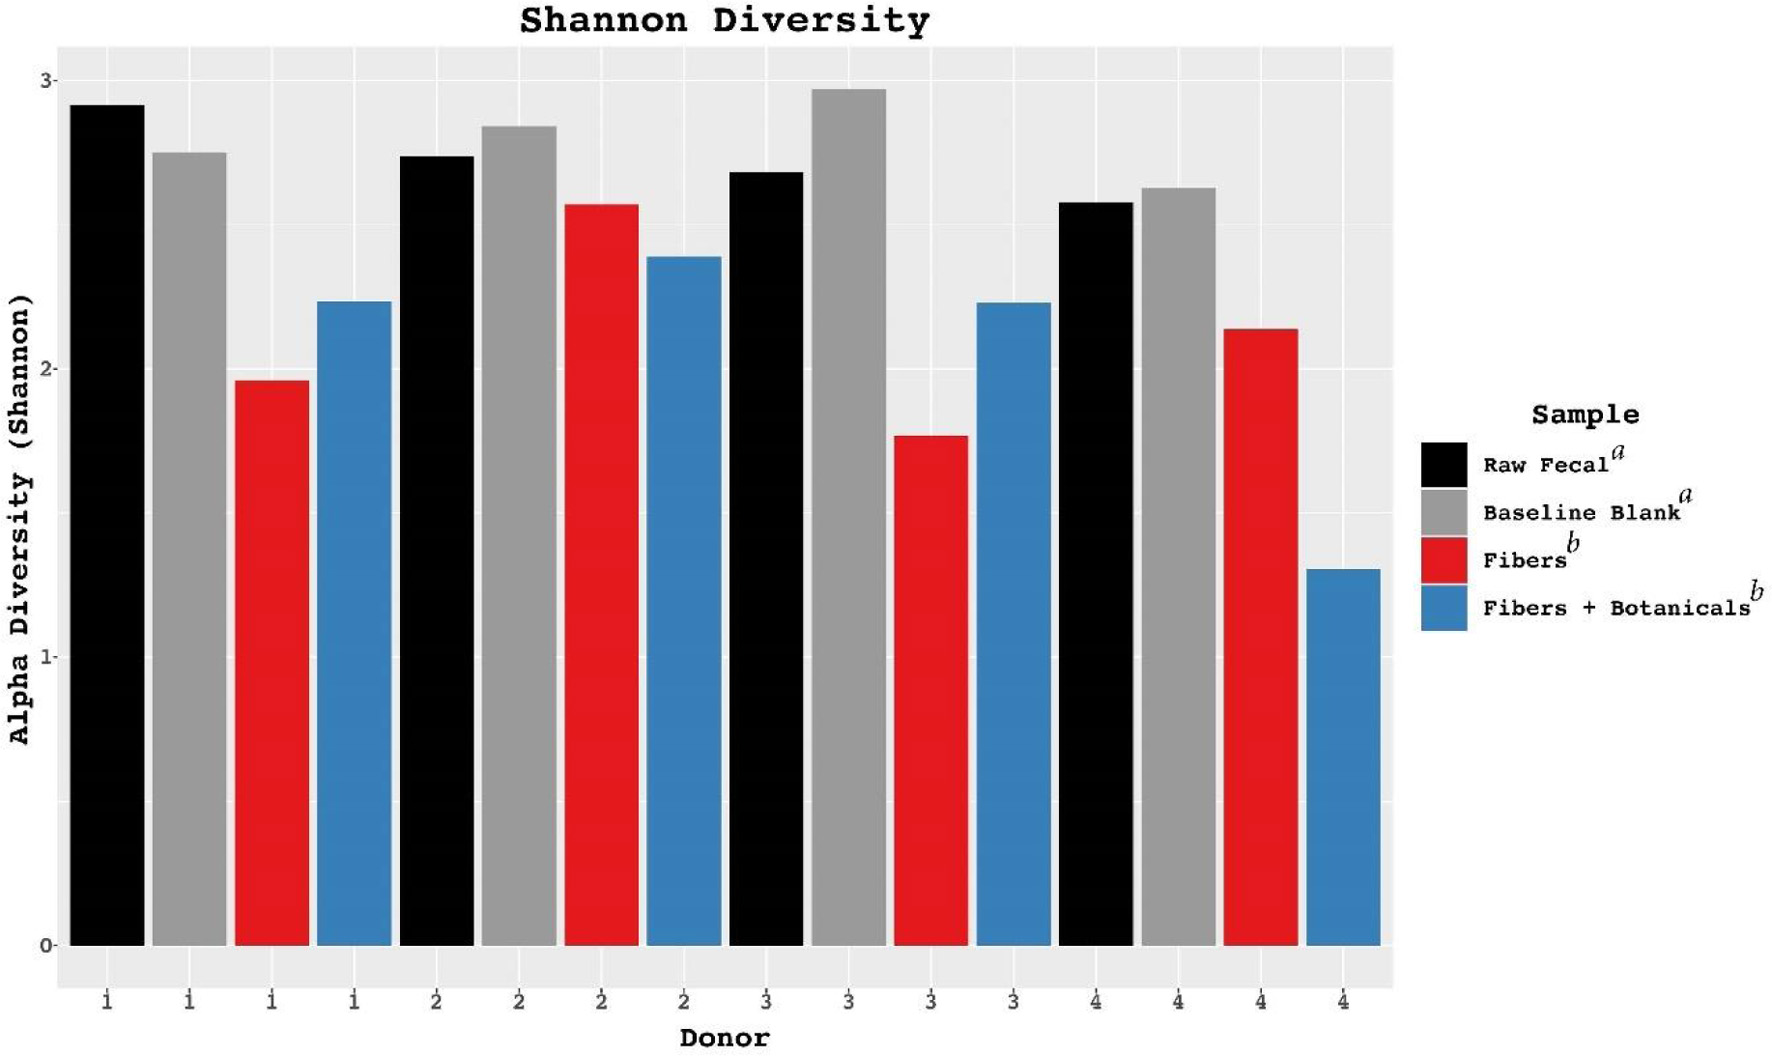
Figure 5. Alterations in Shannon diversity across donors in controls and fermentations compared with fecal samples. Letters a and b in the figure legend represent significantly different groups based on ANOVA results.
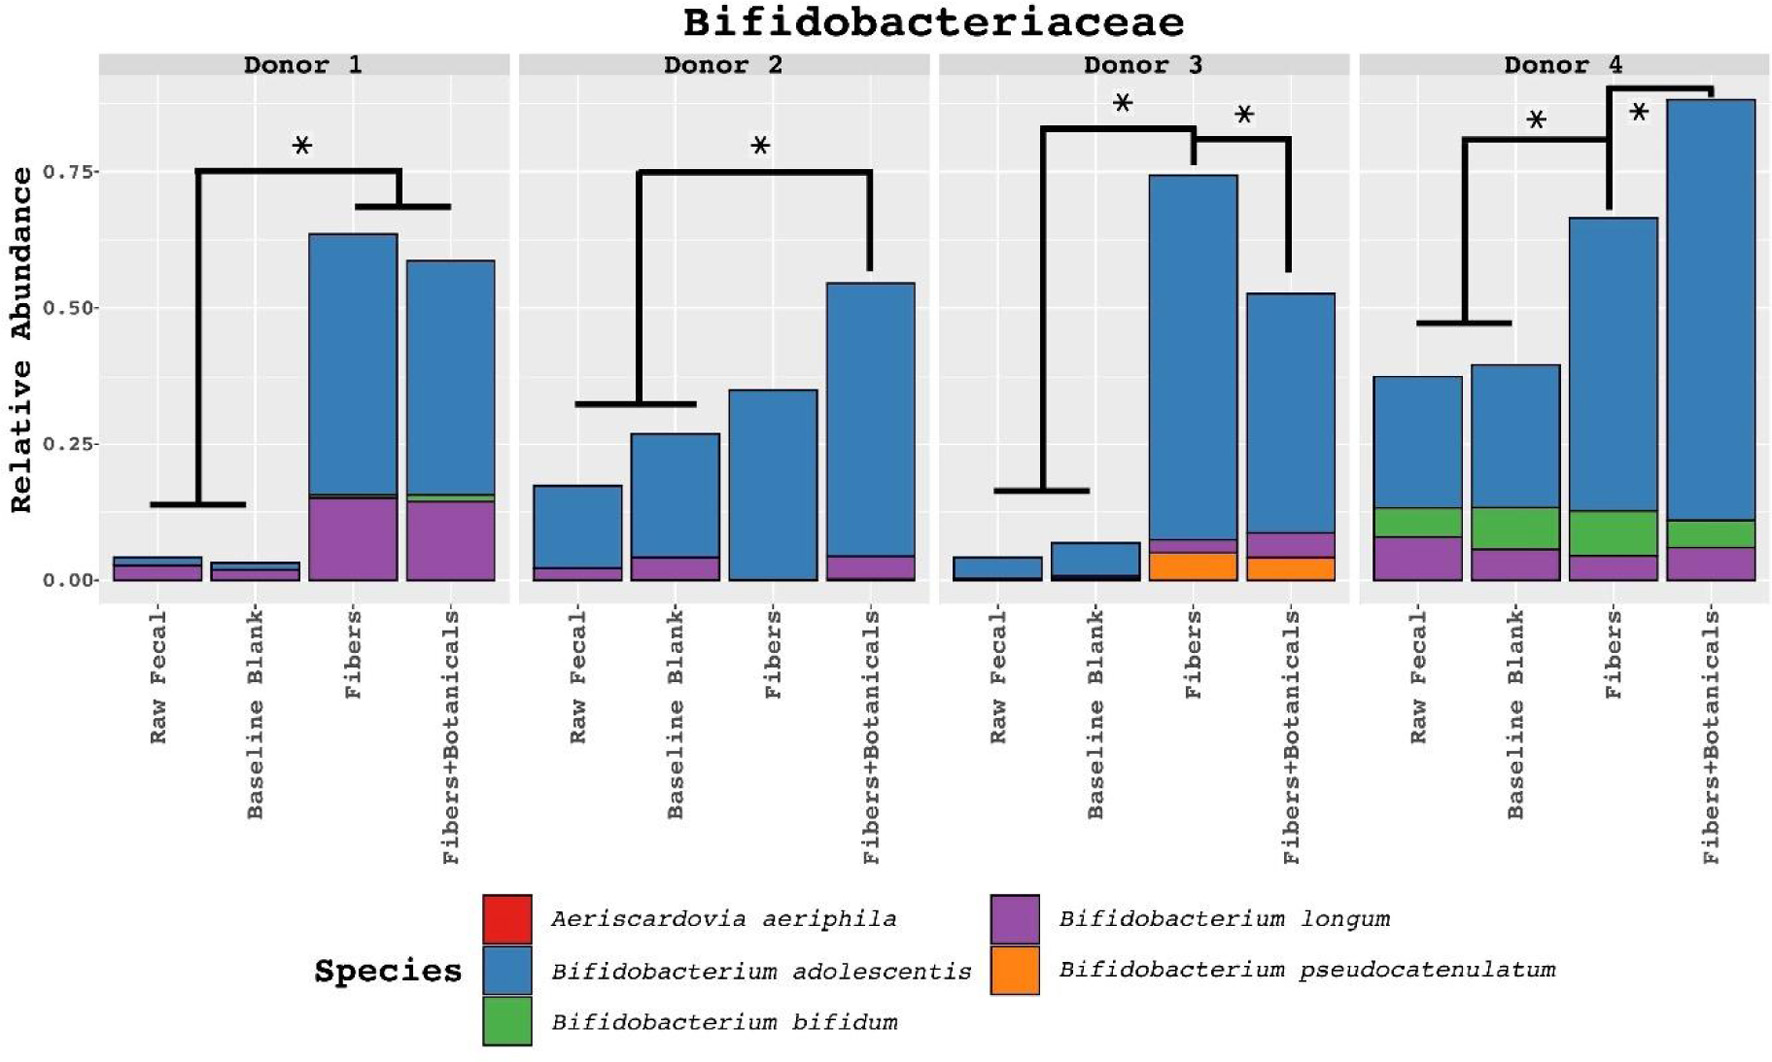
Figure 6. Relative abundances of metagenomic reads derived from fecal samples, controls, and fermentations assigned to family Bifidobacteriaceae and classified to the species level. Colored boxes in top-left of each facet represents significant fiber-dependent abundance increase on the species level. Statistically significant differences determined by ANOVA pairwise comparisons test (read-count as dependent and media type as the independent variable, split by donor) with p < 0.001. Symbol style: p-value < 0.001 (*).