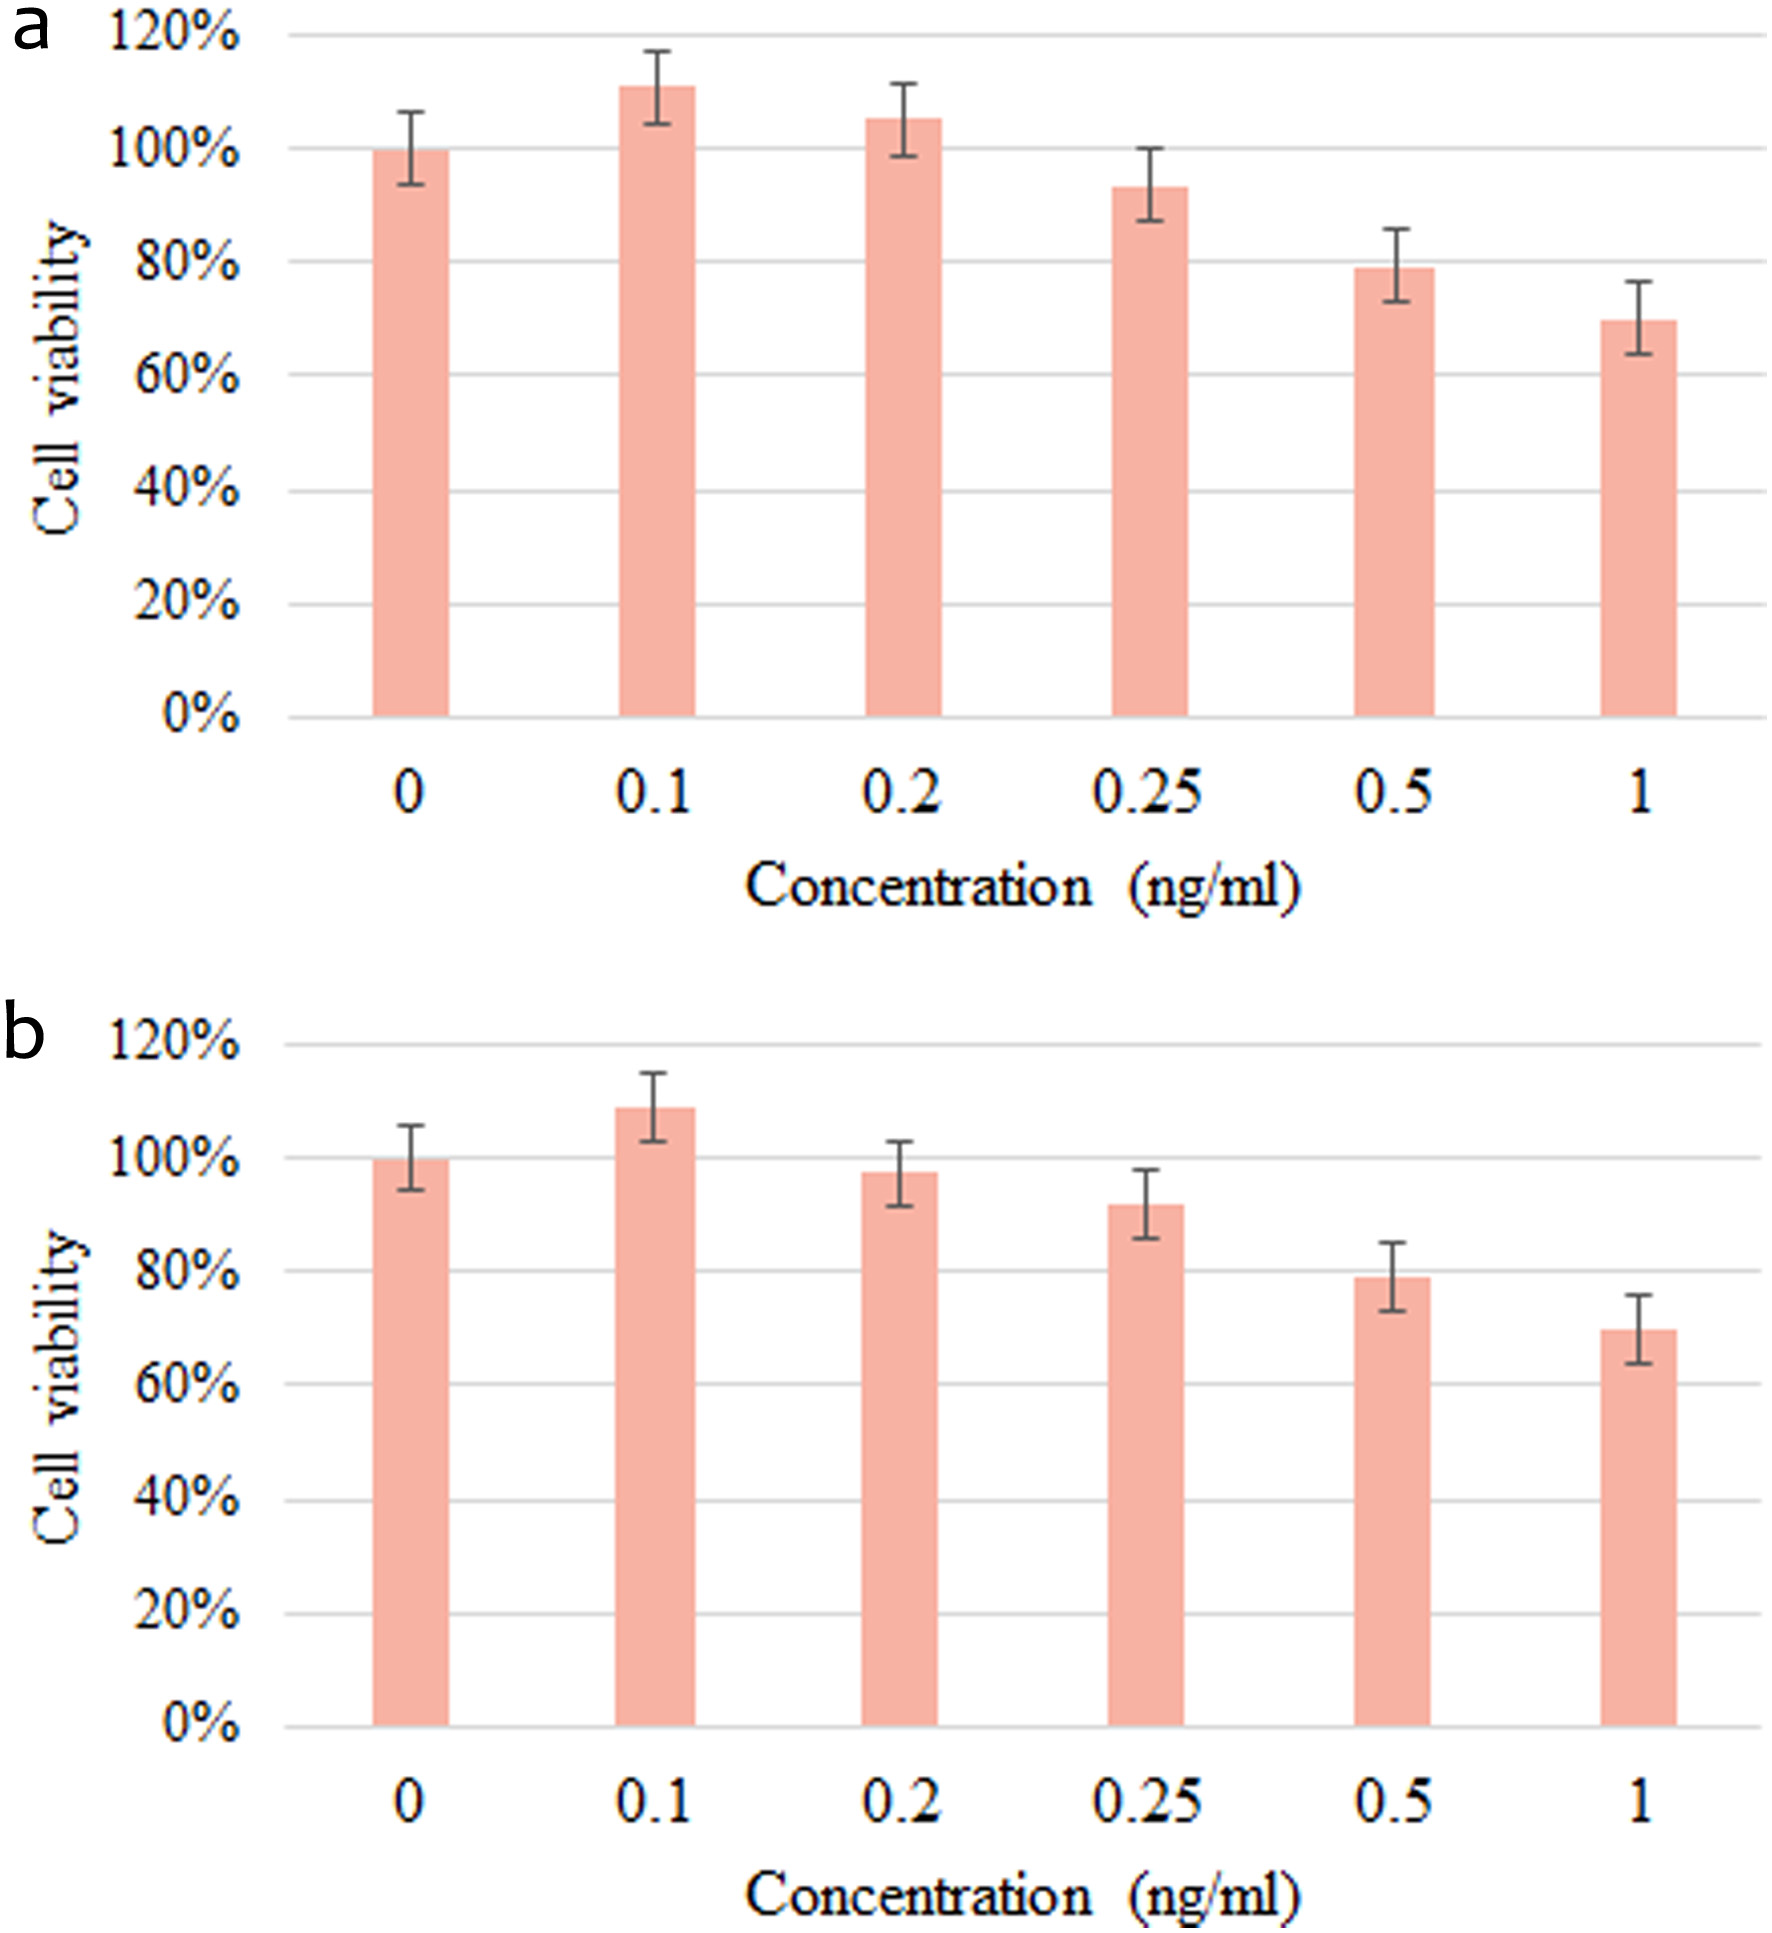
Figure 1. The effect of supplement on the survival rate of a) 3T3-L1 preadipocytes; b) 3T3-L1 mature adipocytes. Values are expressed as mean ± SD
| Journal of Food Bioactives, ISSN 2637-8752 print, 2637-8779 online |
| Journal website www.isnff-jfb.com |
Original Research
Volume 30, June 2025, pages 47-56
The effect of L-carnitine and catechin together with calories restriction on the reduction of body fat and blood lipids
Figures
Tables
| Control group (n = 15) | Supplement group (n = 15) | |
|---|---|---|
| Average age and height data represent as Mean ± SD for each group. | ||
| Gender | ||
| Male | 6 | 6 |
| Female | 9 | 9 |
| Age (years) | ||
| 20–29 | 3 | 4 |
| 30–39 | 3 | 3 |
| 40–49 | 4 | 3 |
| 50–59 | 4 | 3 |
| 60 above | 1 | 2 |
| Average age | 43.60 ± 15.02 | 41.13 ± 15.65 |
| Height (cm) | 164.53 ± 9.23 | 164.20 ± 8.87 |
| Week 0 | Week 4 | Week 8 | Week 12 | Follow-up | |
|---|---|---|---|---|---|
| Values are expressed as Mean ± SD. *Significant difference (p < 0.05) compared with week 0 within the same group. | |||||
| Total energy (Kcal) | |||||
| Control group | 1,883.03 ± 429.18 | 1,617.23 ± 551.72* | 1,656.73 ± 652.35* | 1,650.52 ± 723.26* | 1,629.54 ± 555.82* |
| Supplement group | 1,922.27 ± 608.06 | 1,684.00 ± 454.24* | 1,657.87 ± 348.50* | 1,630.34 ± 329.81* | 1,622.76 ± 419.98* |
| Protein (%) | |||||
| Control group | 16.10 ± 1.92 | 17.55 ± 4.20 | 17.65 ± 3.96 | 17.58 ± 3.10 | 17.59 ± 2.63 |
| Supplement group | 16.20 ± 2.15 | 17.48 ± 3.08 | 17.40 ± 3.21 | 17.09 ± 2.78 | 16.92 ± 3.29 |
| Lipid (%) | |||||
| Control group | 39.07 ± 9.22 | 41.30 ± 10.96 | 40.67 ± 10.34 | 39.50 ± 7.77 | 38.08 ± 7.59 |
| Supplement group | 38.88 ± 8.25 | 39.23 ± 8.24 | 40.62 ± 7.18 | 41.83 ± 6.88 | 39.88 ± 8.04 |
| Carbohydrate(%) | |||||
| Control group | 42.57 ± 10.55 | 38.30 ± 12.68* | 39.30 ± 10.56* | 40.88 ± 9.01* | 42.29 ± 9.21* |
| Supplement group | 42.91 ± 8.42 | 41.23 ± 8.54* | 40.01 ± 9.01* | 39.11 ± 8.11* | 41.20 ± 9.44* |
| Week 0 | Week 4 | Week 8 | Week 12 | Follow-up | |
|---|---|---|---|---|---|
| Values are expressed as Mean ± SD. *Significant difference when compared with week 0 within the same group, p < 0.05 **Significant difference when compared with week 0 within the same group, p < 0.01. Different superscript letters are significantly other among the groups in the Δ value with Week 0 (p < 0.05). WC: Waist circumference; HC: Hip circumference; MAMC: Mid-arm muscle circumference; TSF: Triceps skin fold. | |||||
| Body weight (kg) | |||||
| Control group | 80.99 ± 13.54 | 80.15 ± 13.24* | 79.71 ± 12.85* | 79.69 ± 13.78** | 79.89 ± 13.66* |
| Supplement group | 79.35 ± 14.84 | 78.75 ± 14.78** | 78.49 ± 14.57** | 78.46 ± 14.62** | 77.98 ± 14.36** |
| ΔBody weight (kg) | |||||
| Control group | −0.85 ± 1.27A | −1.29 ± 1.93A | −1.31 ± 1.47AB | −1.10 ± 1.49A | |
| Supplement group | −0.60 ± 0.73A | −0.87 ± 0.97A | −0.89 ± 0.84B | −1.37 ± 2.66A | |
| BMI (kg/m2) | |||||
| Control group | 29.76 ± 2.57 | 29.42 ± 2.50* | 29.29 ± 2.45* | 29.27 ± 2.64** | 29.34 ± 2.62* |
| Supplement group | 29.19 ± 3.15 | 28.98 ± 3.23** | 28.87 ± 3.16** | 28.84 ± 3.11** | 28.93 ± 3.22** |
| ΔBMI (kg/m2) | |||||
| Control group | −0.34 ± 0.50A | −0.47 ± 0.67A | −0.49 ± 0.57AB | −0.42 ± 0.55B | |
| Supplement group | −0.21 ± 0.24A | −0.32 ± 0.35A | −0.35 ± 0.31B | −0.26 ± 0.49B | |
| Body fat (%) | |||||
| Control group | 35.49 ± 5.56 | 35.01 ± 5.98 | 34.45 ± 5.62 | 34.58 ± 5.33 | 34.70 ± 5.39 |
| Supplement group | 36.20 ± 4.79 | 35.05 ± 4.76** | 34.81 ± 4.78** | 35.27 ± 4.90** | 35.22 ± 4.73* |
| ΔBody fat (%) | |||||
| Control group | −0.48 ± 2.48A | −1.04 ± 2.46A | −0.91 ± 2.02B | −0.78 ± 1.93B | |
| Supplement group | −1.15 ± 1.16A | −1.39 ± 1.42A | −0.93 ± 1.68B | −0.98 ± 1.52B | |
| Fat-Free Mass (%) | |||||
| Control group | 64.51 ± 5.56 | 64.97 ± 5.37 | 64.98 ± 5.99 | 64.44 ± 5.67* | 65.72 ± 5.71 |
| Supplement group | 63.79 ± 4.78 | 64.54 ± 5.01** | 64.95 ± 4.76** | 64.82 ± 5.06** | 65.20 ± 4.78* |
| ΔFat-Free Mass (%) | |||||
| Control group | 0.47 ± 2.46A | 1.21 ± 2.45A | 1.19 ± 2.00B | 0.96 ± 1.82A | |
| Supplement group | 1.16 ± 1.16A | 1.41 ± 1.44A | 0.95 ± 1.67B | 1.46 ± 2.29A | |
| WC (cm) | |||||
| Control group | 94.61 ± 8.16 | 94.43 ± 8.26 | 94.39 ± 7.99 | 93.50 ± 9.36 | 94.15 ± 9.30 |
| Supplement group | 93.85 ± 8.86 | 93.00 ± 9.34* | 93.45 ± 9.38* | 92.70 ± 8.89* | 92.67 ± 8.99* |
| HC (cm) | |||||
| Control group | 106.73 ± 4.78 | 105.23 ± 4.70* | 105.10 ± 4.58* | 103.97 ± 4.89** | 104.53 ± 4.79** |
| Supplement group | 106.37 ± 7.86 | 105.55 ± 8.01* | 104.95 ± 8.09** | 104.67 ± 8.20** | 104.77 ± 8.28** |
| MAMC (cm) | |||||
| Control group | 31.82 ± 3.85 | 31.67 ± 3.49 | 31.52 ± 3.49 | 31.00 ± 3.57 | 30.98 ± 3.40 |
| Supplement group | 32.91 ± 2.88 | 32.77 ± 2.79 | 32.65 ± 2.80 | 32.40 ± 2.74 | 32.47 ± 2.72 |
| TSF (mm) | |||||
| Control group | 17.07 ± 6.83 | 16.80 ± 7.06 | 16.97 ± 7.05 | 16.50 ± 6.59 | 16.72 ± 6.52 |
| Supplement group | 11.97 ± 5.50 | 11.03 ± 3.15 | 11.03 ± 3.76 | 11.27 ± 3.48 | 11.23 ± 3.47 |
| Week 0 | Week 4 | Week 8 | Week 12 | Follow-up | ||
|---|---|---|---|---|---|---|
| Values are expressed as mean ± SD. *Significant difference when compared with week 0 within the same group, p < 0.05 **Significant difference when compared with week 0 within the same group, p < 0.01 Different superscript letters are significantly different among the groups in the Δvalue with week 0 (p < 0.05). | ||||||
| TG (mg/dL) | ||||||
| Control group | 136.47 ± 58.05 | 136.47 ± 78.17 | 164.40 ± 134.21 | 138.73 ± 43.66 | 139.57 ± 70.76 | |
| Supplement group | 124.20 ± 58.62 | 119.20 ± 71.51 | 126.20 ± 62.56 | 121.67 ± 64.17 | 140.80 ± 94.84 | |
| TC (mg/dL) | ||||||
| Control group | 189.93 ± 43.51 | 183.73 ± 38.26 | 187.20 ± 32.83 | 186.53 ± 39.81 | 187.67 ± 37.95 | |
| Supplement group | 229.27 ± 92.24 | 225.40 ± 84.64 | 230.40 ± 90.36 | 226.40 ± 102.81 | 224.27 ± 91.99 | |
| LDL-C (mg/dL) | ||||||
| Control group | 117.89 ± 36.66 | 114.50 ± 36.11 | 106.37 ± 30.91 | 110.37 ± 34.62 | 109.80 ± 34.97 | |
| Supplement group | 145.33 ± 76.96 | 148.33 ± 72.07 | 145.80 ± 66.59 | 143.25 ± 87.12 | 140.66 ± 73.57 | |
| HDL-C(mg/dL) | ||||||
| Control group | 45.03 ± 9.12 | 44.08 ± 9.16 | 42.31 ± 8.43 | 44.54 ± 7.31 | 44.33 ± 8.28 | |
| Supplement group | 52.12 ± 8.54 | 49.66 ± 8.79 | 48.95 ± 7.23 | 48.68 ± 9.11 | 49.63 ± 10.92 | |
| FFA (mmol/L) | ||||||
| Control group | 0.49 ± 0.19 | 0.64 ± 0.15 | 0.58 ± 0.17 | 0.49 ± 0.29 | 0.51 ± 0.19 | |
| Supplement group | 0.52 ± 0.16 | 0.68 ± 0.14** | 0.63 ± 0.13** | 0.62 ± 0.19** | 0.61 ± 0.19* | |
| FBG (mg/dL) | ||||||
| Control group | 94.00 ± 9.25 | 93.47 ± 10.62 | 91.60 ± 9.08 | 91.07 ± 9.72 | 91.97 ± 9.74 | |
| Supplement group | 97.33 ± 14.85 | 95.07 ± 14.60 | 95.67 ± 16.67 | 98.60 ± 17.93 | 96.40 ± 19.78 | |
| HbA1C (%) | ||||||
| Control group | 5.50 ± 0.47 | 5.55 ± 0.43 | 5.47 ± 0.38 | 5.49 ± 0.41 | 5.46 ± 0.42 | |
| Supplement group | 5.59 ± 0.47 | 5.59 ± 0.48 | 5.58 ± 0.52 | 5.53 ± 0.51 | 5.56 ± 0.57 | |
| Insulin (µIU/mL) | ||||||
| Control group | 20.19 ± 8.17 | 19.67 ± 7.94 | 20.44 ± 15.75 | 21.10 ± 11.54 | 18.84 ± 8.52 | |
| Supplement group | 19.76 ± 11.62 | 17.97 ± 9.60 | 17.76 ± 8.53 | 20.15 ± 11.32 | 16.91 ± 12.34 | |
| HOMA-IR | ||||||
| Control group | 4.70 ± 2.07 | 4.65 ± 2.29 | 4.64 ± 3.35 | 4.87 ± 2.99 | 4.39 ± 2.38 | |
| Supplement group | 5.01 ± 3.85 | 4.33 ± 2.62 | 4.39 ± 3.03 | 5.26 ± 4.18 | 4.14 ± 3.22 | |
| Week 0 | Week 4 | Week 8 | Week 12 | Follow-up | |
|---|---|---|---|---|---|
| Values are expressed as Mean ± SD. *Significant difference when compared with week 0 within the same group, p < 0.05 **Significant difference when compared with week 0 within the same group, p < 0.01 SBP: Systolic blood pressure DBP: Diastolic blood pressure. | |||||
| SBP (mmHg) | |||||
| Control group | 128.00 ± 14.30 | 127.07 ± 13.60 | 126.33 ± 13.25 | 124.87 ± 18.60 | 126.20 ± 17.03 |
| Supplement group | 129.53 ± 17.09 | 124.13 ± 18.26 | 120.53 ± 16.46** | 121.60 ± 16.89** | 120.13 ± 15.84** |
| DBP (mmHg) | |||||
| Control group | 83.53 ± 8.94 | 84.93 ± 10.59 | 81.67 ± 11.60 | 81.20 ± 10.19 | 81.27 ± 10.73 |
| Supplement group | 79.20 ± 15.61 | 78.47 ± 14.39 | 79.00 ± 13.60 | 77.47 ± 12.78 | 78.13 ± 13.93 |
| Pulse (bpm) | |||||
| Control group | 75.33 ± 7.58 | 75.13 ± 8.43 | 75.40 ± 7.37 | 77.00 ± 6.60 | 75.33 ± 7.19 |
| Supplement group | 73.07 ± 10.00 | 73.33 ± 9.09 | 71.13 ± 6.79 | 72.93 ± 9.09 | 76.00 ± 10.49 |
| Week 0 | Week 4 | Week 8 | Week 12 | Follow-up | |
|---|---|---|---|---|---|
| Values are expressed as Mean ± SD. *Significant difference when compared with week 0 within the same group, p < 0.05 **Significant difference when compared with week 0 within the same group, p < 0.01. CPK: Creatine Phosphokinase, LDH: Lactic dehydrogenase. | |||||
| CPK (IU/L) | |||||
| Control group | 100.07 ± 38.18 | 121..40 ± 61.79 | 104.40 ± 59.45 | 92.60 ± 46.47 | 103.10 ± 60.03 |
| Supplement group | 134.40 ± 71.23 | 131.00 ± 67.41 | 137.07 ± 102.39 | 133.13 ± 104.52 | 121.47 ± 77.97 |
| LDH (IU/L) | |||||
| Control group | 136.80 ± 17.03 | 143.80 ± 24.59 | 144.47 ± 21.33 | 145.53 ± 21.40 | 139.90 ± 21.08 |
| Supplement group | 141.80 ± 24.10 | 148.67 ± 25.12* | 146.80 ± 27.21* | 149.47 ± 27.50* | 142.00 ± 24.72 |
| GOT (IU/L) | |||||
| Control group | 24.87 ± 7.35 | 26.20 ± 7.09 | 28.73 ± 13.8 | 25.33 ± 10.44 | 26.10 ± 8.81 |
| Supplement group | 20.40 ± 4.29 | 22.20 ± 7.55 | 21.80 ± 7.12 | 22.33 ± 7.90 | 21.33 ± 7.52 |
| GPT (IU/L) | |||||
| Control group | 30.33 ± 20.40 | 31.27 ± 15.40 | 34.73 ± 24.75 | 34.40 ± 32.22 | 33.90 ± 25.68 |
| Supplement group | 23.80 ± 8.39 | 25.60 ± 12.74 | 23.53 ± 11.22 | 25.73 ± 14.02 | 25.27 ± 12.27 |
| BUN (mg/dL) | |||||
| Control group | 11.60 ± 2.59 | 12.33 ± 2.23 | 12.20 ± 3.12 | 13.93 ± 3.63 | 12.37 ± 2.56 |
| Supplement group | 12.60 ± 4.12 | 12.53 ± 3.80 | 12.67 ± 2.72 | 12.07 ± 3.65 | 11.27 ± 2.37 |
| Creatinine (mg/dL) | |||||
| Control group | 0.85 ± 0.22 | 0.84 ± 0.20 | 0.84 ± 0.21 | 0.84 ± 0.20 | 0.83 ± 0.21 |
| Supplement group | 0.81 ± 0.13 | 0.83 ± 0.12 | 0.81 ± 0.12 | 0.80 ± 0.11 | 0.81 ± 0.11 |
| UA (mg/dL) | |||||
| Control group | 6.39 ± 1.76 | 6.80 ± 1.65 | 6.44 ± 1.42 | 6.37 ± 1.62 | 6.45 ± 1.61 |
| Supplement group | 5.95 ± 1.37 | 5.95 ± 1.15 | 5.93 ± 1.01 | 5.99 ± 1.01 | 6.47 ± 1.35 |
| Week 0 | Week 4 | Week 8 | Week 12 | Follow-up | |
|---|---|---|---|---|---|
| Values are expressed as Mean ± SD. *Significant difference when compared with week 0 within the same group, p < 0.05 **Significant difference when compared with week 0 within the same group, p < 0.01. | |||||
| Adiponectin (µg/mL) | |||||
| Control group | 2.77 ± 1.44 | 3.12 ± 1.56* | 3.08 ± 1.88* | 3.31 ± 1.87* | 3.42 ± 1.91* |
| Supplement group | 4.37 ± 3.15 | 4.59 ± 3.09* | 4.68 ± 3.41* | 4.71 ± 3.45* | 4.47 ± 3.07* |
| Leptin (ng/mL) | |||||
| Control group | 17.70 ± 12.42 | 17.17 ± 11.29 | 19.51 ± 14.85 | 19.84 ± 9.81 | 17.52 ± 9.76 |
| Supplement group | 21.21 ± 17.83 | 16.81 ± 9.44 | 16.26 ± 8.36 | 15.38 ± 7.96 | 16.60 ± 12.08 |
| Week 0 | Week 4 | Week 8 | Week 12 | Follow-up | |
|---|---|---|---|---|---|
| Values are expressed as Mean ± SD. *Significant difference when compared with week 0 within the same group, p < 0.05 **Significant difference when compared with week 0 within the same group, p < 0.01. TEAC: Trolox equivalent antioxidant capacity, TBARS: Thiobarbituric acid reactive substances, GSH: Glutathione. | |||||
| TEAC (µM) | |||||
| Control group | 4.01 ± 0.17 | 4.09 ± 0.19 | 4.02 ± 0.20 | 4.16 ± 0.36 | 4.15 ± 0.33 |
| Supplement group | 4.03 ± 0.12 | 4.08 ± 0.19* | 4.53 ± 0.17* | 4.94 ± 0.46* | 5.32 ± 0.44* |
| TBARS (µM) | |||||
| Control group | 1.00 ± 0.35 | 0.96 ± 0.32 | 0.87 ± 0.25 | 0.81 ± 0.19 | 1.02 ± 0.38 |
| Supplement group | 1.17 ± 0.35 | 0.88 ± 0.31* | 0.73 ± 0.22* | 0.63 ± 0.25* | 0.87 ± 0.19* |
| GSH (ng) | |||||
| Control group | 5.97 ± 0.07 | 5.99 ± 0.05 | 6.03 ± 0.04 | 6.05 ± 0.07 | 6.03 ± 0.05 |
| Supplement group | 5.88 ± 0.07 | 5.97 ± 0.06* | 6.02 ± 0.04* | 6.05 ± 0.05* | 6.06 ± 0.05* |