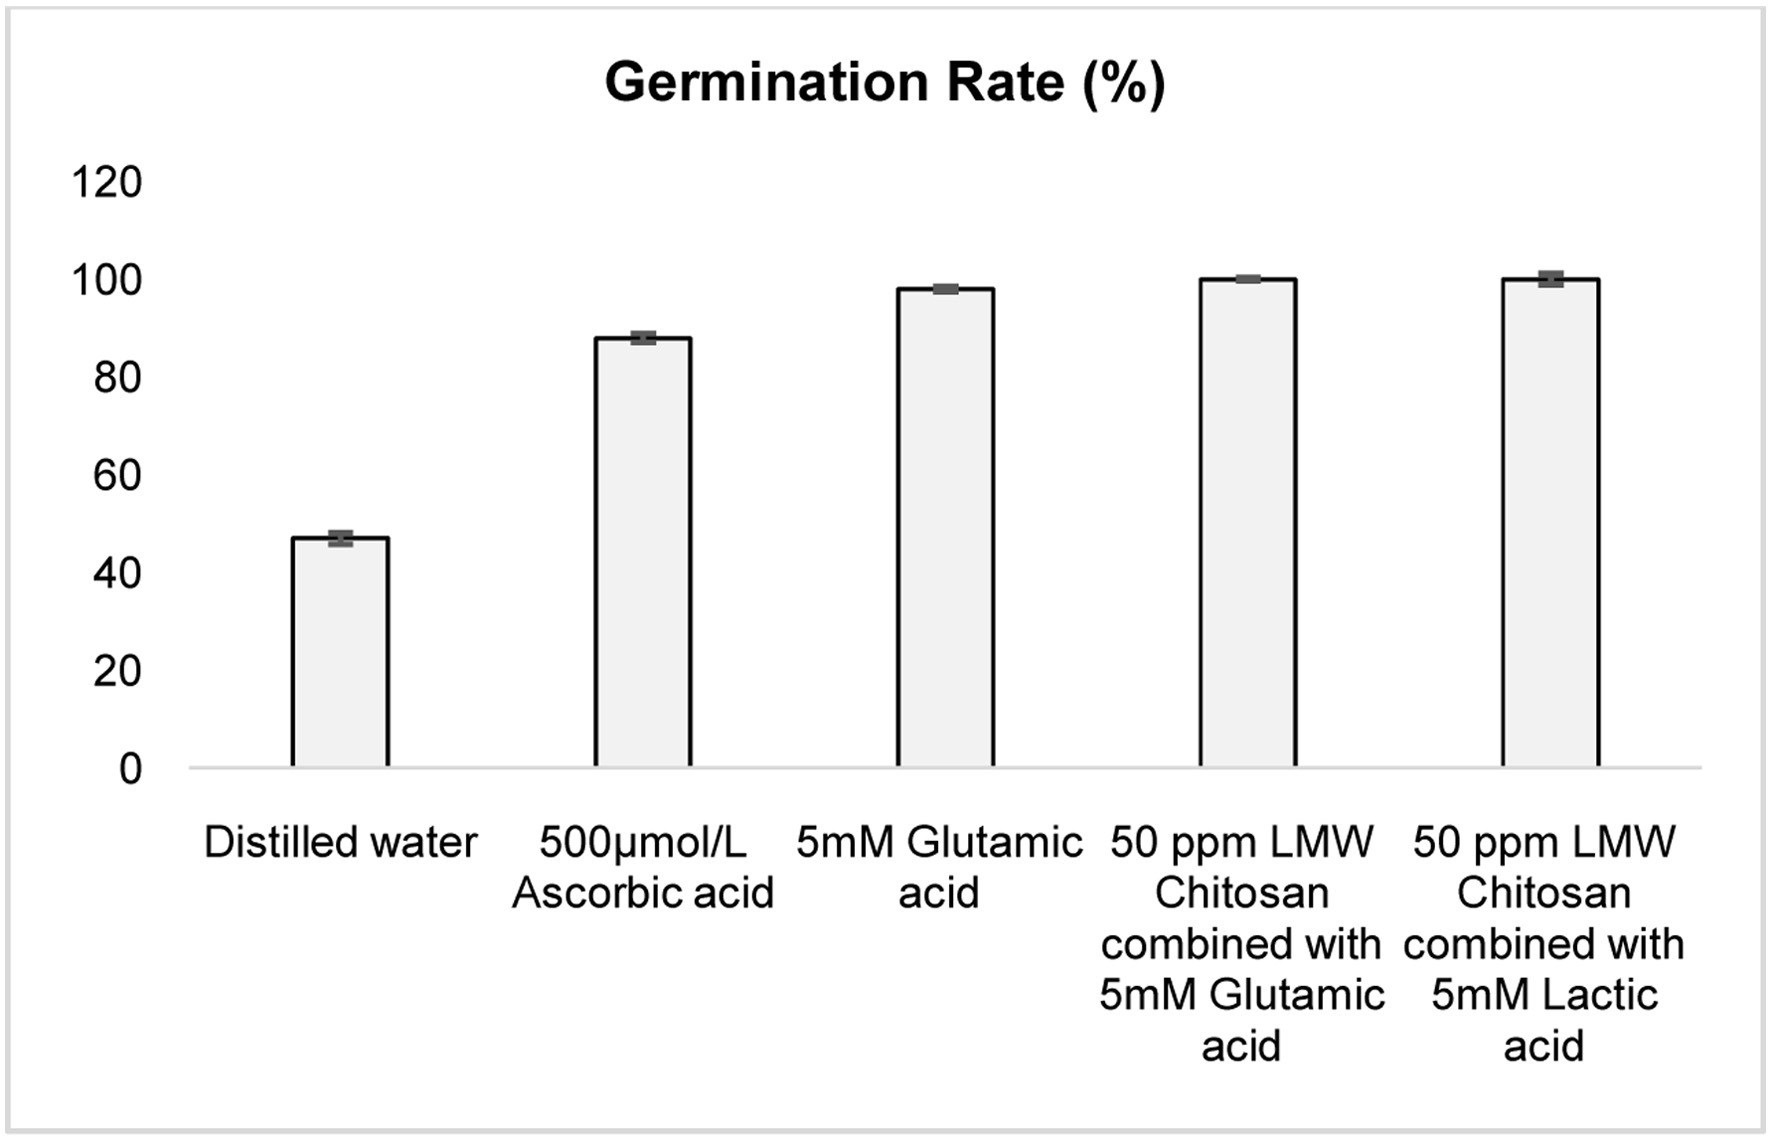
Figure 1. Germination percentage of cluster bean seeds following various chemical elicitor treatments. All the values are expressed as Mean ± SEM (n = 3).
| Journal of Food Bioactives, ISSN 2637-8752 print, 2637-8779 online |
| Journal website www.isnff-jfb.com |
Original Research
Volume 30, June 2025, pages 33-39
Elicitor-induced enhancement of bioactive content and α-amylase inhibition in cluster bean sprouts
Figures
Tables
| Treatment | Protein content (mg BSAE/g) | Total Phenol Content (mg GAE/g) | Total Ascorbic acid (mg AA/g) |
|---|---|---|---|
| Phytochemical analysis of non-germinated and germinated cluster bean seeds (Cyamopsis tetragonoloba) treated with distilled water and various elicitor solutions for 72 hours. The table presents the total protein content, total phenolic content, and total ascorbic acid content in the different treatment groups. Data are expressed as Mean ± SEM (n = 3). Significant differences (p < 0.05) between treatment groups are indicated by different superscript letters. Protein Content is expressed as mg/g of BSA equivalents, Phenolic Content is expressed as mg/g of gallic acid equivalents, Ascorbic Acid Content is expressed as mg/g of ascorbic acid equivalents. | |||
| Non-Germinated | 115.173 ± 0.718a | 12.851 ± 0.118a | 10.586 ± 0.138cb |
| DW | 198.767 ± 2.726b | 12.783 ± 0.307a | 8.066 ± 0.201a |
| 500 µmol/L Ascorbic acid | 195.257 ± 0.303b | 12.126 ± 0.240a | 9.715 ± 0.341b |
| 5 mM Glutamic acid | 285.946 ± 3.763e | 15.957 ± 0.152c | 8.180 ± 0.170a |
| 50 ppm LMW chitosan with 5 mM Glutamic acid | 266.487 ± 1.675d | 14.713 ± 0.349b | 11.163 ± 0.606c |
| 50 ppm LMW chitosan with 5 mM Lactic acid | 207.780 ± 2.205c | 12.443 ± 0.349a | 10.632 ± 0.280bc |
| Parameter | DPPH | FRAP |
|---|---|---|
| ns: – nonsignificant and *, ** - correlation is significant at p < 0.05, p < 0.01 levels respectively. | ||
| Protein | 0.848** | −0.739** |
| Phenol | 0.544* | −0.138ns |
| Total ascorbic acid | 0.158ns | 0.273ns |
| Sample 10mg/ml | α-amylase inhibitory activity using malt source (% inhibition) | α-amylase inhibitory activity using porcine pancreas source (% inhibition) |
|---|---|---|
| All the values are the Mean ± SEM (n = 3). Different lower-case letters in column indicate the significant difference for the different elicitor treatment. | ||
| Non-Germinated | 10.453 ± 0.876a | 1.750 ± 0.556a |
| Distilled water | 16.300 ± 1.599b | 13.280 ± 2.426b |
| 500 µmol/L Ascorbic acid | 40.350 ± 1.656c | 42.810 ± 1.031c |
| 5 mM Glutamic acid | 49.39 ± 1.233d | 49.053 ± 0.640de |
| 50 ppm LMW chitosan with 5 mM Glutamic acid | 49.553 ± 1.394d | 53.920 ± 1.518e |
| 50 ppm LMW chitosan with 5 mM Lactic acid | 49.510 ± 1.424d | 45.980 ± 0.381cd |