Figures
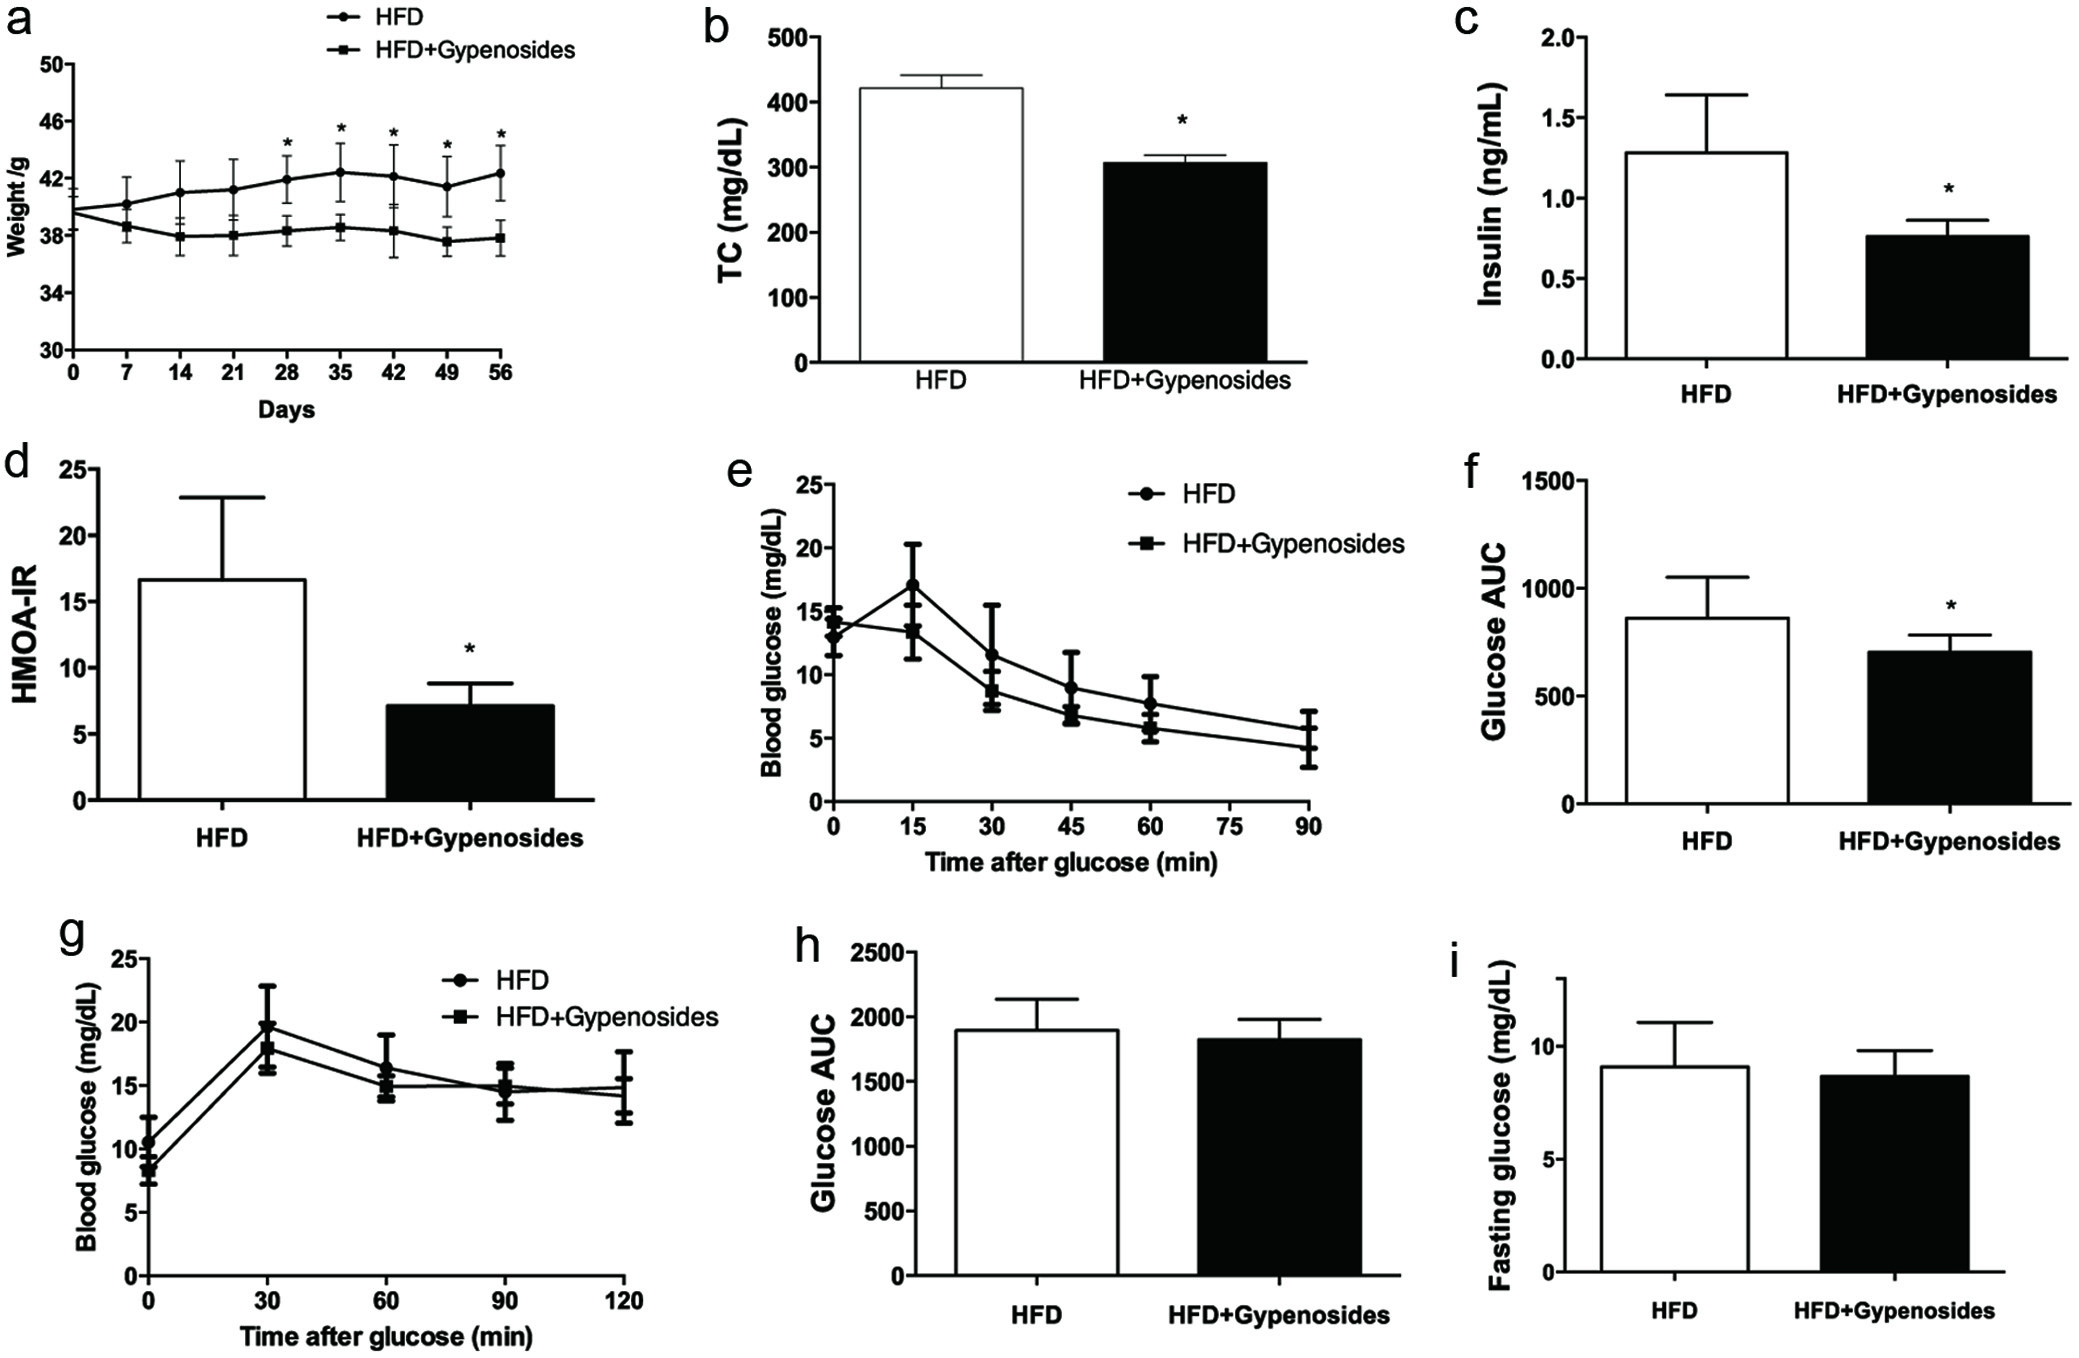
Figure 1. Effect of gypenosides on body weight gain (a), total cholesterol (b), fasting glucose (c), fasting insulin (d), HOMA-IR index (e), oral glucose tolerance test (OGTT, F-G) and intraperitoneal insulin tolerance test (IPITT, H-I). HFD represents the mice fed a high-fat diet and HFD+Gypenosides represent the mice fed HFD plus 300 mg/kg BW/d gypenosides. Values are means ± SD (n = 8). Values marked with * are significantly different from each other at p < 0.05.
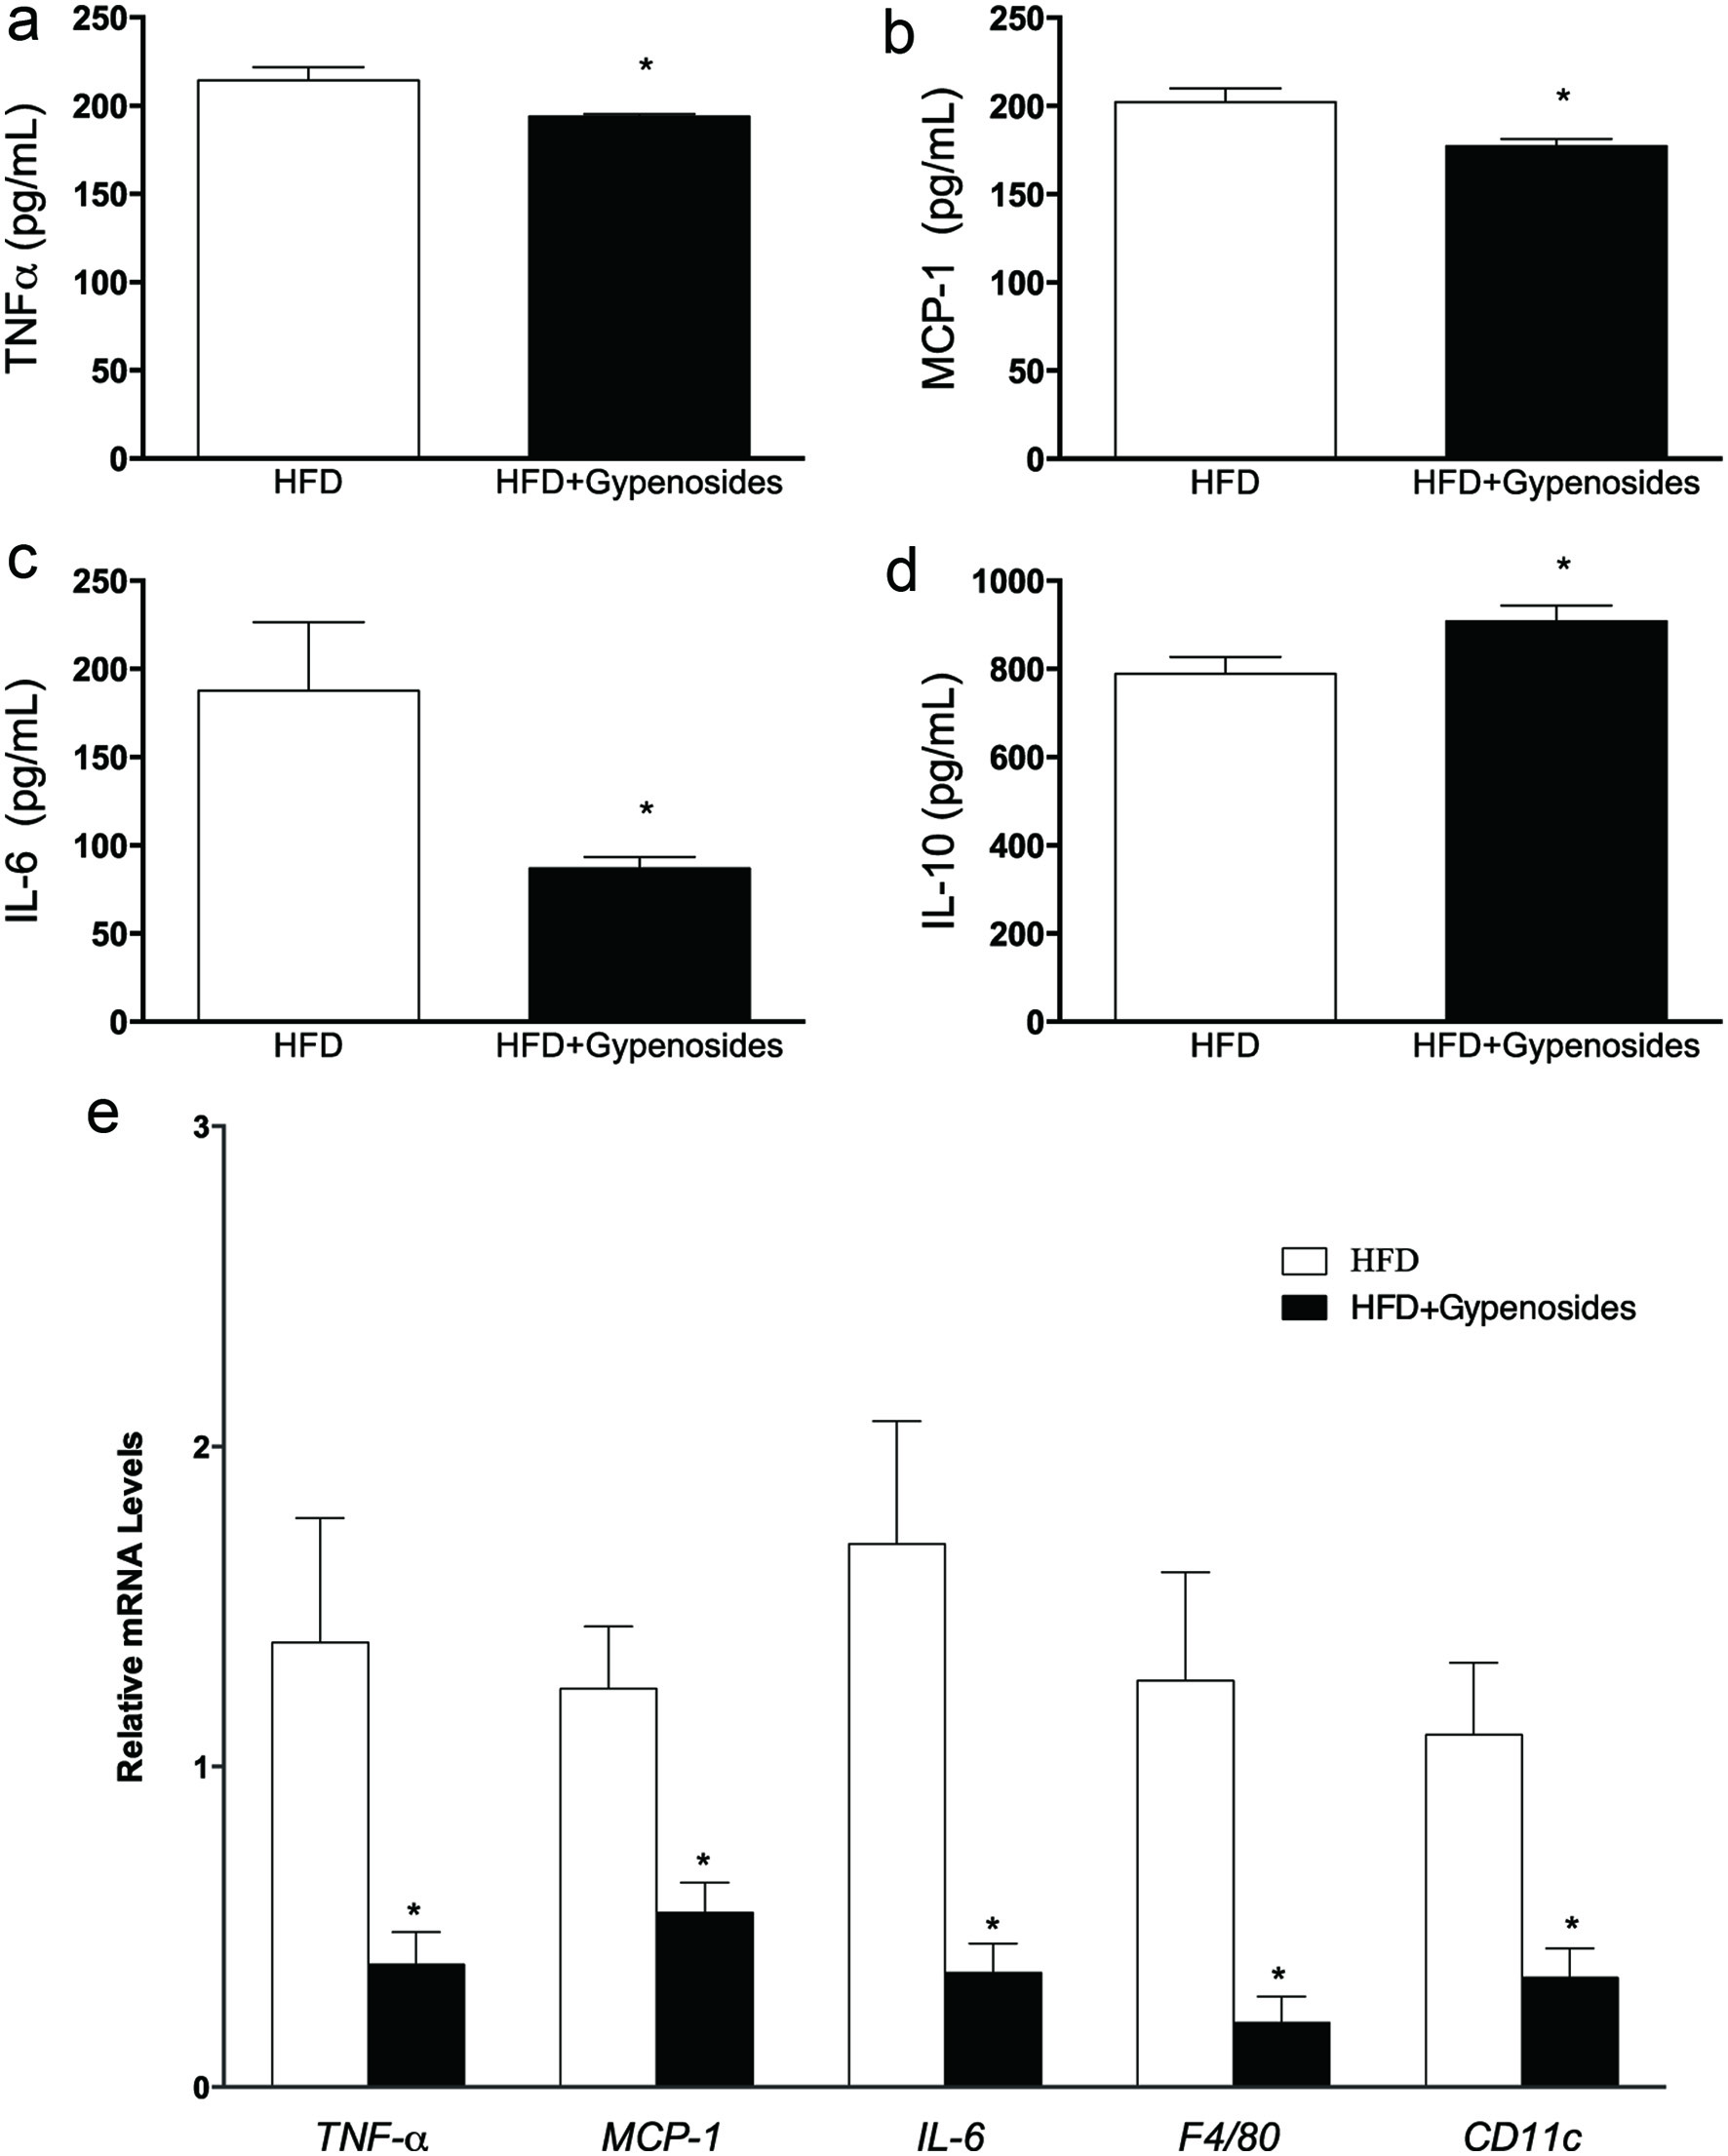
Figure 2. Effect of gypenosides on pro-inflammatory cytokines TNF-α (a), MCP-1 (b), IL-6 (c) and IL-10 (d) levels in the plasma, and related mRNA expression in white adipocyte tissue (e). HFD represents the mice fed a high-fat diet and HFD+Gypenosides represent the mice fed HFD plus 300 mg/kg BW/d gypenosides. Values are means ± SD (n = 8). Values marked with *are significantly different from each other at p < 0.05.
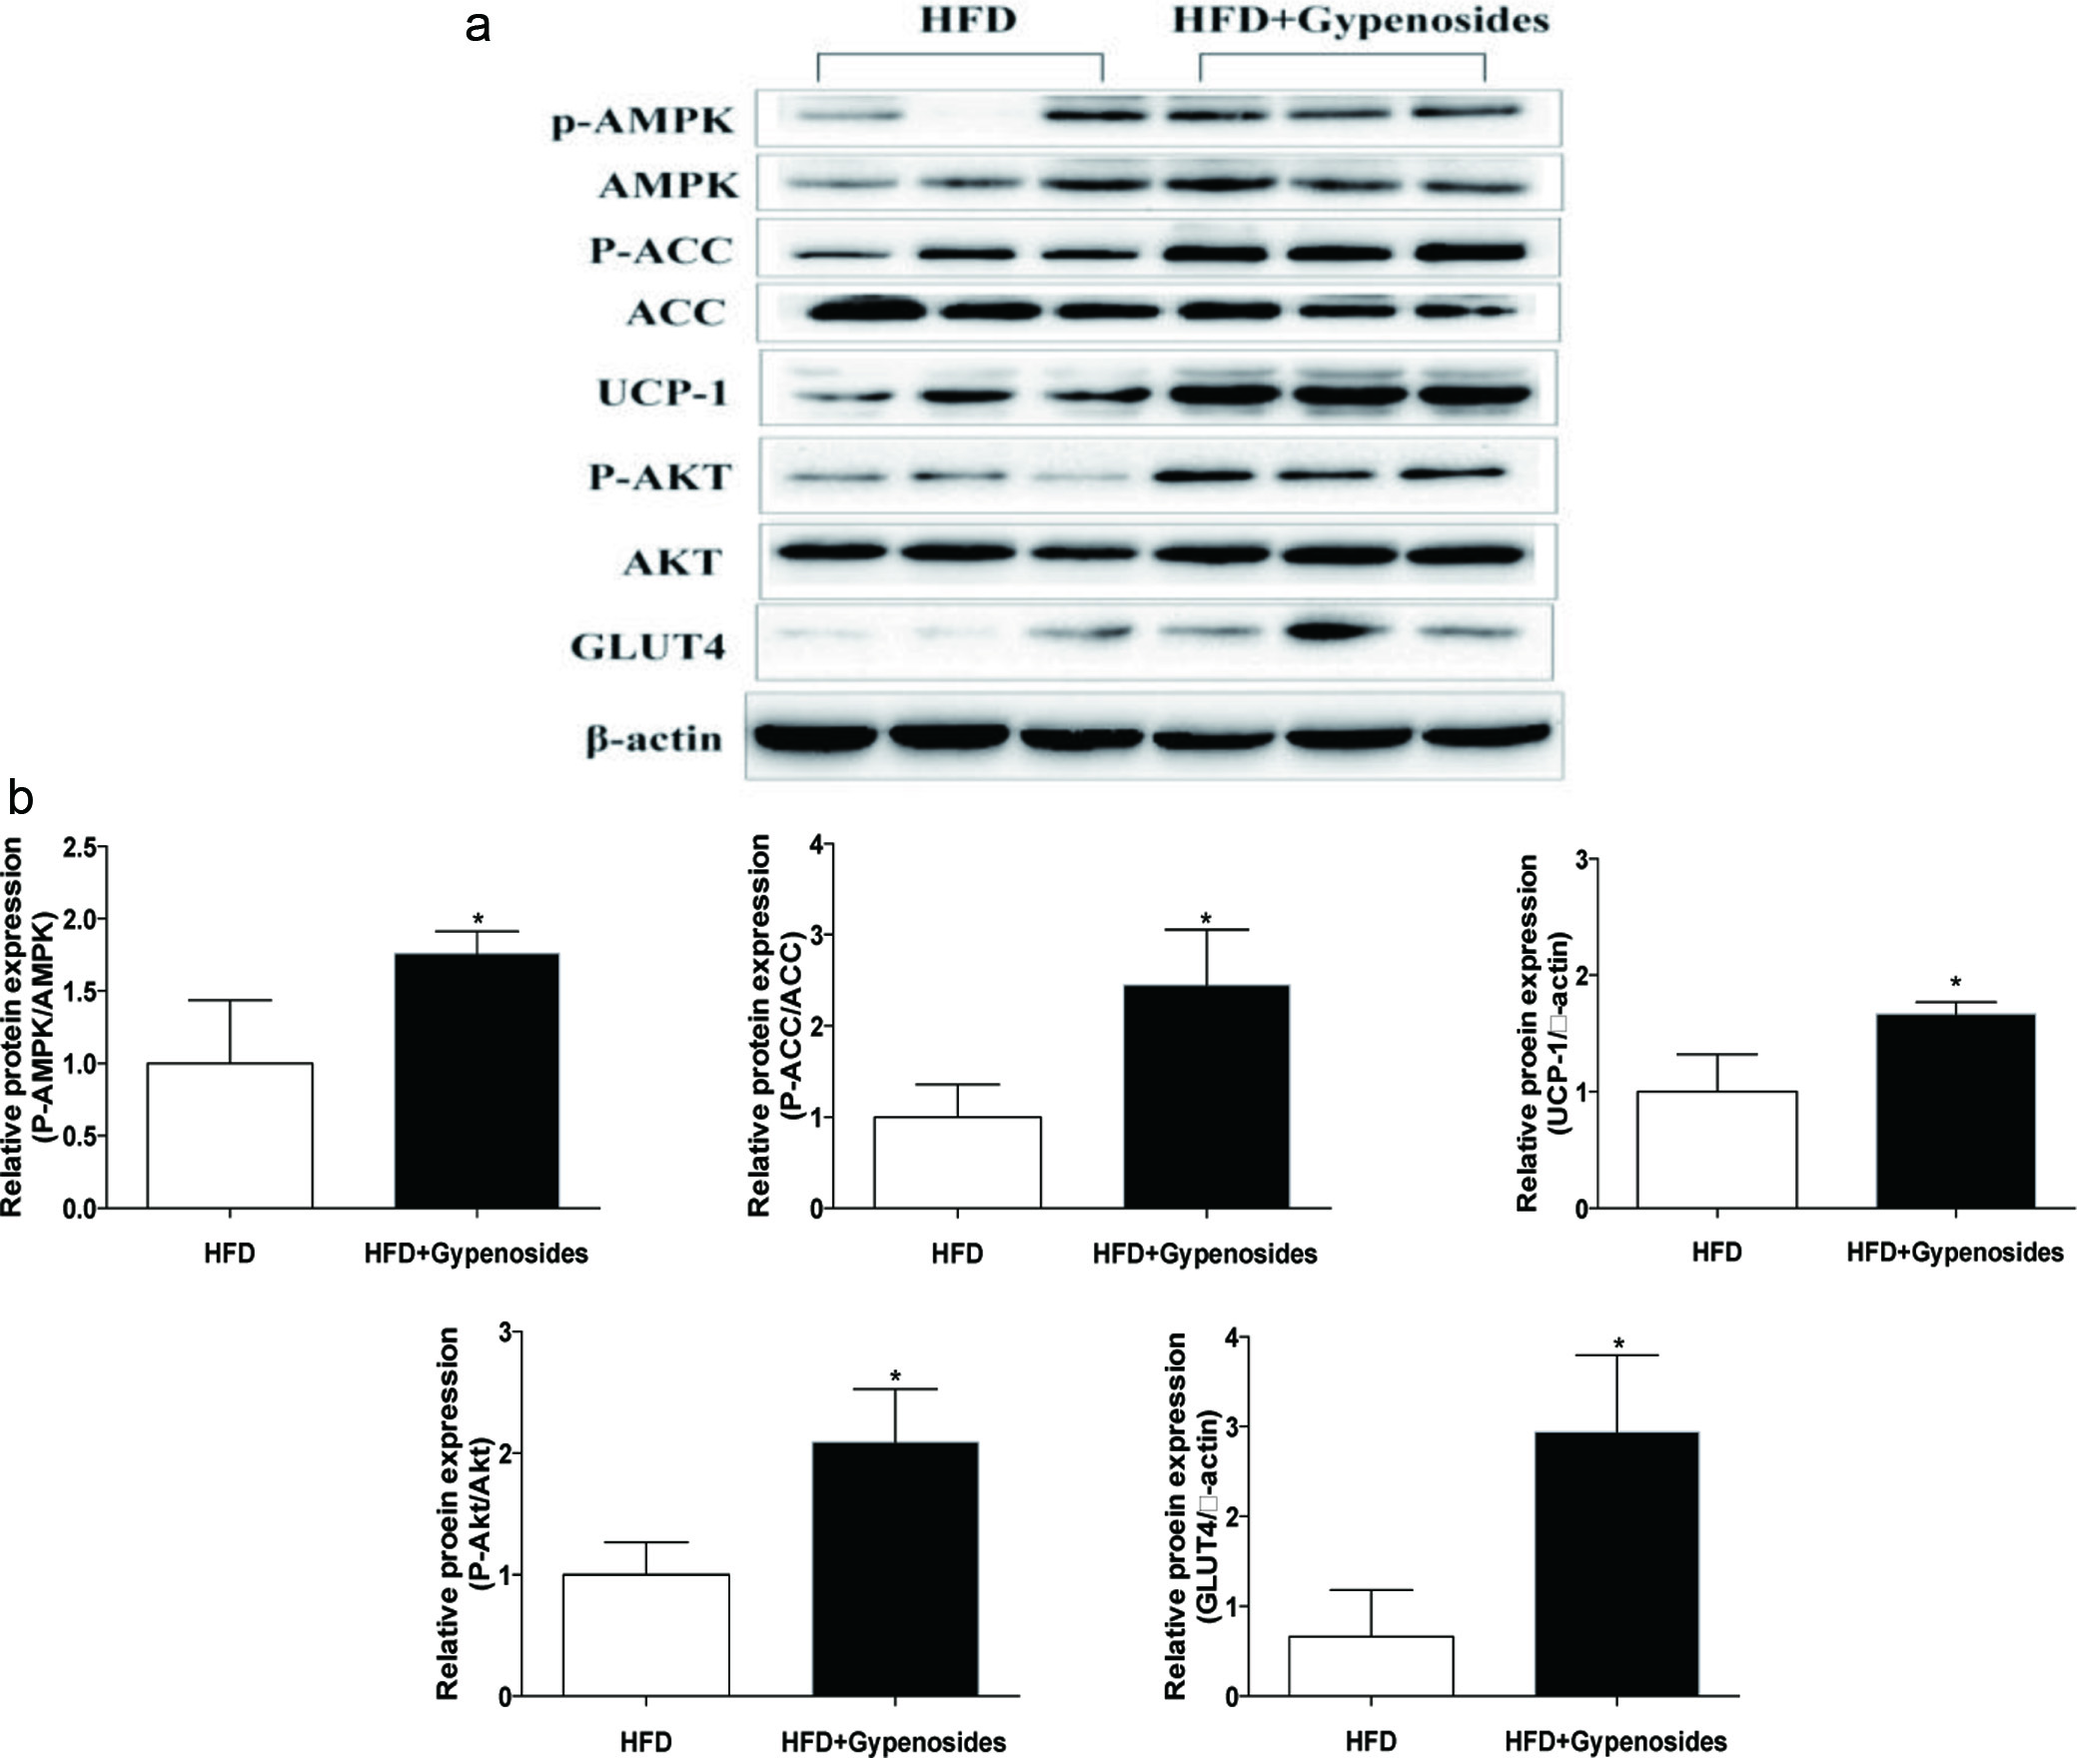
Figure 3. Effect of gypenosides on haematoxylin and eosin (H&E) staining of liver (a) and representative immunoblots and relative protein contents of total and phosphorylated ACC, AMPK AKT and total UCP-1, GLUT4 (b). HFD represents the mice fed a high-fat diet and HFD+Gypenosides represent the mice fed HFD plus 300 mg/kg BW/d gypenosides. Values are means ± SD (n = 8). Values marked with * are significantly different from each other at p < 0.05.
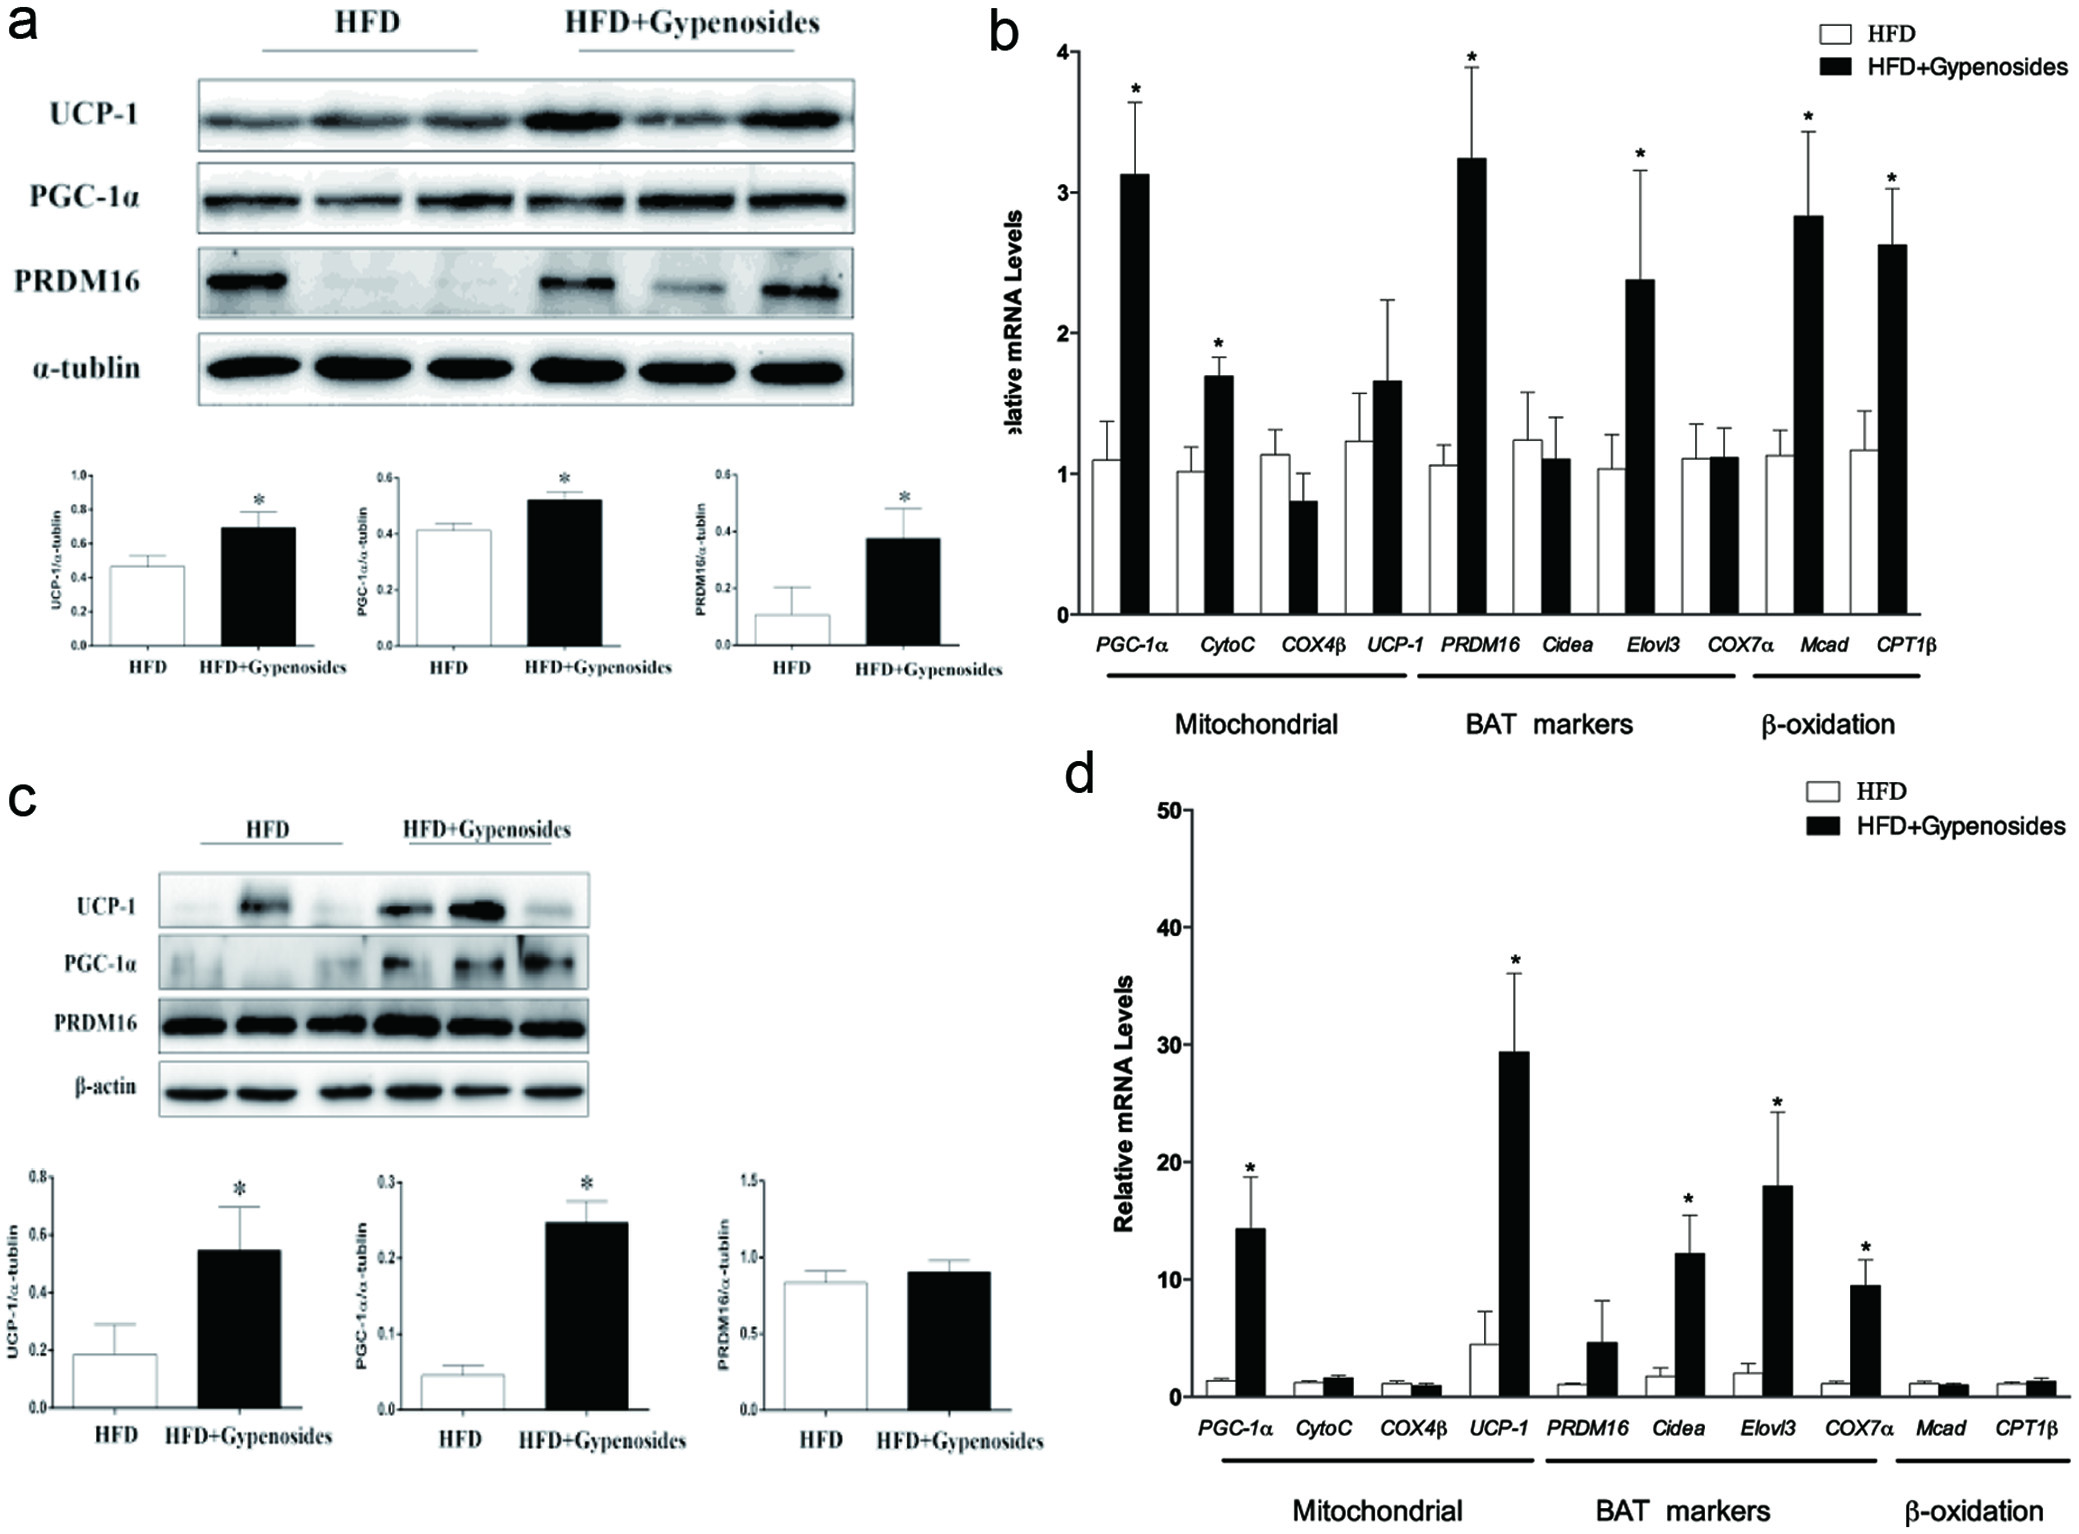
Figure 4. Effect of gypenosides on molecular markers of lipid metabolism in brown adipocyte tissue (a–b) and white adipocyte tissue (c–d) at both protein and mRNA levels. HFD represents the mice fed a high-fat diet and HFD+Gypenosides represent the mice fed HFD plus 300 mg/kg BW/d gypenosides. Values are means ± SD (n = 8). Values marked with * are significantly different from each other at p < 0.05.
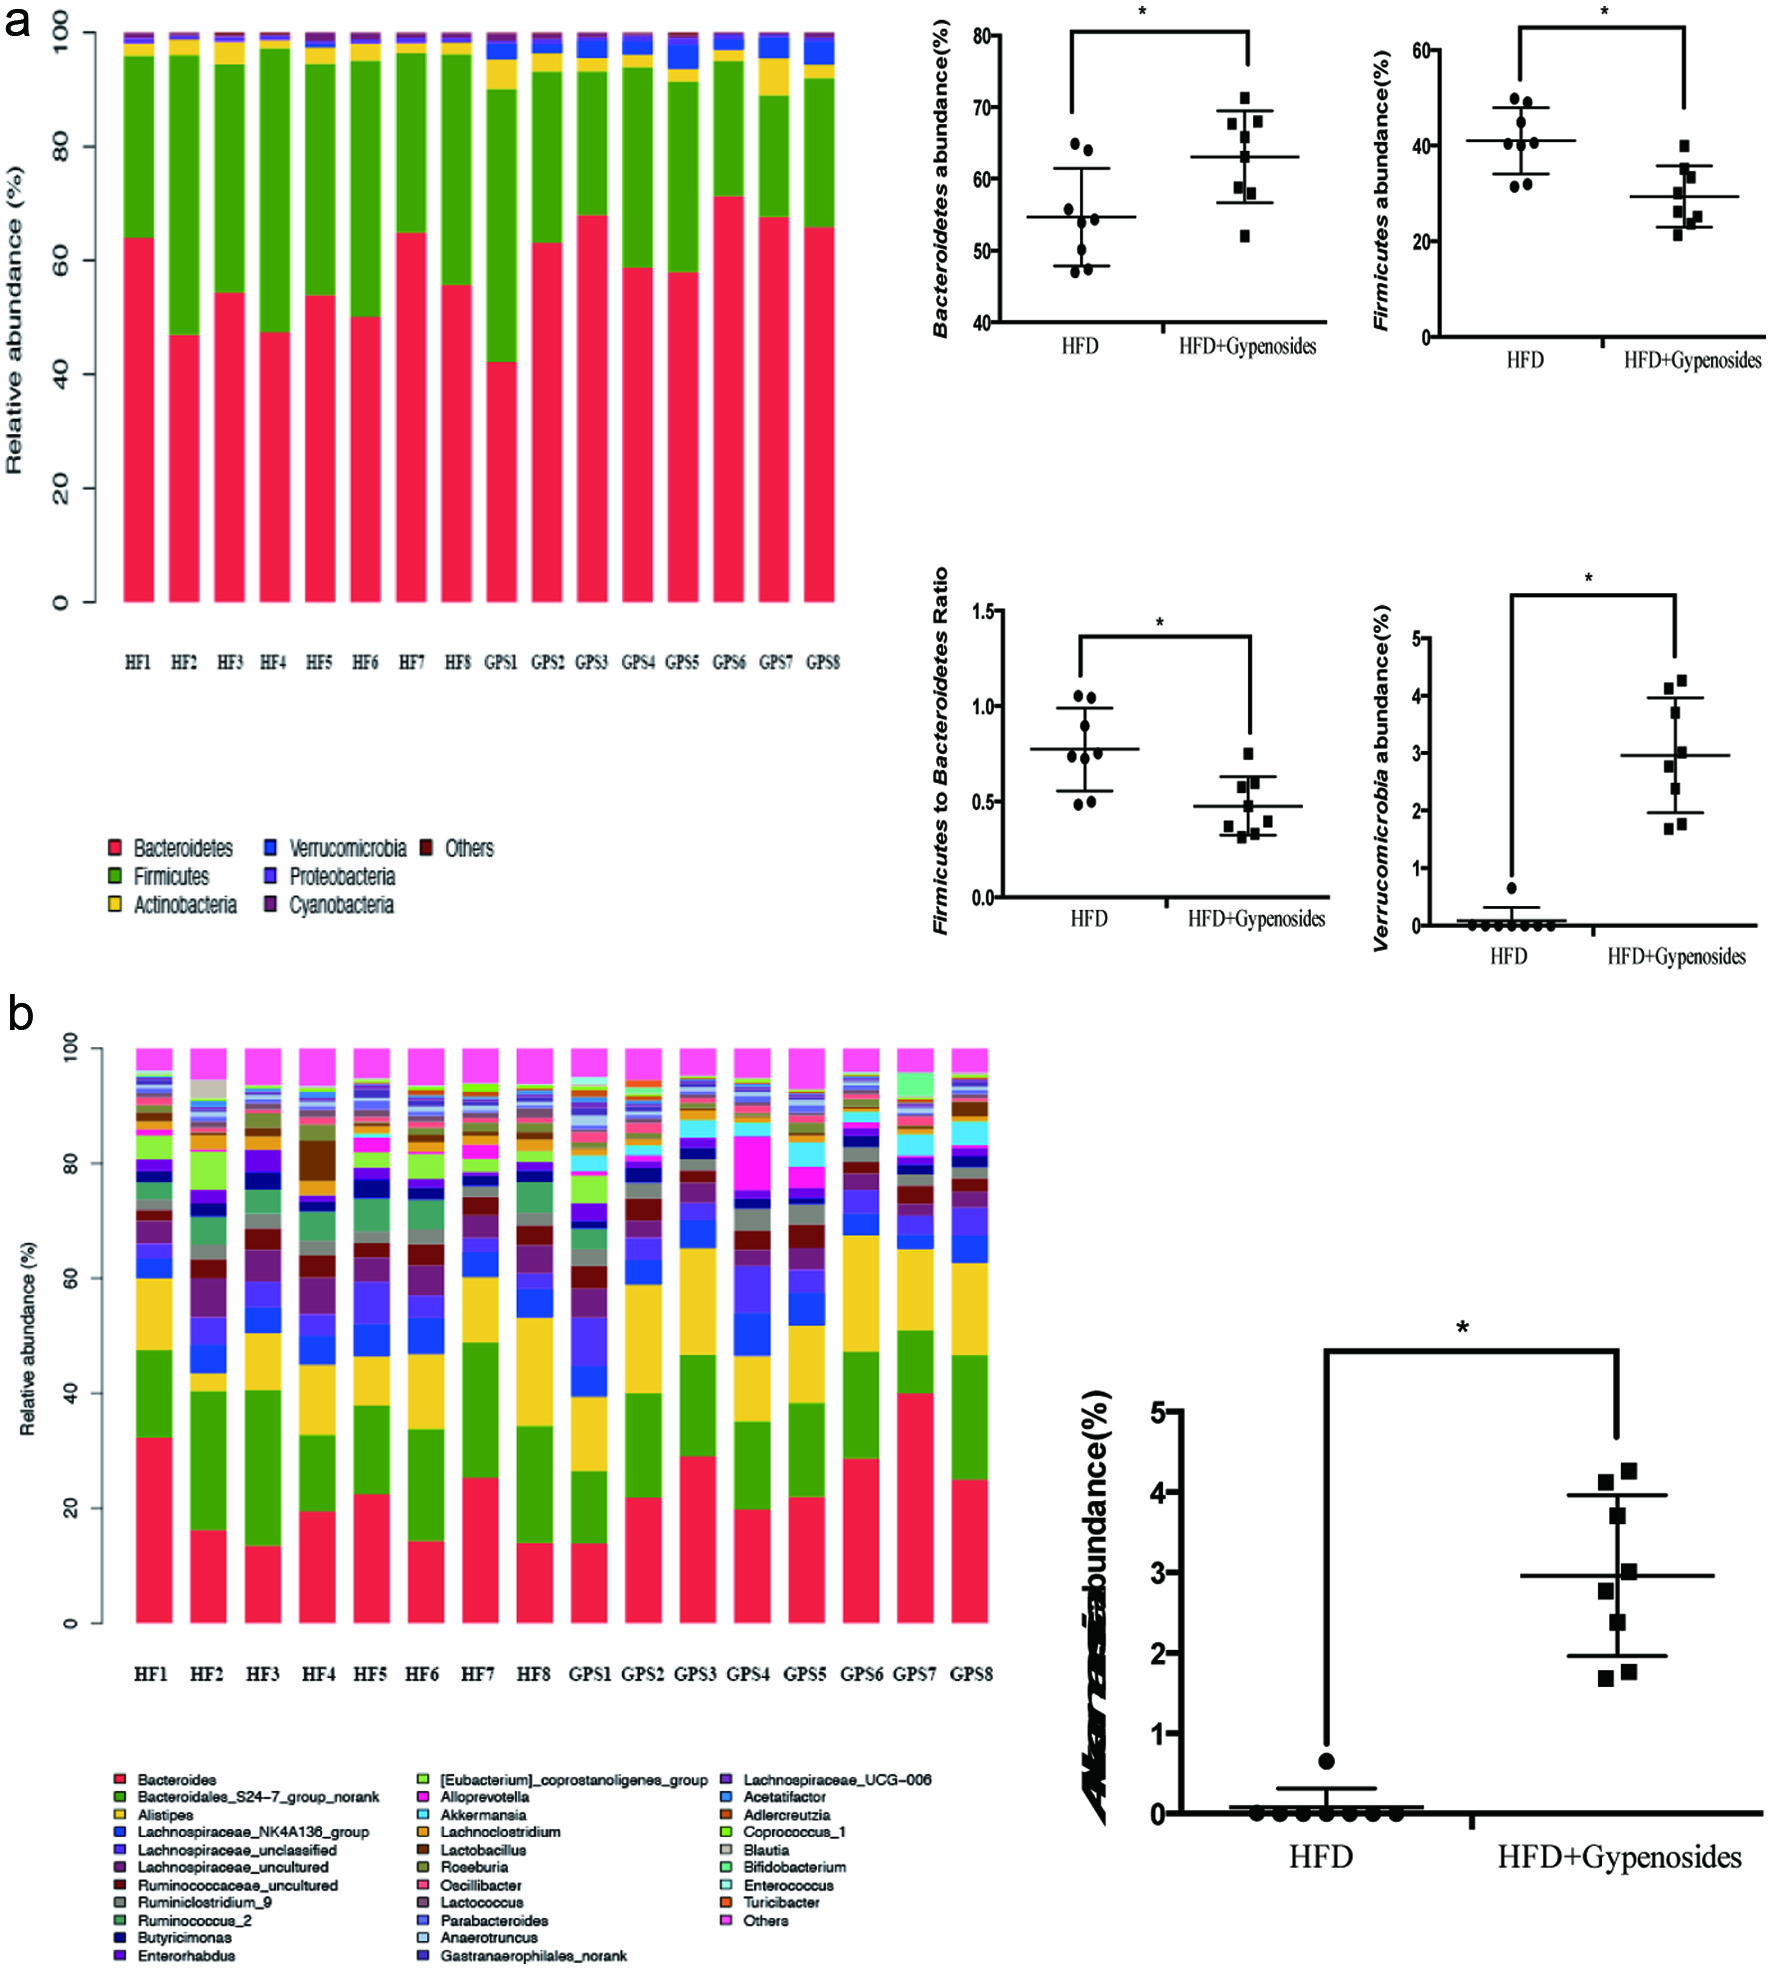
Figure 5. Fecal bacterial community at the phylum level (a) and genus level (b). HFD represents the mice fed a high-fat diet and HFD+Gypenosides represent the mice fed HFD plus 300 mg/kg BW/d gypenosides. Values are means ± SD (n = 8). Values marked with * are significantly different from each other at p < 0.05.