Journal of Food Bioactives, ISSN 2637-8752 print, 2637-8779 online
Journal website www.isnff-jfb.com

Review

Volume 19, September 2022, pages 143-153


Antidiabetic effect of Melicope glabra (Blume) T.G. Hartley (Rutaceae) in high-fat diet/streptozotocin-induced diabetic rats and its bioactive components

Figures

Figure 1.
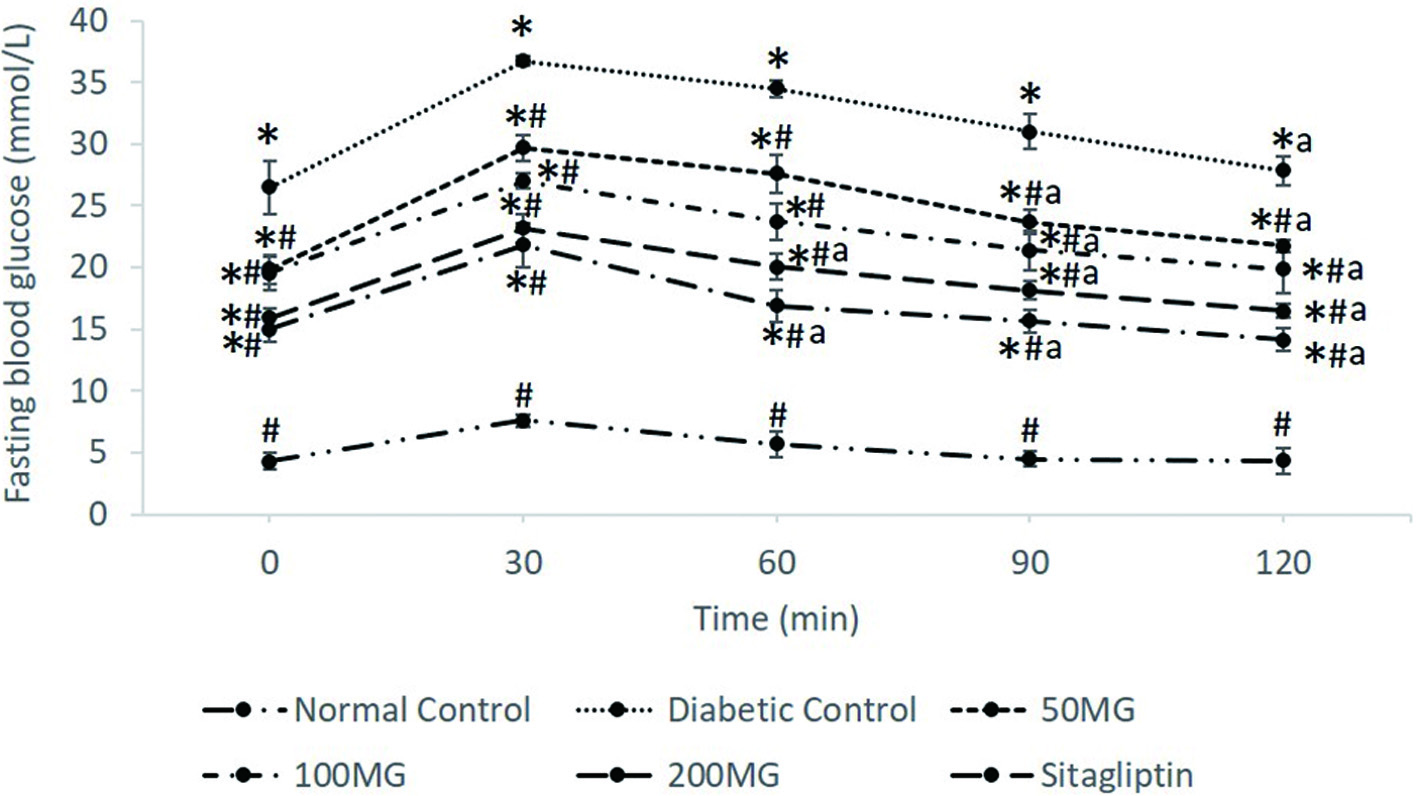
Figure 1. The effects of M. glabra extract on blood glucose levels in OGTT. Data are shown as mean ± standard deviation. *(p < 0.05) versus normal control; #(p < 0.05) versus diabetic control. a (p < 0.05) versus FBG at 30 min. 50MG: Group received 50 mg/kg of M. glabra extract; 100MG: Group received 100 mg/kg of M. glabra extract; 200MG: Group received 200 mg/kg of M. glabra extract; SITA: Group received 10 mg/kg of sitagliptin.
Figure 2.
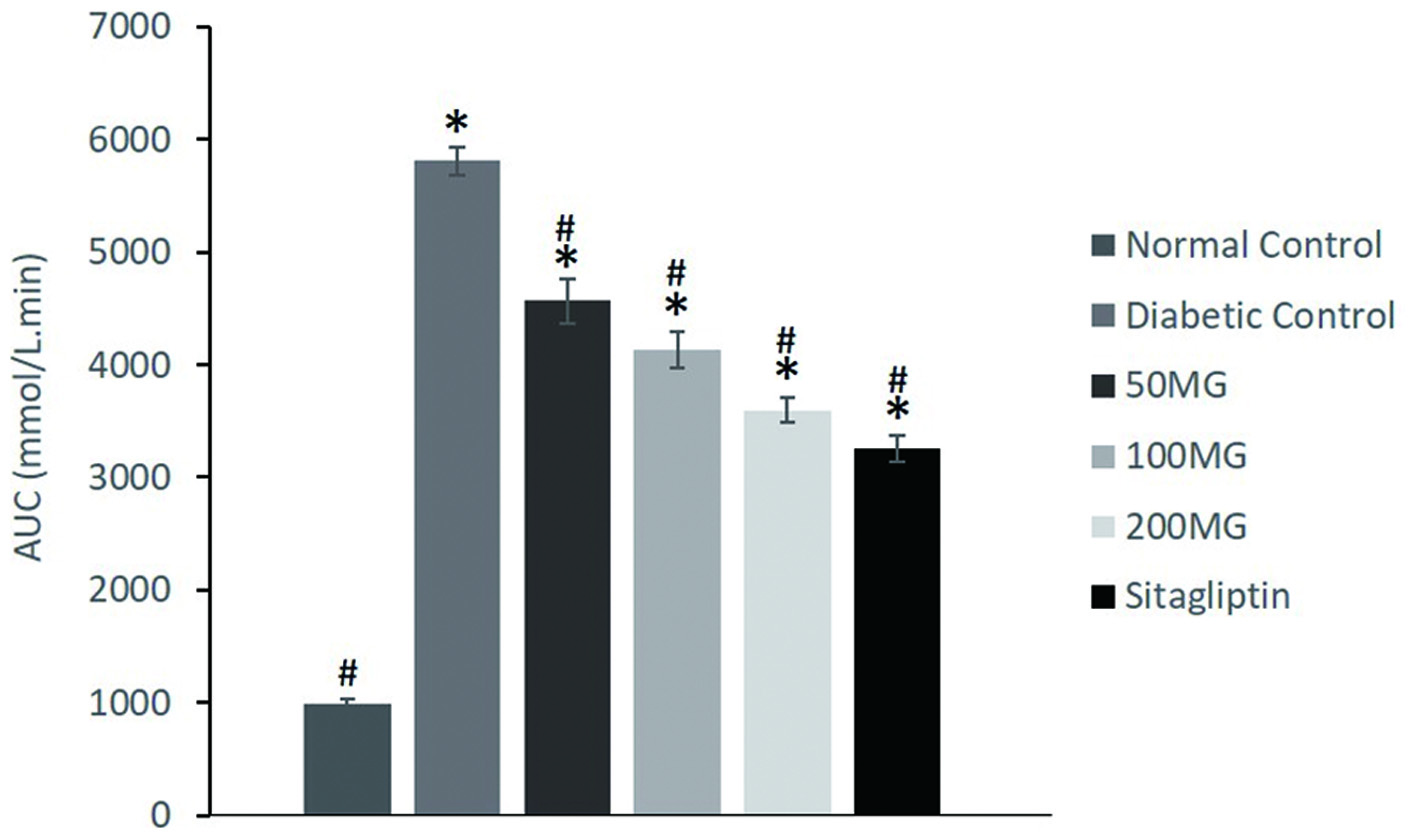
Figure 2. The effects of M. glabra extract on AUC of glucose values at 0–120 min after glucose load of experimental rats. Data are shown as mean ± standard deviation. *(p < 0.05) versus normal control; #(p < 0.05) versus diabetic control. 50MG: Group received 50 mg/kg of M. glabra extract; 100MG: Group received 100 mg/kg of M. glabra extract; 200MG: Group received 200 mg/kg of M. glabra extract; SITA: Group received 10 mg/kg of sitagliptin.
Figure 3.
Figure 3. Structures of compounds 1 to 5.

Tables

Table 1. Effects of M. glabra leaves extract on body weight gain and selected liver and kidney function indices in acute toxicity study
 
ParametersAnimal Groups
Control2000MG
Data are shown as mean ± standard deviation. *(p < 0.05) versus Control. 2000MG: Group received 2,000 mg/kg of M. glabra extract.
1st week body weight gain (%)11.20 ± 2.1311.60 ± 0.74
2nd week body weight gain (%)11.62 ± 3.0211.95 ± 2.24
ALT (U/L)46.00 ± 5.1445.31 ± 6.66
AST (U/L)171.67 ± 19.08172.12 ± 16.67
ALP (U/L)202.00 ± 7.07201.00 ± 8.38
Creatinine (μmol/L)39.00 ± 2.3640.00 ± 3.61
Urea (mmol/L)9.20 ± 0.818.90 ± 1.15
Sodium (mmol/L)148.33 ± 3.05146.50 ± 1.53
Potassium (mmol/L)5.10 ± 0.265.10 ± 0.21
Chloride (mmol/L)102.67 ± 2.31102.00 ± 1.00


Table 2. Body weight of experimental rats on 0, 14th, and 28th day of treatment period
 
GroupsBody weight (g)
0 day14th day28th day
Data are shown as mean ± standard deviation. *(p < 0.05) versus NC; #(p < 0.05) versus DC. NC: Normal Control; DC: Diabetic control; 50MG: Group received 50 mg/kg of M. glabra extract; 100MG: Group received 100 mg/kg of M. glabra extract; 200MG: Group received 200 mg/kg of M. glabra extract; SITA: Group received 10 mg/kg of sitagliptin.
NC249.26 ± 5.04#259.41 ± 6.98272.33 ± 6.24#
DC283.88 ± 6.83*266.54 ± 4.97252.67 ± 10.72*
50MG275.77 ± 7.75*271.91 ± 5.11268.99 ± 8.13
100MG273.56 ± 9.77*275.78 ± 9.06278.10 ± 9.97#
200MG284.82 ± 10.07*288.40 ± 7.83*297.36 ± 6.90#*
SITA272.42 ± 7.13*279.06 ± 5.95291.11 ± 6.64#*


Table 3. Fasting blood glucose (FBG) levels of experimental rats on 0, 14th, and 28th day of treatment period
 
GroupsBody weight (g)
0 day14th day28th day
Data are shown as mean ± standard deviation. a(p < 0.05) versus 0 day; *(p < 0.05) versus normal control; #(p < 0.05) versus diabetic control. 50MG: Group received 50 mg/kg of M. glabra extract; 100MG: Group received 100 mg/kg of M. glabra extract; 200MG: Group received 200 mg/kg of M. glabra extract; SITA: Group received 10 mg/kg of sitagliptin.
Normal Control4.40 ± 0.17#4.43 ± 0.16#4.40 ± 0.10#
Diabetic Control22.87 ± 2.31*23.80 ± 1.21*24.47 ± 1.65*
50MG20.93 ± 1.15*20.27 ± 1.56*19.63 ± 1.79*#
100MG22.47 ± 1.46*21.28 ± 2.80*19.32 ± 1.95 a*#
200MG20.87 ± 1.04*17.94 ± 0.65a*#15.52 ± 0.73 a*#
SITA23.50 ± 0.99*17.01 ± 0.42 a *#14.60 ± 1.58 a*#


Table 4. Serum DPP-4, GLP-1, and insulin levels of experimental rats
 
GroupsParameters
DPP-4 (ng/mL)GLP-1 (pmol/L)Insulin (ng/mL)
Data are shown as mean ± standard deviation. *(p < 0.05) versus NC; #(p < 0.05) versus DC. NC: Normal control; DC: Diabetic control; 50MG: Group received 50 mg/kg of M. glabra extract; 100MG: Group received 100 mg/kg of M. glabra extract; 200MG: Group received 200 mg/kg of M. glabra extract; Sitagliptin: Group received 10 mg/kg of sitagliptin.
NC3.76 ± 0.18#24.01 ± 1.59#4.36 ± 0.72#
DC4.96 ± 0.06*7.50 ± 1.05*1.29 ± 0.48*
50MG4.48 ± 0.35*8.57 ± 0.73*1.82 ± 0.53*
100MG4.34 ± 0.09*#10.04 ± 1.71*2.35 ± 0.85*
200MG4.13 ± 0.14*#13.05 ± 0.11*#2.87 ± 0.67*#
Sitagliptin4.06 ± 0.05#15.95 ± 0.75*#3.57 ± 0.09*#


Table 5. Serum lipid, liver, and kidney profile indices of experimental rats.
 
ParametersGroups
NCDC50MG100MG200MGSITA
Data are shown as mean ± standard deviation. *(p < 0.05) versus NC; #(p < 0.05) versus DC. NC: Normal control; DC: Diabetic control; 50MG: Group received 50 mg/kg of M. glabra extract; 100MG: Group received 100 mg/kg of M. glabra extract; 200MG: Group received 200 mg/kg of M. glabra extract; SITA: Group received 10 mg/kg of sitagliptin.
TC (mmol/L)1.70 ± 0.08#2.85 ± 0.07*2.13 ± 0.11*#2.04 ± 0.08*#1.86 ± 0.06*#1.90 ± 0.03*#
TG (mmol/L)0.51 ± 0.04#1.85 ± 0.07*1.15 ± 0.01*#0.93 ± 0.06*#0.66 ± 0.06#0.78 ± 0.12#
LDL (mmol/L)0.21 ± 0.04#1.16 ± 0.13*0.88 ± 0.10*#0.85 ± 0.06*#0.50 ± 0.07*#0.55 ± 0.09*#
HDL (mmol/L)1.45 ± 0.07#0.48 ± 0.06*0.91 ± 0.09*#1.07 ± 0.11*#1.28 ± 0.10*#1.30 ± 0.02*#
ALT (U/L)28.93 ± 8.68#107.95 ± 9.69*62.05 ± 8.70*#44.90 ± 13.58#32.35 ± 2.76#38.25 ± 2.05#
AST (U/L)81.97 ± 8.68#271.90 ± 39.17*140.50 ± 10.61*#98.80 ± 8.77*#89.85 ± 1.06#86.85 ± 2.47#
ALP (U/L)54.57 ± 7.87#448.20 ± 11.31*152.95 ± 13.08*#166.40 ± 12.87*#126.70 ± 16.83*#126.35 ± 7.57*#
Urea (mmol/L)5.28 ± 0.59#9.56 ± 1.34*7.66 ± 0.18*5.95 ± 0.37*#4.90 ± 1.12*#4.26 ± 0.86*#
Creatinine (μmol/L)34.80 ± 0.71#41.45 ± 0.64*39.25 ± 1.48*34.25 ± 0.07#34.90 ± 0.85#33.45 ± 2.62#
Sodium (mmol/L)146.50 ± 0.71#136.00 ± 1.41*136.50 ± 0.71*138.00 ± 1.41*142.50 ± 0.71#149.00 ± 4.24#
Potassium (mmol/L)4.70 ± 0.424.60 ± 0.575.25 ± 0.644.95 ± 0.075.25 ± 0.354.95 ± 0.78
Chloride (mmol/L)98.00 ± 2.8394.50 ± 3.5492.00 ± 1.4197.00 ± 1.41100.00 ± 5.6696.50 ± 6.61


Table 6. DPP-4 and α-amylase inhibitory activities of isolated phytoconstituents of M. glabra leaves extract
 
CompoundsIC50 (μg/mL)
DPP-4α-amylase
ND: Not detected where IC50 exceeded concentration tested (1,000 μg/mL); NA: Not applicable. All values were expressed as mean ± standard deviation of triplicates. Data with different superscript (a, b, c, d) in the same column were considered significant (p < 0.05).
p-geranyl coumaric acid (1)NDND
Stigmasterol (2)ND125.47 ± 6.69b (304.02 ± 16.20 μM)
Scopoletin (3)6.98 ± 0.53b (36.34 ± 2.80 μM)79.24 ± 3.52a (412.36 ± 18.31 μM)
Evolitrine (4)NDND
Pachypodol (5)22.83 ± 0.79c (66.34 ± 2.30 μM)209.27 ± 17.19d (608.20 ± 49.95 μM)
Sitagliptin0.01 ± 0.01a (0.03 ± 0.01 μM)NA
AcarboseNA182.31 ± 6.42c (282.38 ± 9.95 μM)