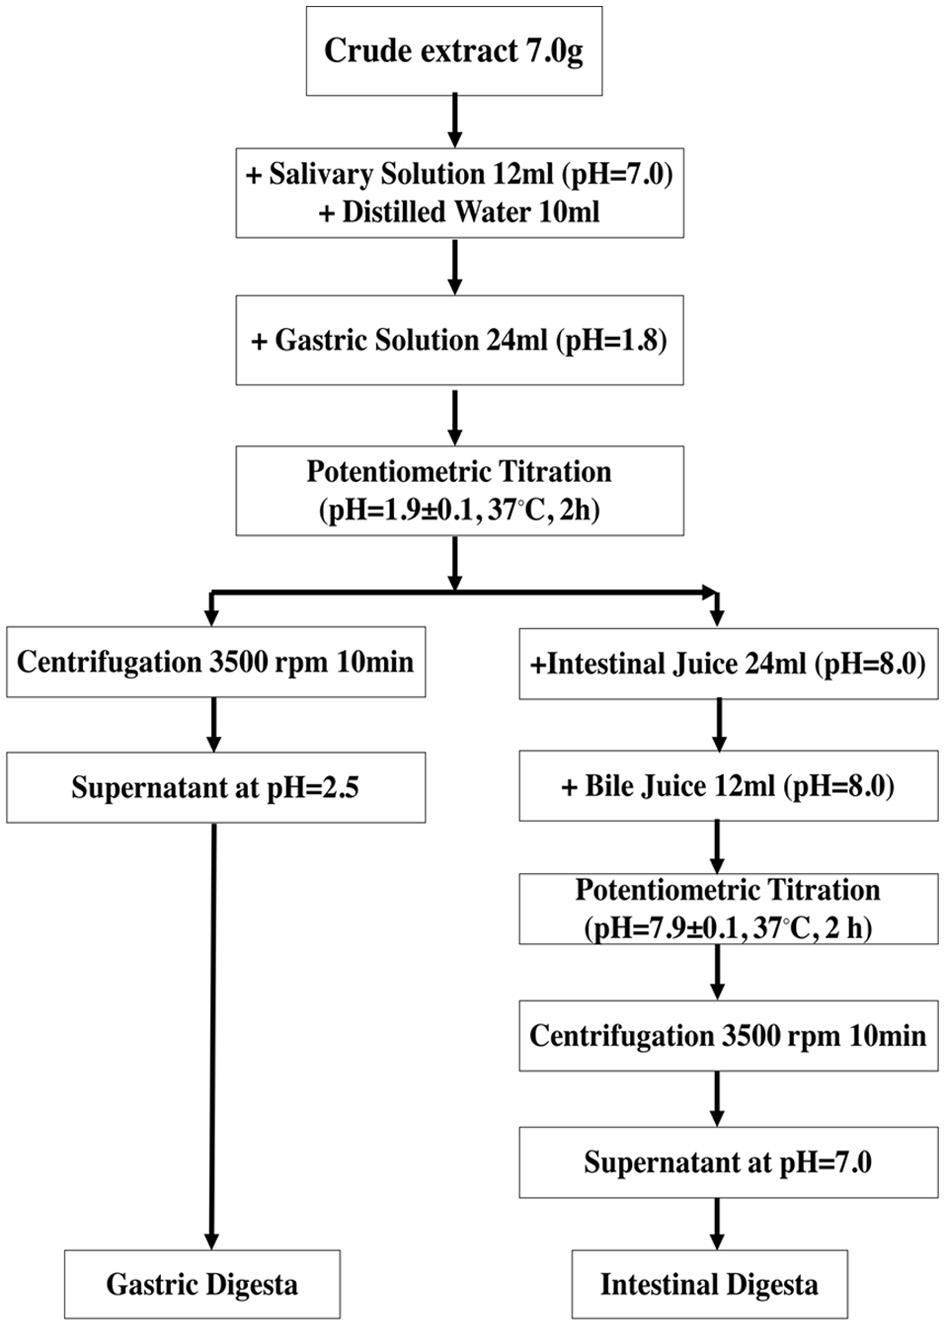
Figure 1. Simulated in vitro digestion process.
| Journal of Food Bioactives, ISSN 2637-8752 print, 2637-8779 online |
| Journal website www.isnff-jfb.com |
Original Research
Volume 18, June 2022, pages 98-108
Fate of polyphenols in black goji berry (Lycium ruthenicum Murr.) upon in vitro and in vivo digestion
Figures
Tables
| Crude extract | In vitro gastric digesta | In vitro Intestinal digesta | In vivo intestinal digesta | ||
|---|---|---|---|---|---|
| The data is expressed as mean ± standard deviation on the basis of dry weight. In each column, values marked with same letter present no significant difference (p > 0.05). | |||||
| TPC (mg GAE/g) | 49.47 ± 1.89a | 41.01 ± 2.09b | 25.84 ± 1.5c | 25.04 ± 2.10c | |
| % Recovery | 100 | 82.9 | 52.23 | 50.62 | |
| TFC (mg CE/g) | 13.86 ± 0.31a | 9.05 ± 0.56b | 8.22 ± 0.69b | 5.57 ± 0.02c | |
| % Recovery | 100 | 65.30 | 59.31 | 40.19 | |
| CTC (mg CE/g) | 25.96 ± 1.64a | 20.86 ± 1.80b | 11.65 ± 0.83c | 7.00 ± 0.45d | |
| % Recovery | 100 | 80.35 | 44.88 | 26.96 | |
| MAC (mg/g) | 154.70 ± 0.96a | 114.18 ± 4.52b | 35.09 ± 0.88c | 7.06 ± 0.68d | |
| %Recovery | 100 | 73.81 | 22.68 | 4.56 | |
| ABTS (mmole TE/g) | 202.89 ± 1.82a | 154.92 ± 4.64bc | 164.45 ± 12.96b | 141.29 ± 4.34c | |
| %Recovery | 100 | 76.36 | 81.05 | 69.64 | |
| DPPH (mmole TE/g) | 151.34 ± 1.69a | 71.05 ± 3.66b | 64.51 ± 2.82c | 23.23 ± 1.02d | |
| %Recovery | 100 | 46.94 | 42.62 | 15.35 | |
| FRAP (mmole TE/g) | 64.43 ± 0.89a | 57.37 ± 1.08b | 34.06 ± 0.99c | 25.53 ± 1.35d | |
| %Recovery | 100 | 89.04 | 52.86 | 39.62 | |
| Crude extract (7.0 g) | In vitro gastric digesta (6.25 g) | In vitro Intestinal digesta (5.37 g) | ||
|---|---|---|---|---|
| TPC (mg GAE) | 346.29 | 256.31 | 138.76 | |
| % Loss | 0 | 25.98 | 59.93 | |
| TFC (mg CE) | 97.02 | 56.56 | 44.14 | |
| % Loss | 0 | 41.70 | 54.50 | |
| CTC (mg CE) | 181.72 | 130.38 | 62.56 | |
| % Loss | 0 | 28.25 | 65.57 | |
| MAC (mg) | 1082.9 | 713.63 | 188.43 | |
| % Loss | 0 | 34.10 | 82.60 | |
| ABTS (mmol TE) | 1420.23 | 968.25 | 883.10 | |
| % Loss | 0 | 31.82 | 37.82 | |
| DPPH (mmol TE) | 1059.38 | 444.06 | 346.42 | |
| % Loss | 0 | 58.08 | 67.30 | |
| FRAP (mmol of Fe 2+E) | 4.51 | 3.59 | 1.83 | |
| % Loss | 0 | 20.40 | 59.42 | |