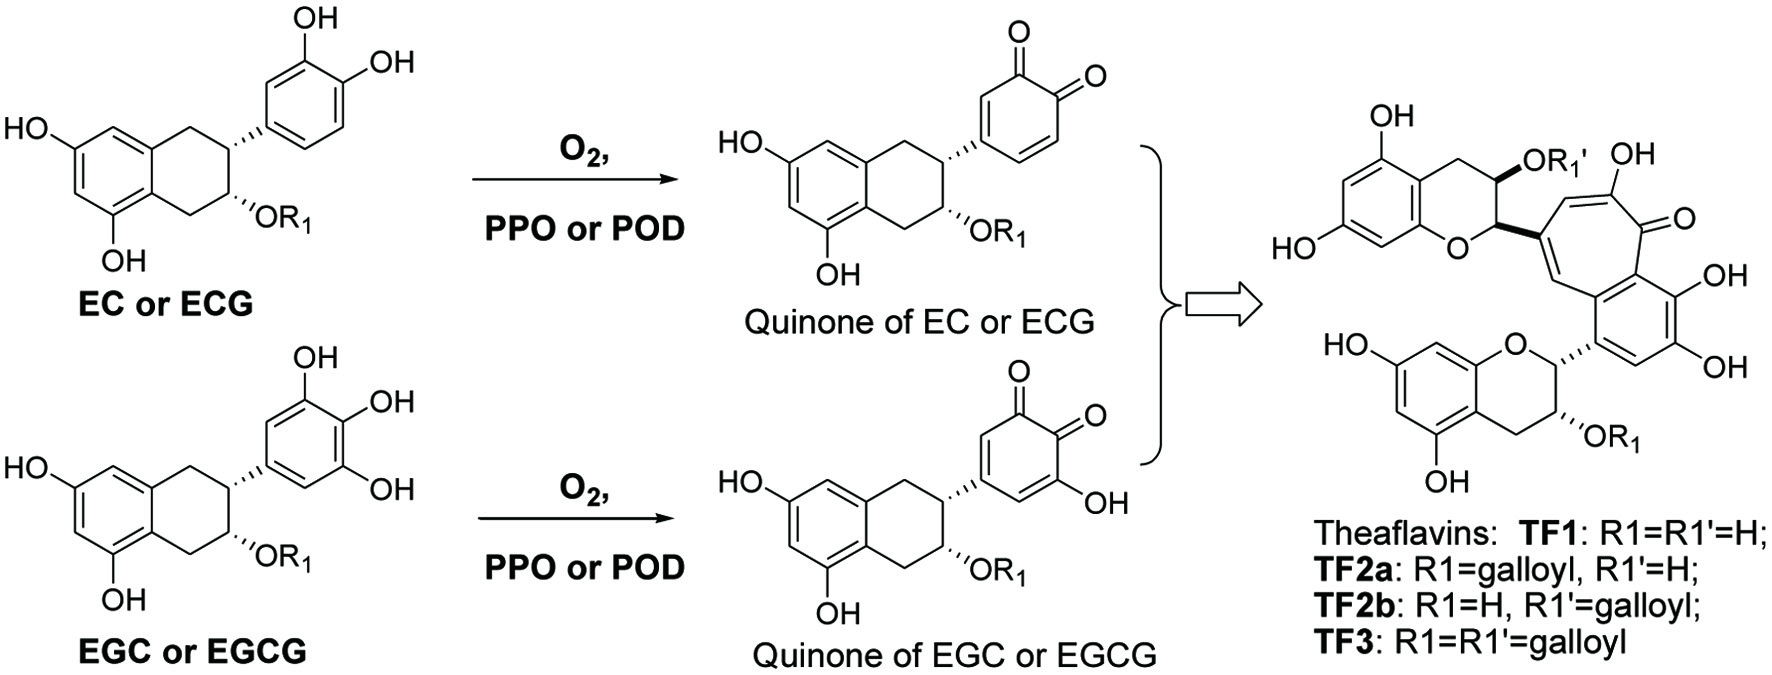
Figure 1. Formation of black tea theaflavins.
| Journal of Food Bioactives, ISSN 2637-8752 print, 2637-8779 online |
| Journal website www.isnff-jfb.com |
Mini-Review
Volume 17, March 2022, pages 2-5
Selection of polyphenol oxidase affects biotransformation efficacy of targeted theaflavins
Figure
Tables
| Plants | Plant parts | Temp-erature (°C) | pH | Time (min) | Catechin concen-tration (mg/mL) | Content of theaflavins/Conversion rate | Reference |
|---|---|---|---|---|---|---|---|
| Note: Substrate of catechins was mixtures extracted from green tea. | |||||||
| Tea (Camellia sinensis) | Leaves | 37 | 4.3 | 49 | 5.59 | 0.754 mg/mL | Lin et al., 2017 |
| Tea (Camellia sinensis var. assamica cv) | Leaves | 37 | 4.0 | – | 4.5 | 0.461 mg/mL 15.31 % | Huang et al., 2017 |
| Pear (Pyrus sorotina) | fruit | 20 | 5.5 | 40 | – | 45.7% | Lin et al., 2017 |
| Pear (Echeveria ‘Sulli’) | fruit | 30 | 5.5 | 40 | 10 | 673.57 mg/g | Wang et al., 2007 |
| Pear (Pyrus spp) | fruit | 30 | 4.4 | 15 | 1 | 0.3253g/L | Xu, 2013 |
| Solanum melongena | Fruit | 30 | 4.8 | 15 | 1 | 0.2872g/L | Xu, 2013 |
| Solanum melongena | Fruit | 25 | 4.5 | 40 | 2.5 | 7.45 mg | Fang et al., 2011 |
| Solanum tuberosum | Fresh potato | 30 | – | 90 | 5 | 22.86% | Li et al., 2021 |
| Solanum tuberosum | Fresh potato | 25 | 4.8 | 45 | 1 | 0.068g/L | Xu, 2013 |
| Malus pumila | Leaves | 30 | 4.8 | 40 | 18 | 86.8% | Lin et al., 2017 |
| Musa nana Lour. | Fruit | 30 | 6.0 | 30 | 1 | 0.09g/L | Xu, 2013 |
| Dioscoreae rhizoma | Fresh root | 35 | 5.5 | 40 | 22 | 28.1% | Lin et al., 2017 |
| Ipomoea batatas | Fresh root | 25 | 6.0 | 10 | 5 | 86.9% | Lin et al., 2017 |
| Trametes trogii | Fungi extract | 36 | 4.5 | 720 | 5 | 0.2% | Lin et al., 2017 |
| Trametes trogii (CGMCC5.629) | Fungi extract | 28 | – | 60 | 10 | 10.193% | Wang et al., 2007 |
| Mushroom | Fresh mushroom | 30 | 5.5 | 40 | 10 | 44.96 mg/g | Wang et al., 2007 |
| PPO Source | PPO purity | Activity (U/mL/min) | TF1 | TF2a | TF2b | TF3 | Total TFs | Unit | Reference |
|---|---|---|---|---|---|---|---|---|---|
| Pyrus sorotina | crude | 655.50 | 451.31 (67.0%) | 132.06 (19.6%) | 82.89 (12.3%) | 7.32 (1.1%) | 673.57 (100%) | mg/g | Wang et al., 2007 |
| Pyrus pyrifolia | crude | 195.53 | 396.32 (73.0%) | 94.64 (17.4%) | 40.85 (7.5%) | 10.78 (2.0%) | 542.59 (100%) | mg/g | Wang et al., 2007 |
| Pryus nivalis | crude | 83.88 | 334.70 (66.6%) | 120.75 (24.0%) | 35.25 (7.0%) | 11.93 (2.4%) | 502.63 (100%) | mg/g | Wang et al., 2007 |
| Pyrus sinkiangensis | crude | 57.28 | 257.52 (65.3%) | 98.74 (25.1%) | 26.4 (6.7%) | 11.51 (2.9%) | 394.16 (100%) | mg/g | Wang et al., 2007 |
| Pyrus pyrifolia ‘Shineiki’ | crude | 373.83 | 232.81 (70.6%) | 44.03 (13.4%) | 45.18 (13.7%) | 7.55 (2.3%) | 329.56 (100%) | mg/g | Wang et al., 2007 |
| Camellia sinensis | crude | 128.97 | 94.50 (49.3%) | 50.30 (26.3%) | 38.60 (20.1%) | 8.20 (4.3%) | 191.60 (100%) | mg/g | Wang et al., 2007 |
| Camellia sinensis | Slat + column | 1306 | 9.25% (46.2%) | 2.55% (12.7%) | 3.71% (18.5%) | 4.50% (22.5%) | 20.01% (100%) | % | Li, 2006 |
| Camellia sinensis ‘Longjing’ | crude | – | 10.27% (22.5%) | 17.16% (37.5%) | 11.68% (25.5%) | 6.63 % (14.5%) | 45.74% (100%) | % | Lin et al., 2017 |
| Malus pumila Mill | crude | – | 1.71% (8.9%) | 10.32 % (54.0%) | 5.36 % (28.0%) | 1.73% (9.0%) | 19.12% (100%) | % | Lin et al., 2017 |
| Dioscoreae Rhizoma | Slat + column | – | 0.85% (3.3%) | 12.4% (48.6%) | 2.78% (10.9%) | 9.46% (37.1%) | 25.49% (100%) | % | Lin et al., 2017 |