Figures
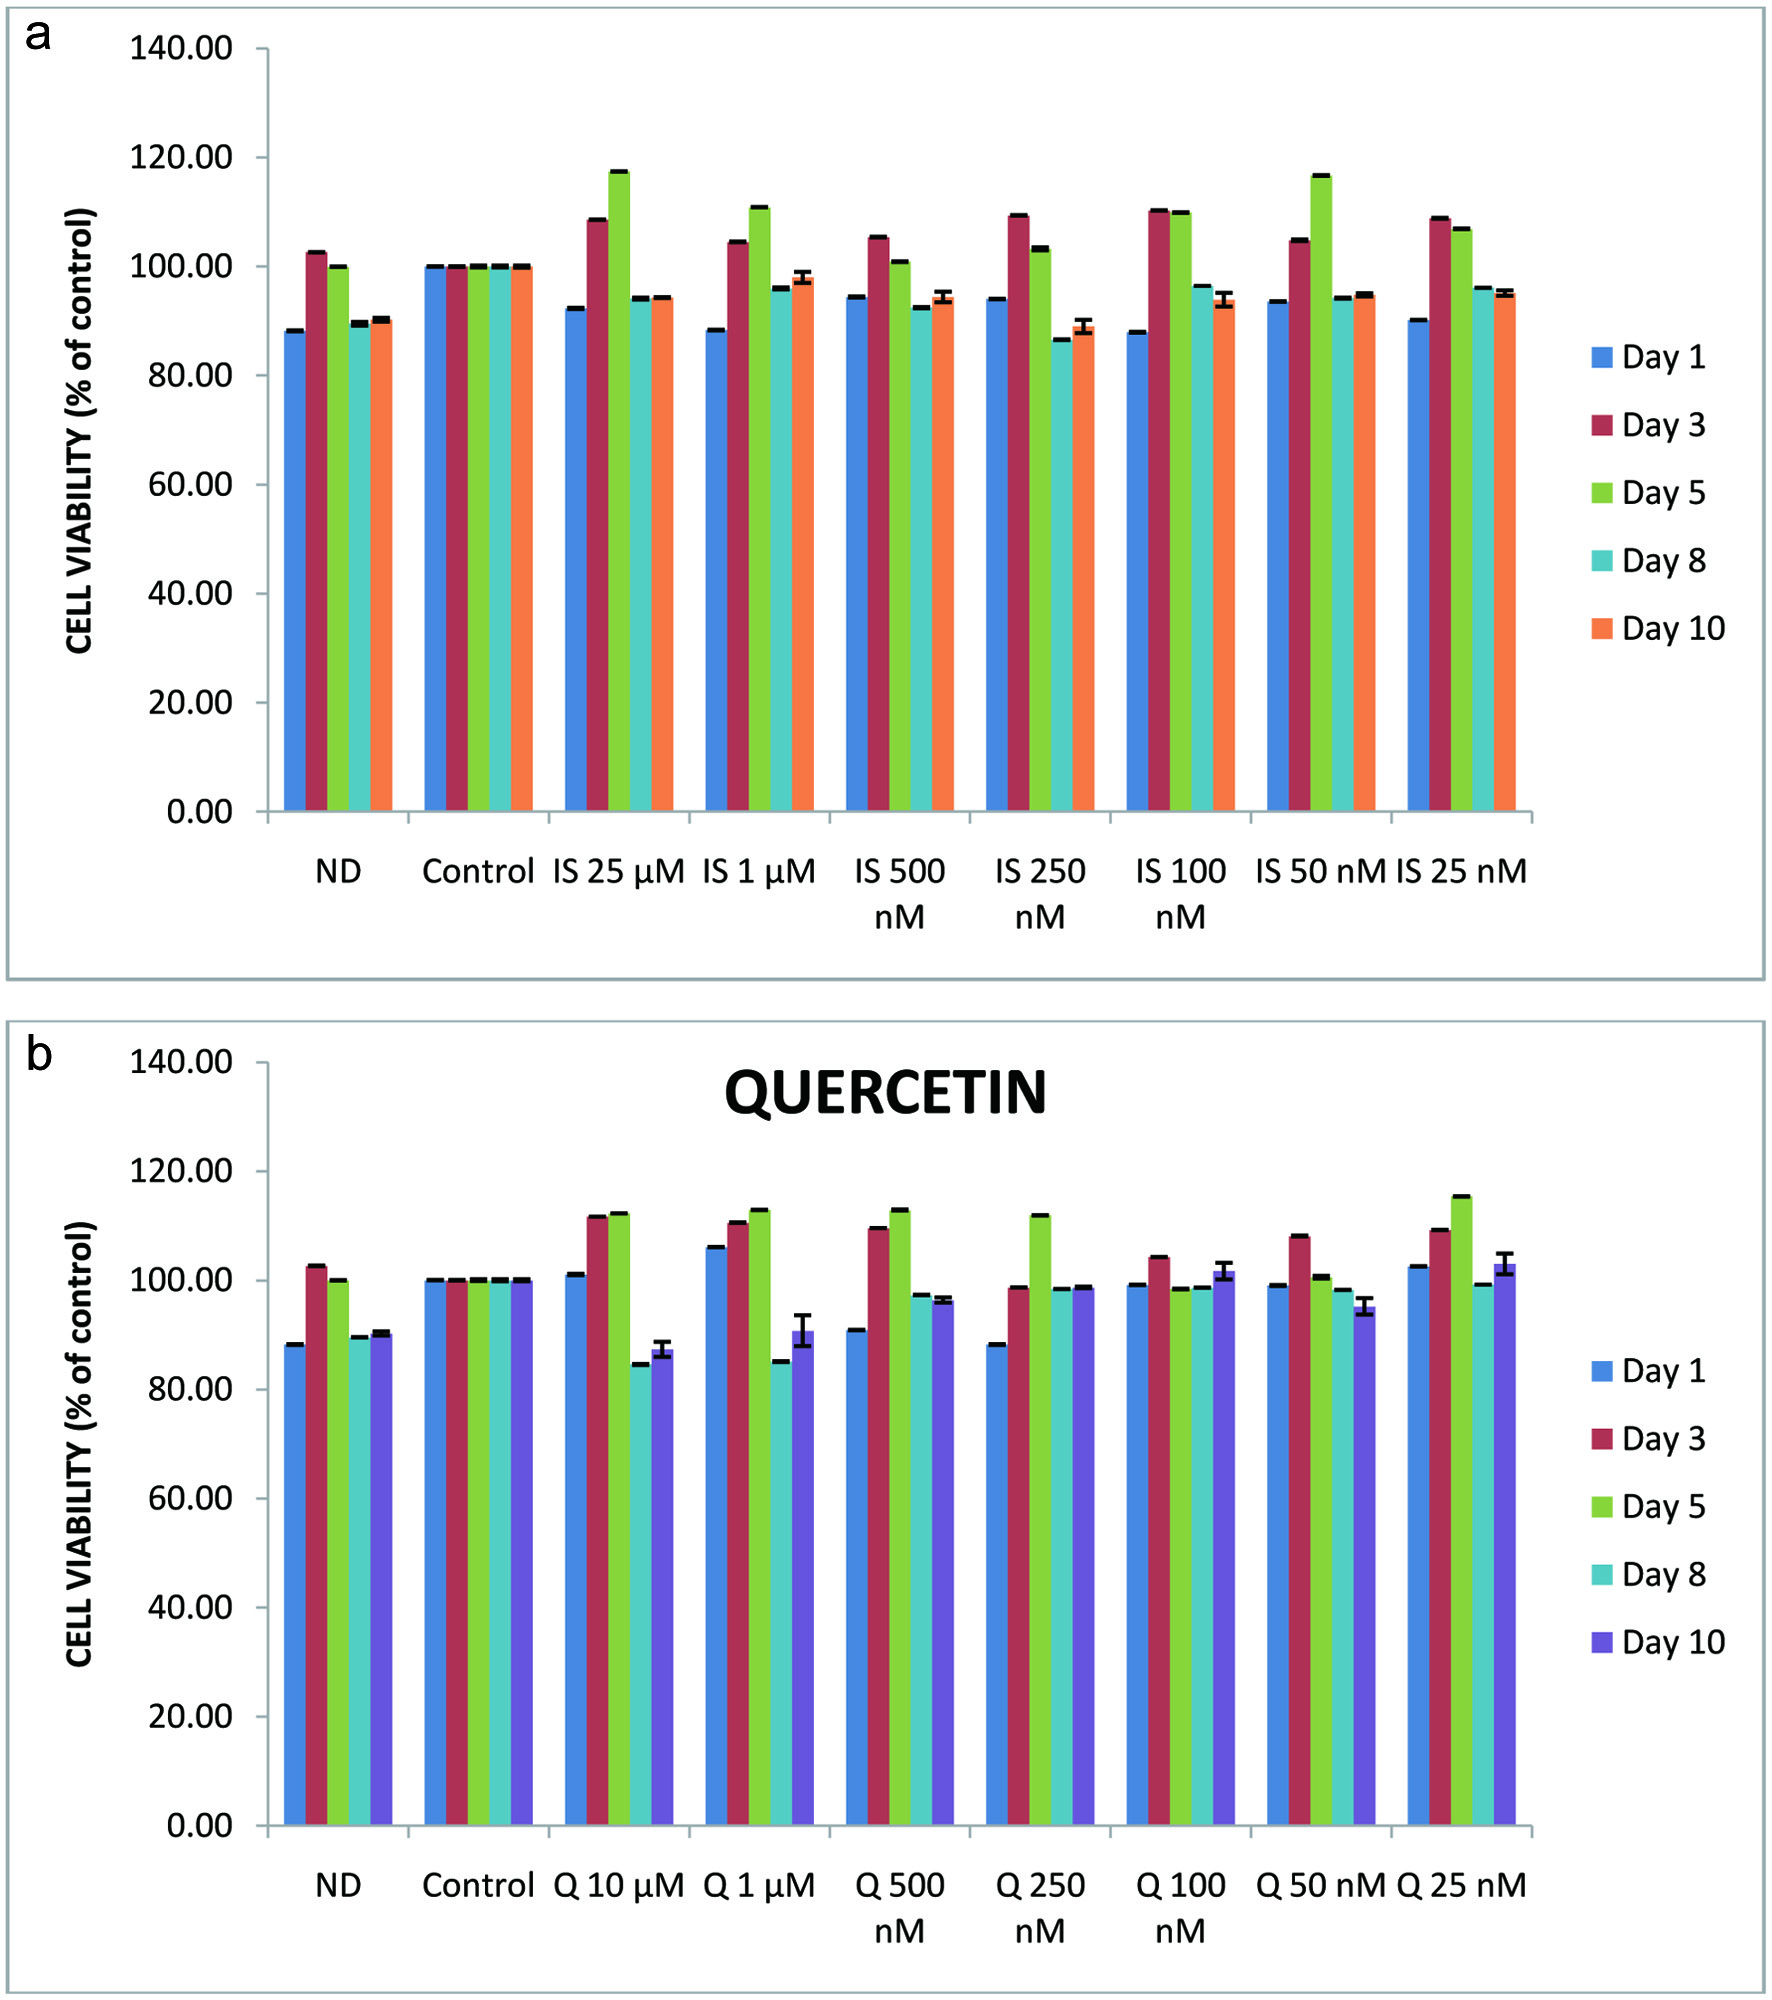
Figure 1. Effects of isorhamnetin (a) or quercetin (b) on 3T3-L1 cell viability. Non-differentiated 3T3-L1 cells were treated with isorhamnetin (0 to 25 µM) or quercetin (0 to 10 µM) for 0 to 8 days. The values are expressed as percentage of control cells.
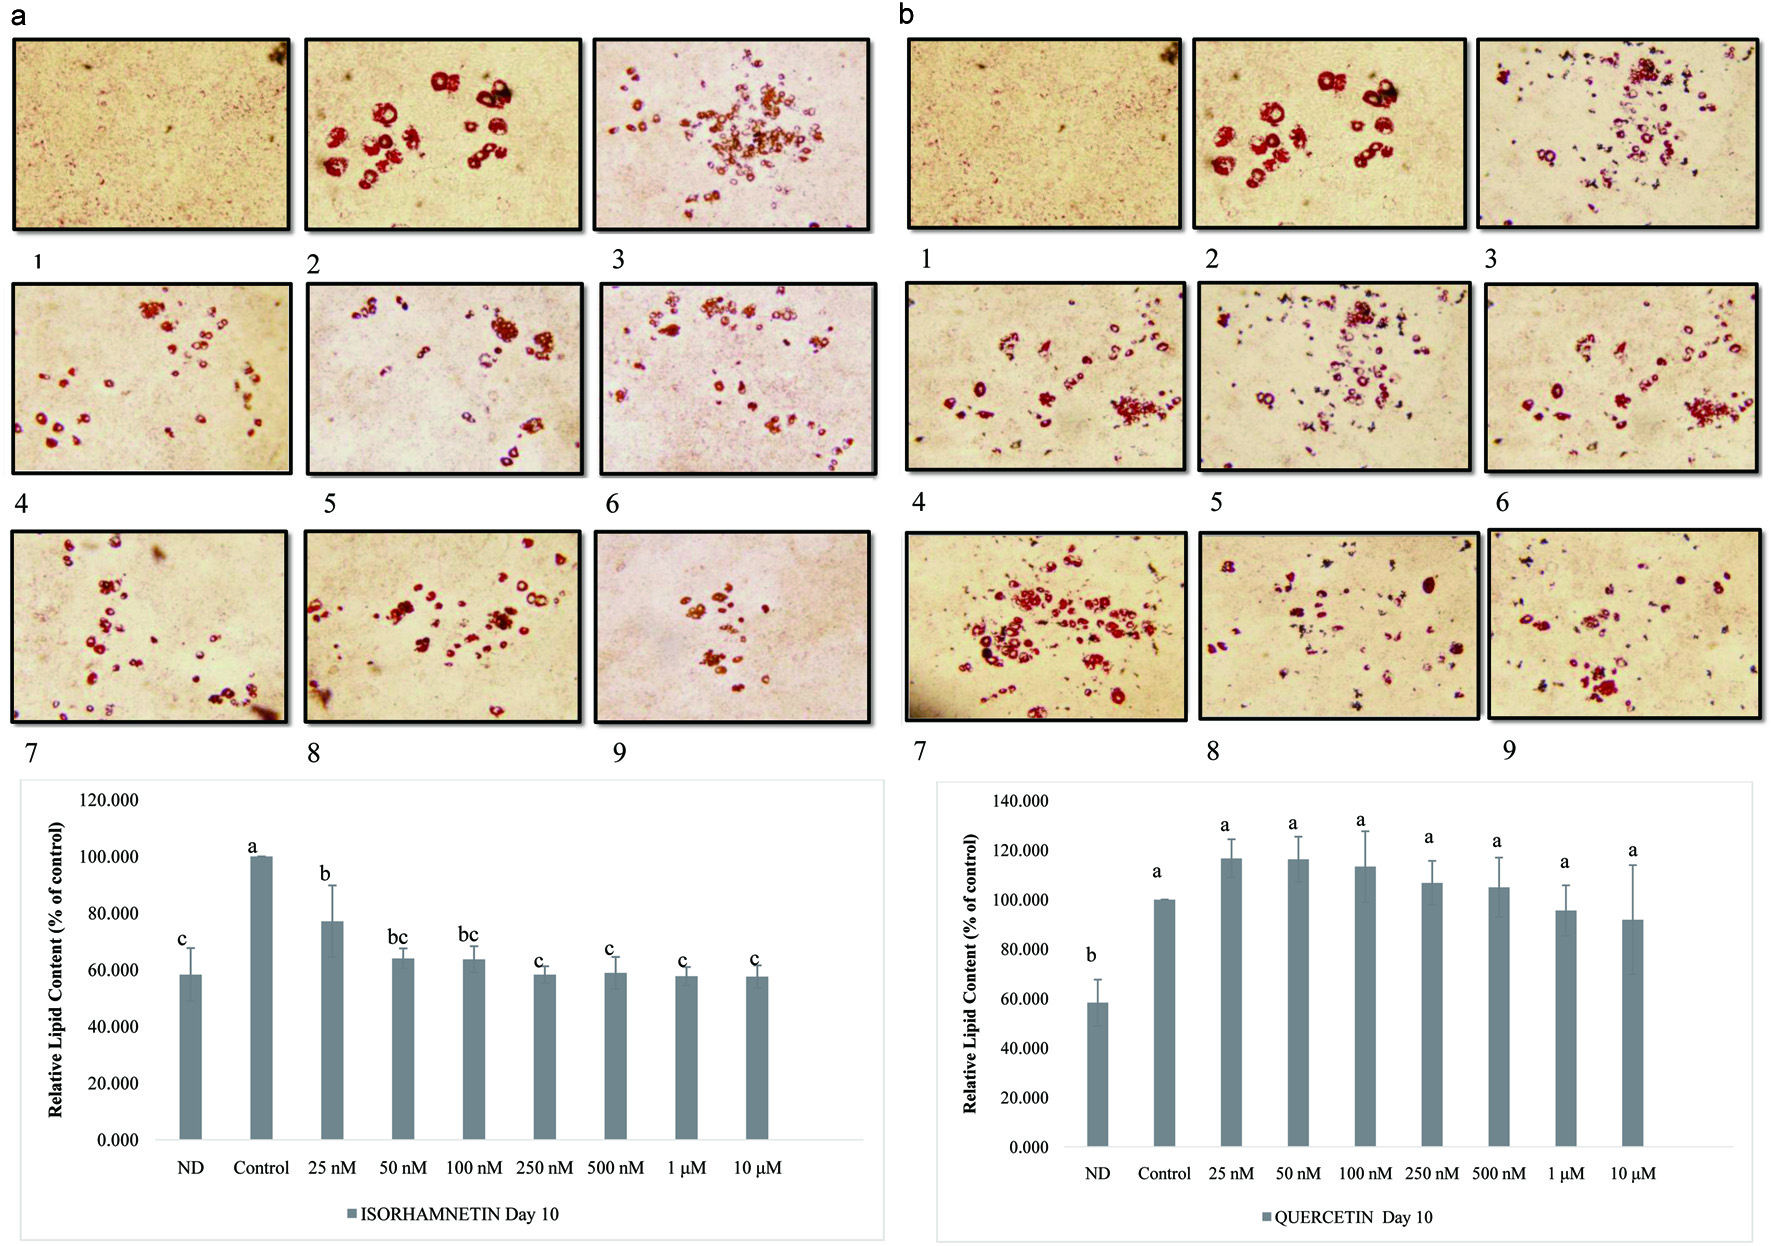
Figure 2. Effect of isorhamnetin (a) or quercetin (b) on lipid accumulation in 3T3-L1 cells. The values were expressed as percentage of control cells. Results are presented as mean ±S.D. (n = 3). Letters with different superscripts are significantly different (P < 0.05) among groups. (1) non-differentiated cells, (2) control, and from (3) to (10) 25 nM to 25 µM isorhamnetin- or quercetin-treated 3T3-L1 cells, respectively. Pictures were obtained with an OLYMPUS microscope Model DP72 and taken at 5X magnification.
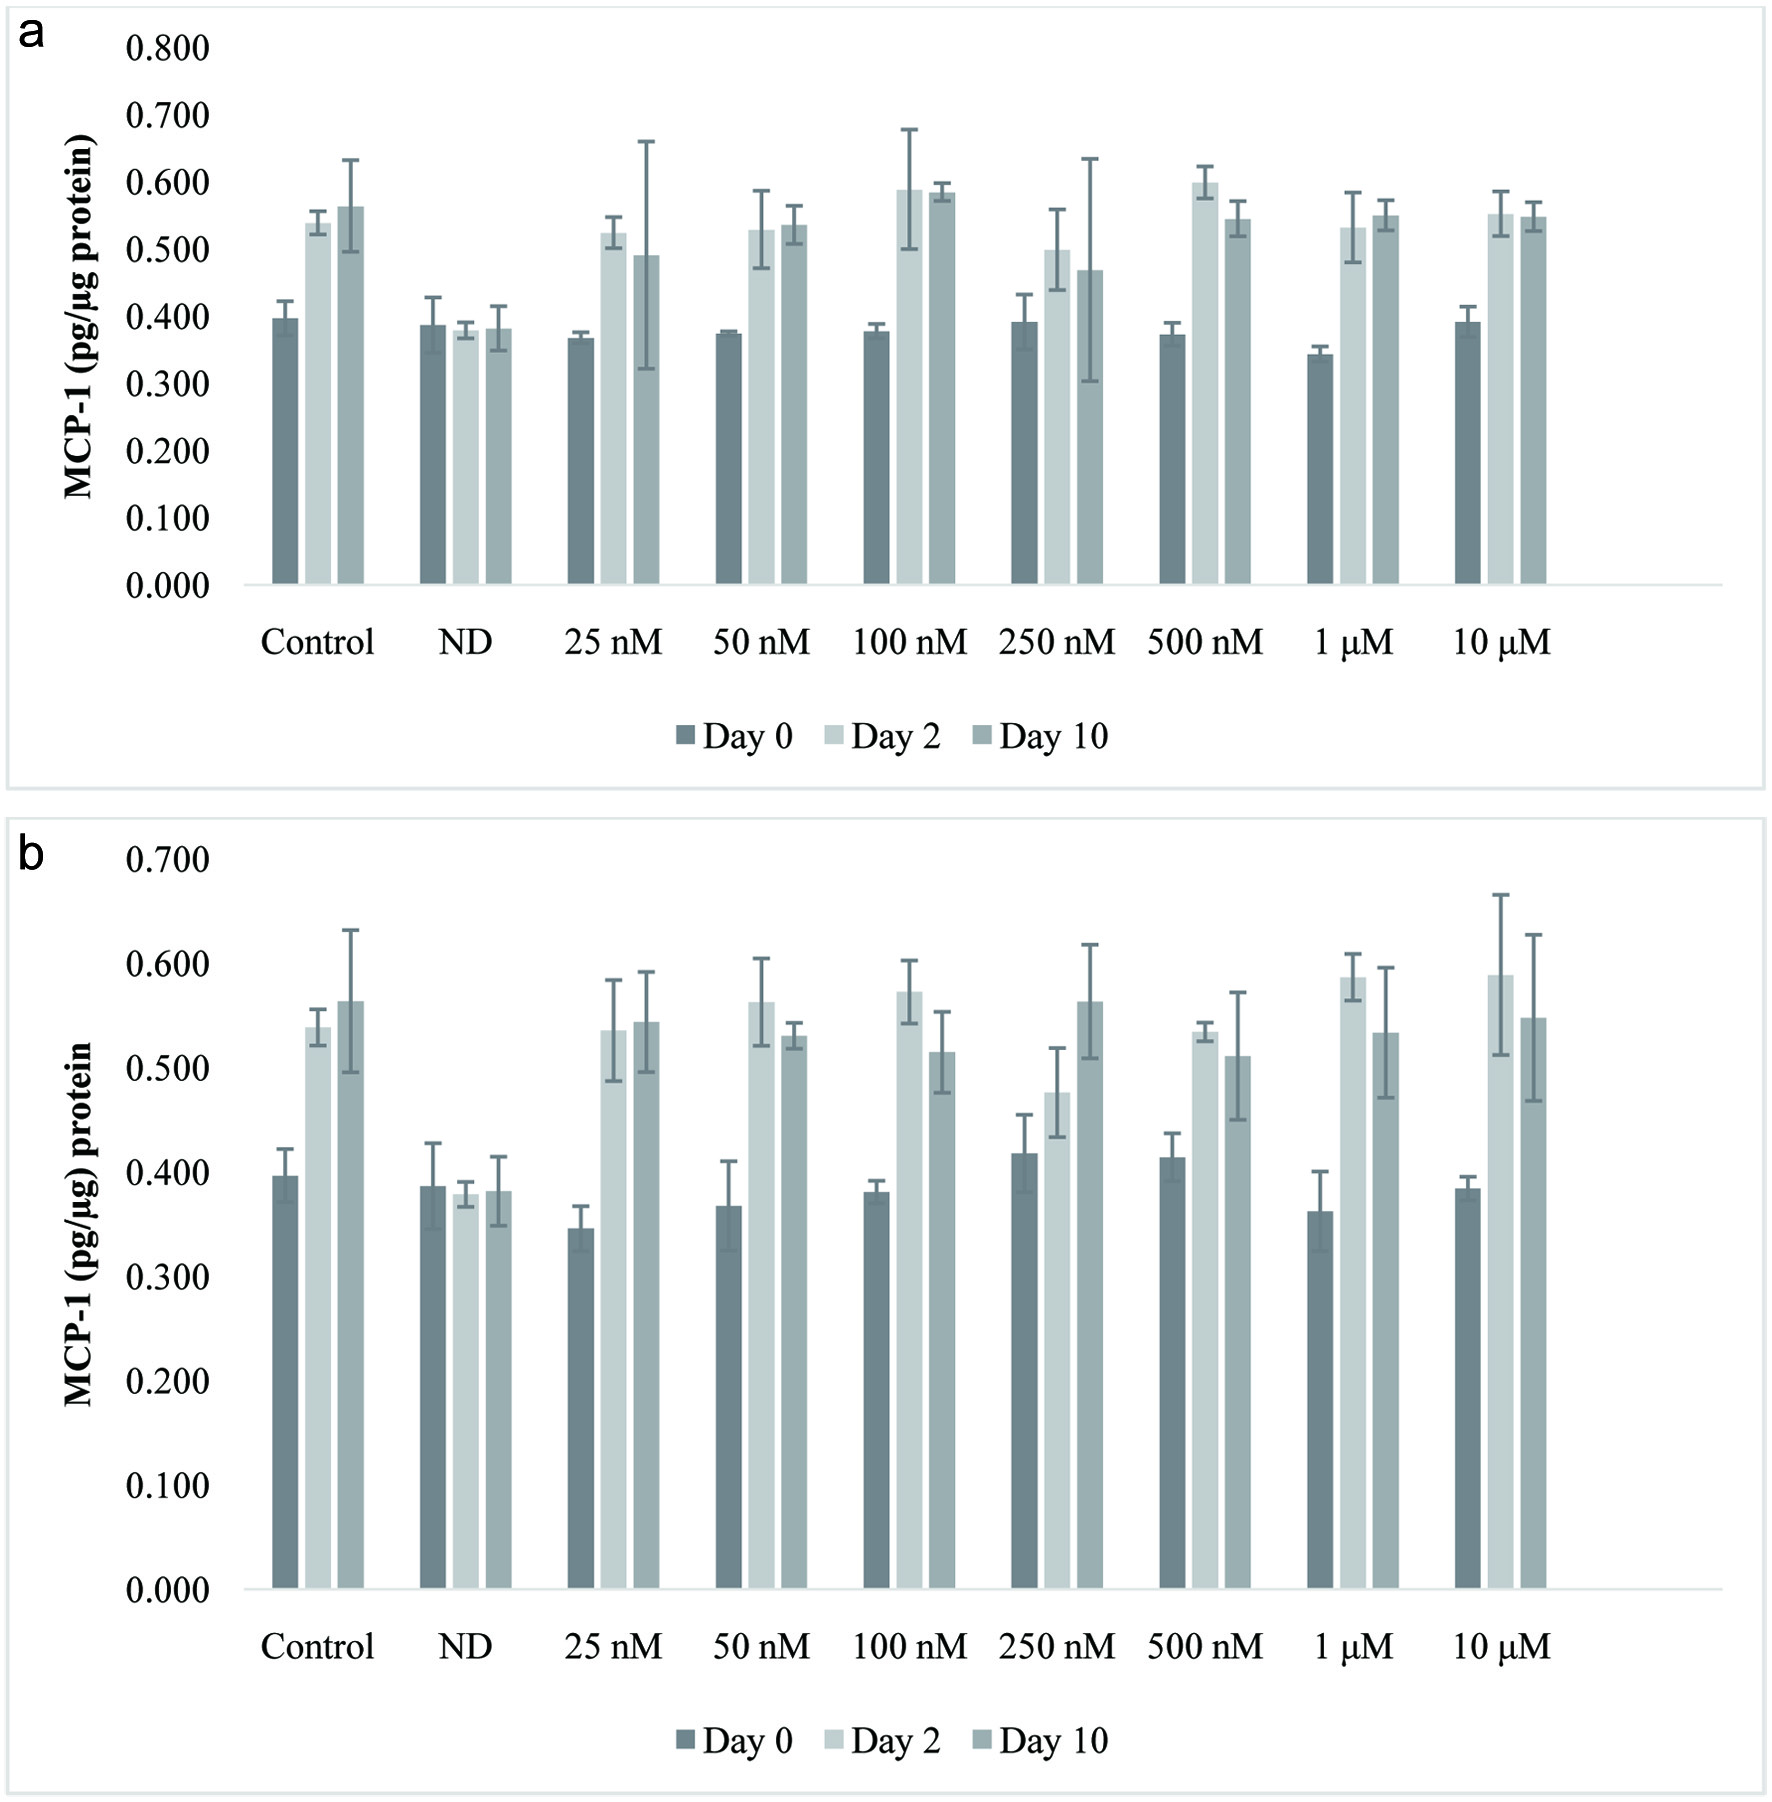
Figure 3. Effect of isorhamnetin (a) or quercetin (b) on MCP-1 levels (pg/µg protein) during 3T3-L1 adipocyte differentiation. Results are presented as mean ± S.D. (n = 3). Letters with different superscripts are significantly different (P < 0.05).
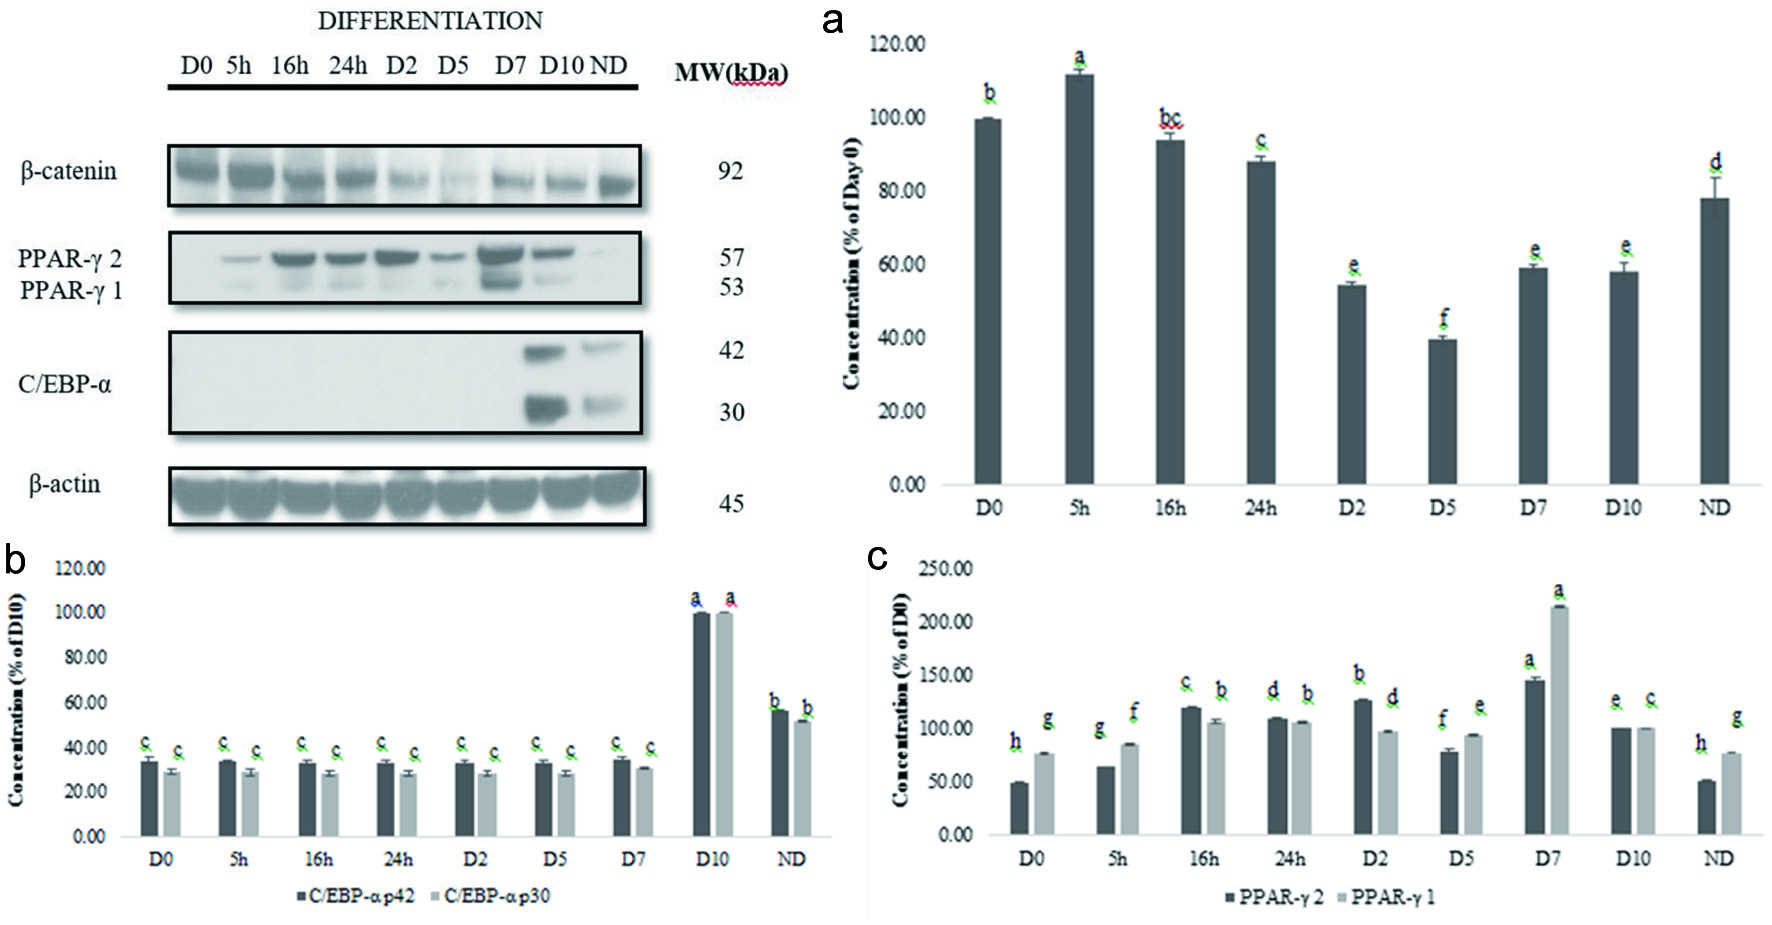
Figure 4. Expression of β-catenin, PPAR-γ1 and 2, and C/EBP-α during 3T3-L1 cell differentiation (a). Graphical representation of the expression of β-catenin (b), PPAR-γ 1 and 2 or C/EBP (c) during 3T3-L1 cell differentiation. Results are presented as mean ± S.D, (n = 3). Letters with different superscripts are significantly different (P < 0.05).
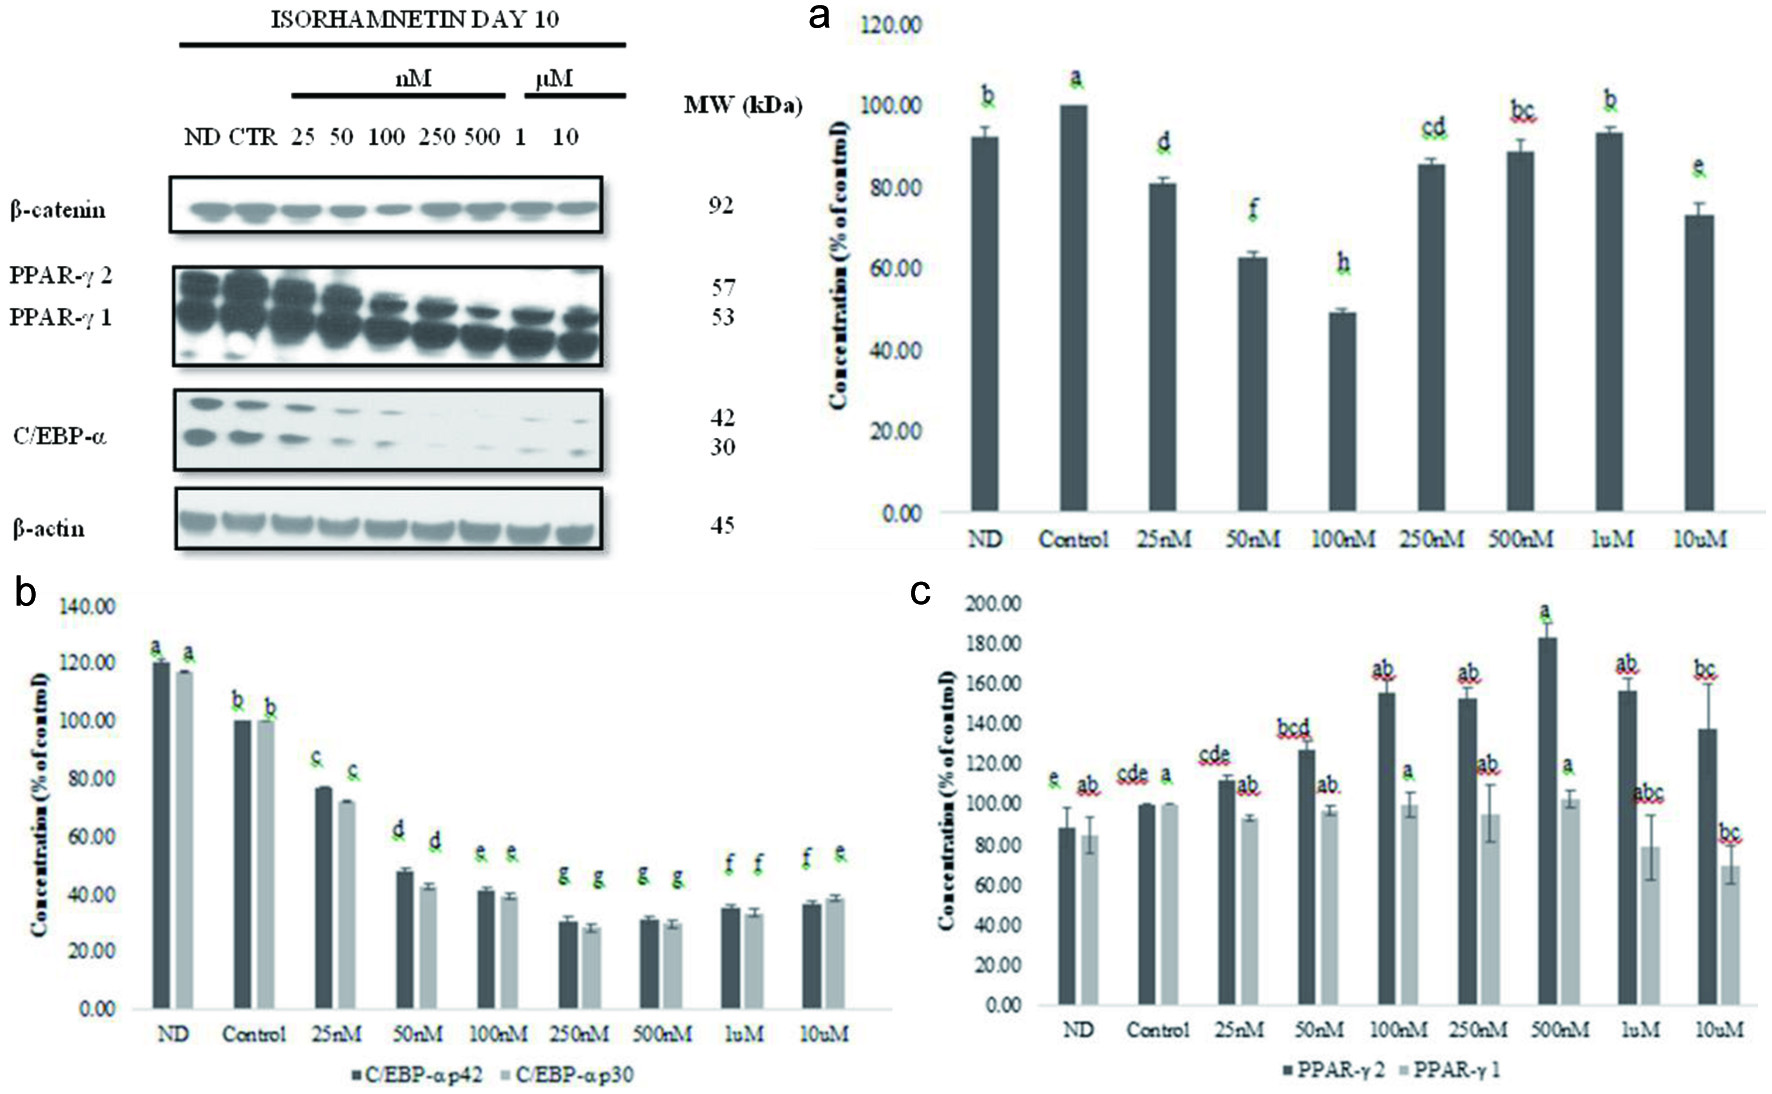
Figure 5. Effect of isorhamnetin on β-catenin, PPAR-γ1 and 2, or C/EBP during 3T3-L1 cell differentiation (a). Graphical representation of the effect of isorhamnetin on β-catenin (b), PPAR-γ1 and 2 (c) or C/EBP (b) (c) expression during 3T3-L1 cell differentiation. Results are presented as mean ± S.D, (n = 3). Letters with different superscripts are significantly different (P < 0.05).
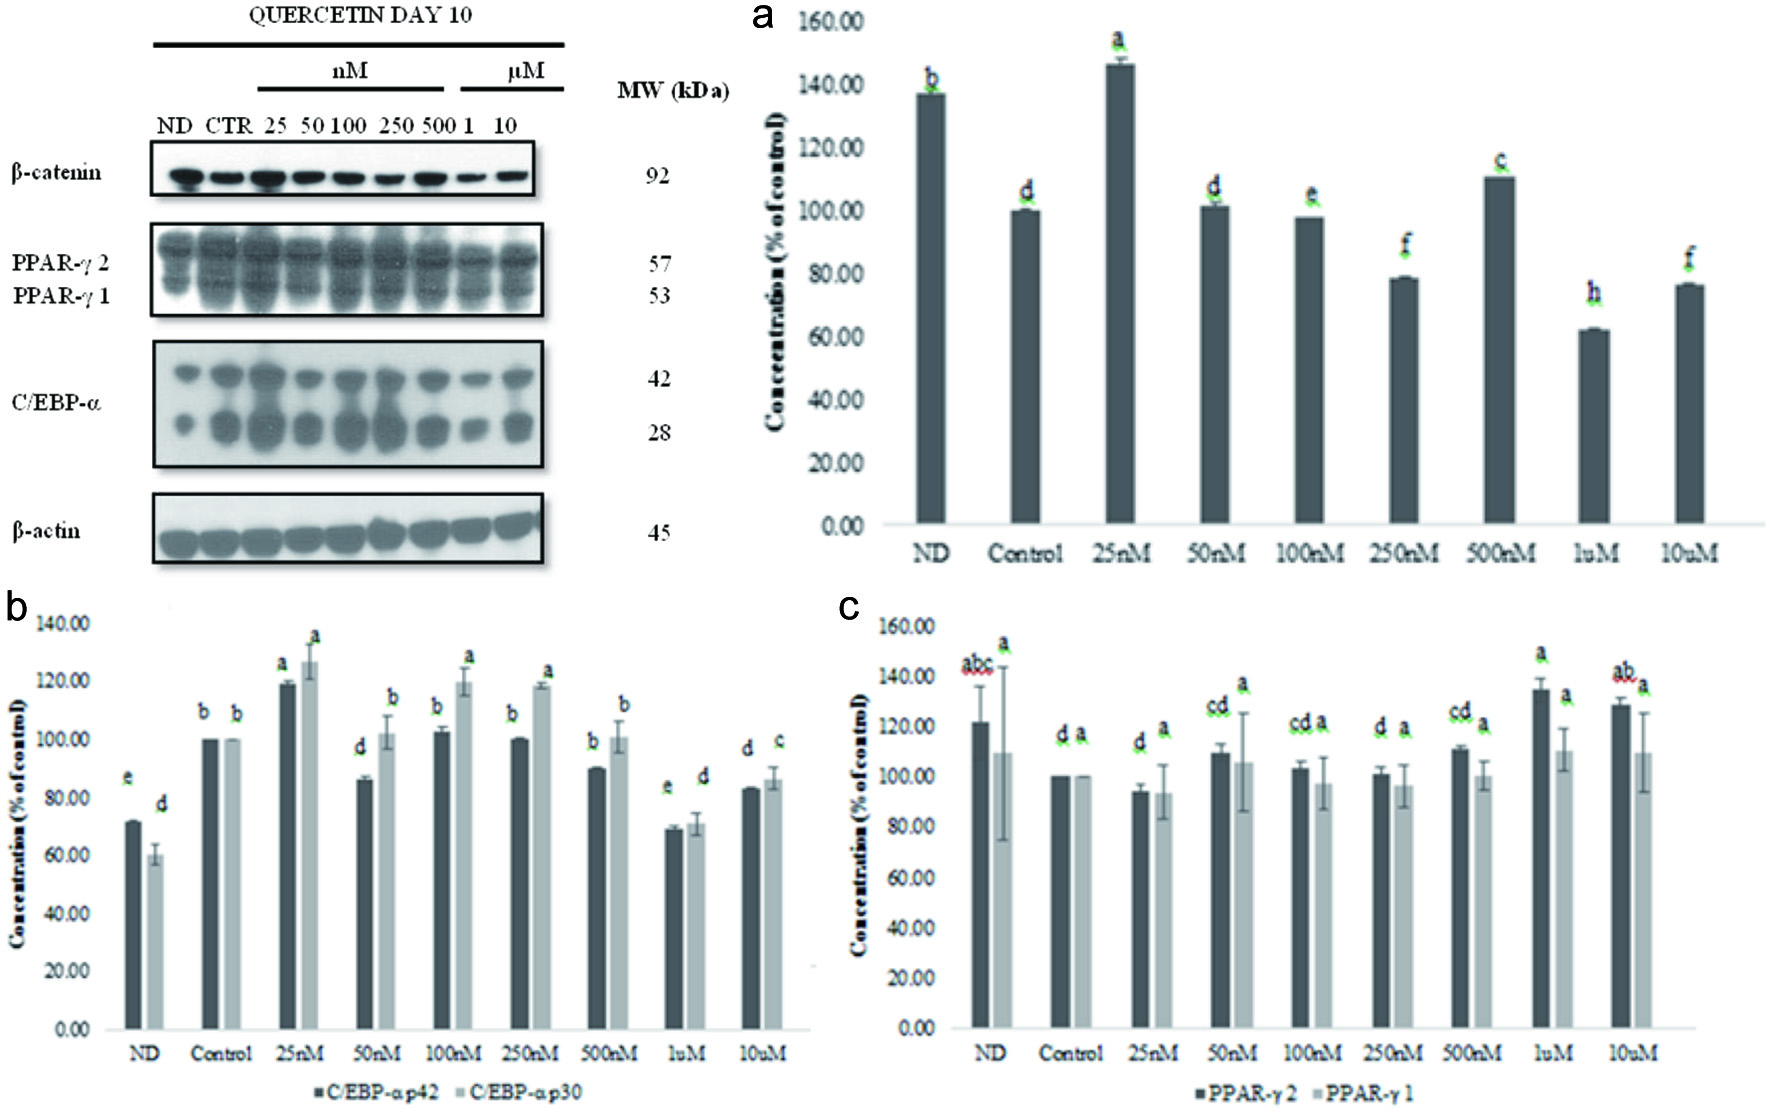
Figure 6. Effect of quercetin on β-catenin, PPAR-γ1 and 2, or C/EBP expression during 3T3-L1 cell differentiation (a). Graphical representation of the effect of quercetin on β-catenin (b), PPAR-γ 1 and 2 (c), or C/EBP (d) expression during 3T3-L1 cell differentiation. Results are presented as mean ± S.D, (n = 3). Letters with different superscripts are significantly different (P < 0.05).