Journal of Food Bioactives, ISSN 2637-8752 print, 2637-8779 online
Journal website www.isnff-jfb.com

Original Research

Volume 13, March 2021, pages 82-92


Synergies of herbal teas on improved plasma antioxidant capacity and postprandial hypoglycemic response in healthy adults

Figure

Figure 1.
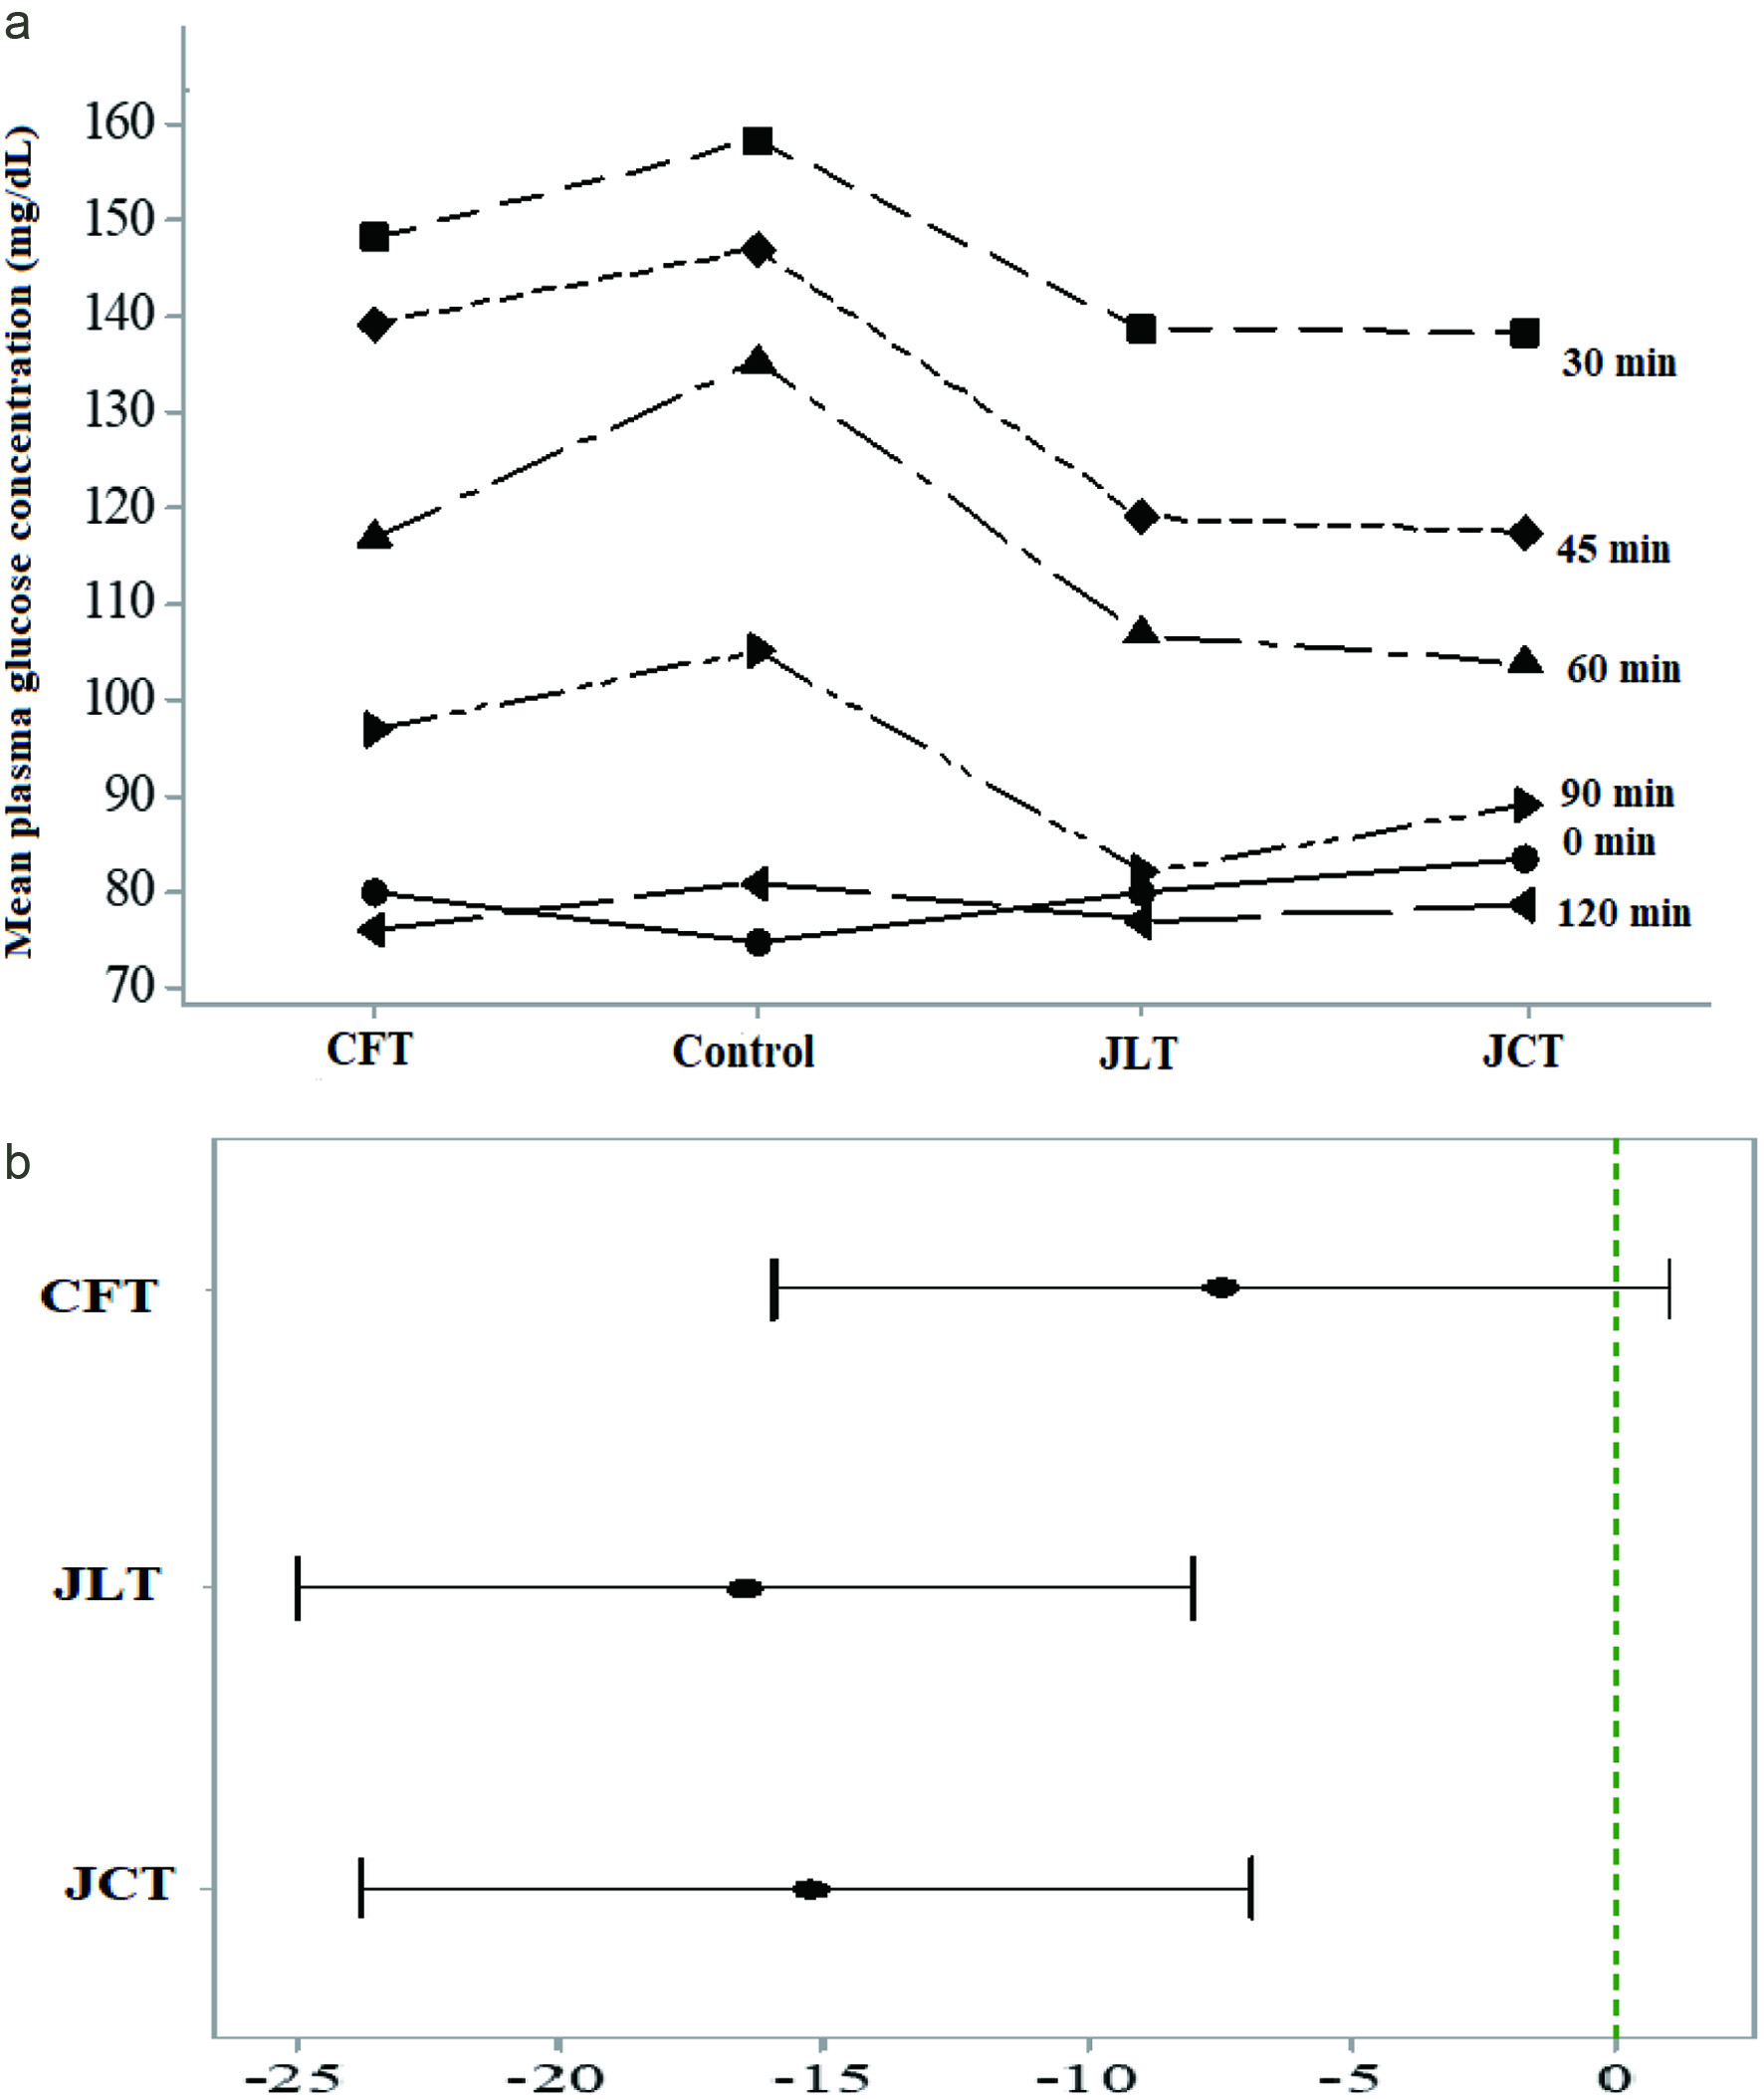
Figure 1. (a) Mean plasma glucose concentration of healthy adults (herbal tea × time); (b) Comparison of glycemic response of test herbal teas with the control (If an interval does not contain zero, the corresponding mean is significantly different from the control mean). CFT, Cassia flowers tea; CJT, Cassia flowers and Jackfruit leaves mix tea; JLT, Jackfruit leaves tea.

Tables

Table 1. Phenolic compounds identified and their contents (µg/100 g) in test herbal extracts
 
Compound[M-H] (m/z)Other product ions (m/z)Cassia flowers and budsJackfruit leaves
Data represent mean values for each sample ± standard deviations (n = 3). Means followed by the same letter within a column are not significantly different (p > 0.05). *Quantified as equivalent of catechin. nd: not detected.
Ellagic acid3012831.23 ± 0.060.17 ± 0.01
Gallocatechin*305289272.6 ± 21.2nd
Isorhamnetin derivative4613173726 ± 52.2nd
Myricetin derivative509317130.6 ± 8.75nd
Phloridzin derivative529435982.4 ± 36.9nd
Epigallocatechin derivative*579305, 179nd436.4 ± 8.00
Dimeric gallocatechin*6093051,450 ± 90.8nd
Trimeric Propelargonidin*849561, 407, 289367.0 ± 0.80nd


Table 2. Phenolic contents and antioxidant activities (per g) of extract of herbal teas
 
Cassia flowers and budsSenescent jackfruit leaves
Abbreviations: Total phenolic content, TPC; Total flavanoid content, TFC; Trolox equivalent antioxidant capacity, TEAC; 2,2-diphenyl-1-picrylhydrazyl (DPPH) radical scavenging ability, DRSA; Reducing power, RP; Ferrous ion chelating ability, FICA; and Ethylenediaminetetraacetic acid, EDTA Values with the same letters in each raw for tested herbal extracts are not significantly different (p > 0.05).
TPC ( µmol gallic acid equiv)549.6 ± 4.7a68.8 ± 4.3b
TFC ( µmol catechin equiv)102.2 ± 2.3a8.3 ± 2.4b
TEAC (µmol trolox equiv)523.9 ± 12.0a23.4 ± 6.6b
DRSA ( µmol trolox equiv)567.7 ± 7.9a27.1 ± 2.8b
RP ( µmol ascorbic acid equiv)693.8 ± 5.7a143.0 ± 5.1b
FICA ( µmol EDTA equiv)0.03 ± 0.01b0.09 ± 0.01a


Table 3. Mean scores for sensory attributes and Friedman test ranks for different preparations of herbal teas
 
Cassia flowers and buds tea (CFT)
All values are mean ± SD; n = 50; Values in each row having the same letter are not significantly different (p > 0.05).
459353721
Colour5.7 ± 1.1a4.4 ± 1.4b4.4 ± 1.4b
Taste preference5.9 ± 1.1a4.7 ± 1.3b3.8 ± 1.2c
After taste5.5 ± 1.0a4.7 ± 1.1a3.6 ± 1.1b
Overall acceptance5.3 ± 1.1a5.3 ± 1.2a3.3 ± 1.3b
Willingness to drink regularly5.2 ± 1.3a5.2 ± 1.3a3.5 ± 1.1b
Friedman test mean rank2.432.061.51
Jackfruit leaves tea (JLT)
All values are mean ± SD; n = 50; Values in each row having the same letter are not significantly different (p > 0.05).
824276599
Colour5.8 ± 1.5a4.7 ± 1.1b4.8 ± 1.3b
Taste preference5.4 ± 1.1a3.7 ± 1.3b4.8 ± 1.0c
After taste5.6 ± 0.9a4.4 ± 1.1b5.3 ± 0.9ab
Overall acceptance5.2 ± 1.2a4.9 ± 1.4a5.0 ± 1.4a
Willingness to drink regularly5.3 ± 1.1a4.3 ± 1.0b4.8 ± 1.3ac
Friedman test mean rank2.261.871.87
Jackfruit leaves & Cassia flowers mixed tea (JCT)
All values are mean ± SD; n = 50; Values in each row having the same letter are not significantly different (p > 0.05).
602411905
Colour6.1 ± 1.5a5.2 ± 1.1b5.5 ± 1.3b
Taste preference5.9 ± 1.2a4.6 ± 1.3b3.7 ± 1.0c
After taste5.4 ± 1.2a4.4 ± 1.3b3.5 ± 1.4c
Overall acceptance5.6 ± 1.1a5.4 ± 1.3a3.8 ± 1.4b
Willingness to drink regularly5.5 ± 1.1a5.2 ± 1.0a4.3 ± 1.1c
Friedman test mean rank2.451.951.60


Table 4. Total phenolic content and antioxidant activity (per 250 mL of serving) of test herbal teas
 
Total phenolic content (µmol gallic acid equiv)Trolox equivalent antioxidant capacity (µmol trolox equiv)
Values in each column having the same letters are not significantly different (p > 0.05).
Cassia flowers tea (CFT)1843.9 ± 16.4a1880.8 ± 40.5a
Jackfruit leaves + Cassia flowers tea (JCT)1722.0 ± 14.8b421.6 ± 26.8b
Jackfruit leaves tea (JLT)670.1 ± 3.1c49.7 ± 2.5c


Table 5. Difference of postprandial plasma glucose response of healthy adults on herbal teas compared to the control
 
0 min30 min45 min60 min90 min120 min
Values are mean difference (SEM); n = 14; *Difference from control is significant (p < 0.05).
Cassia flowers tea (CFT)−4.9 ( 3.8)10.3 ( 7.2)7.8 (7.9)18.5 ( 7.3)8.2 ( 7.4)4.9 ( 5.1)
Jackfruit leaves tea (JLT)−4.9 ( 4.2)20.0* ( 9.4)28.1* ( 7.8)28.8* (5.5)23.2* (3.8)3.9 ( 3.2)
Jackfruit leaves + Cassia flowers tea (JCT)−8.5 ( 3.6)20.1* ( 6.7)29.6 * ( 9.1)31.7* (8.5)16.2 ( 5.8)2.4 ( 5.0)


Table 6. Plasma antioxidant capacity (µmol trolox equiv/L) of healthy adults at baseline and 120 min after ingestion of herbal teas
 
BaselineEnd (120 min after ingestion)Difference between baseline and endPercentage change (%) compared to baseline at the end
All values are mean ± SEM; n = 14; Values in each column with the same letter are not significantly different (p > 0.05); Values in each row having the same letter are not significantly different (p > 0.05). *Percentage increment of plasma antioxidant capacity of each tea compared to the respective baseline is significant (p > 0.05).
Control206.9 ± 44.1a196.1 ± 43.5a−10.8
Jackfruit leaves tea (JLT)237.7 ± 26.2a325.5 ± 54.2b87.837.7*
Cassia flowers tea (CFT)207.7 ± 28.4a342.2 ± 36.0b134.567.0*
Jackfruit leaves + Cassia flowers tea (JCT)204.8 ± 38.4a338.9 ± 64.4b134.171.1*