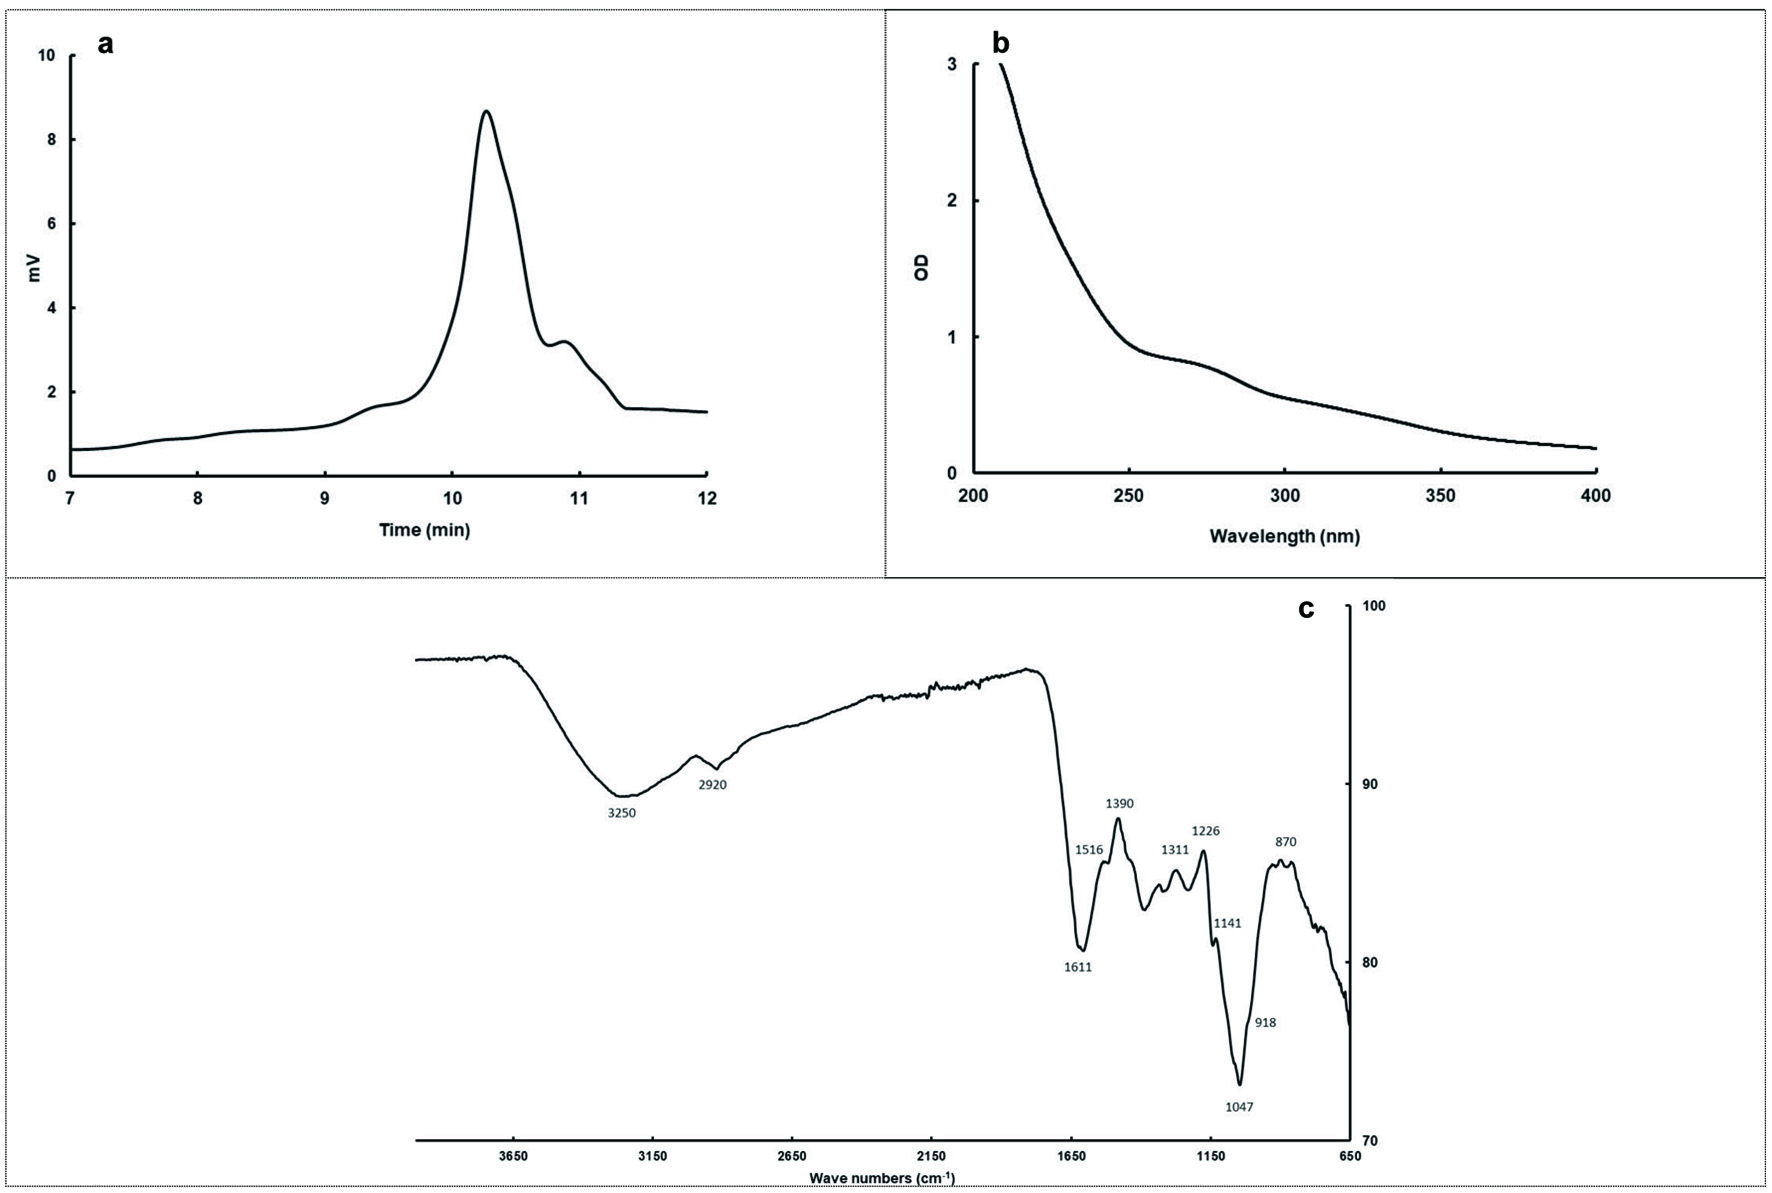
Figure 1. Gel permeation chromatogram (a), UV Spectra (b), and FT-IR spectra (c) of BTPS.
| Journal of Food Bioactives, ISSN 2637-8752 print, 2637-8779 online |
| Journal website www.isnff-jfb.com |
Original Research
Volume 13, March 2021, pages 93-101
In-vitro antidiabetic activities, chemical compositions, antioxidant activities, and toxicity of black tea polysaccharides as a potential source of dietary ingredients
Figures
Tables
| Parameters | |
|---|---|
| Data are expressed as the mean ± SD (n = 3). Abbreviations: ABTS, 2,2′-azino-bis (3-ethylbenzothiazoline-6-sulphonic acid); FRAP, ferric reducing antioxidant potential; GAE, gallic acid equivalents; BTPS, black tea polysaccharide, TE, trolox equivalents. | |
| Yield (%) | 3.26 ± 0.11 |
| Total carbohydrates (%) | 51.8 ± 4.8 |
| Uronic acid (%) | 4.35 ± 0.58 |
| Insoluble dietary fibre (%) | 1.21 ± 0.11 |
| Soluble dietary fibre (%) | 30.2 ± 0.1 |
| Total phenolics (g GAE/100 g BTPS) | 10.9 ± 1.3 |
| ABTS (mg TE/100 g BTPS) | 8.77 ± 0.67 |
| FRAP (mg FeSO4.7H2O/100 g BTPS) | 3.01 ± 0.29 |
| Monosaccharides | mol ratio (%) | Amino acids | mg/100 g | Minerals | mg/100 g |
|---|---|---|---|---|---|
| Data are expressed as the mean ± SD (n = 3). Abbreviation: nd, not detected. | |||||
| D-mannose | 2.38 ± 0.02 | Aspartic acid | 446 ± 86 | Calcium | 41.2 ± 1.7 |
| D-ribose | 2.72 ± 0.02 | Alanine | 114 ± 11 | Chromium | 0.78 ± 0.0 |
| L-rhamnose | 2.86 ± 0.03 | Arginine | 89.5 ± 12 | Copper | 1.37 ± 0.0 |
| D-glucuronic | 2.46 ± 1.01 | Glutamic acid | 822 ± 11 | Iron | 9.8 ± 0.2 |
| D-galacturonic | 2.89 ± 1.02 | Glycine | 337 ± 60 | Magnesium | 815 ± 27 |
| D-glucose | 7.00 ± 0.07 | Histidine | 9.50 ± 7.80 | Manganese | 423 ± 4 |
| D-galactose | 47.5 ± 0.5 | Isoleucine | nd | Phosphorus | 1,970 ± 50 |
| D-xylose | 1.89 ± 0.02 | Leucine | 54.5 ± 3.5 | Potassium | 9,155 ± 47 |
| D-arabinose | 28.5 ± 0.3 | Lysine | 182 ± 12 | Sodium | 15.3 ± 0.8 |
| L-fucose | 1.45 ± 0.08 | Methionine | nd | Zinc | 6.22 ± 0.20 |
| Proline | 85.0 ± 9.9 | ||||
| Phenylalanine | 20.0 ± 4.2 | ||||
| Serine | 144 ± 12 | ||||
| Threonine | 67.0 ± 0.0 | ||||
| Tyrosine | 40.0 ± 14.1 | ||||
| Valine | 37.5 ± 3.5 | ||||
| Total | 2,498 ± 1 | ||||
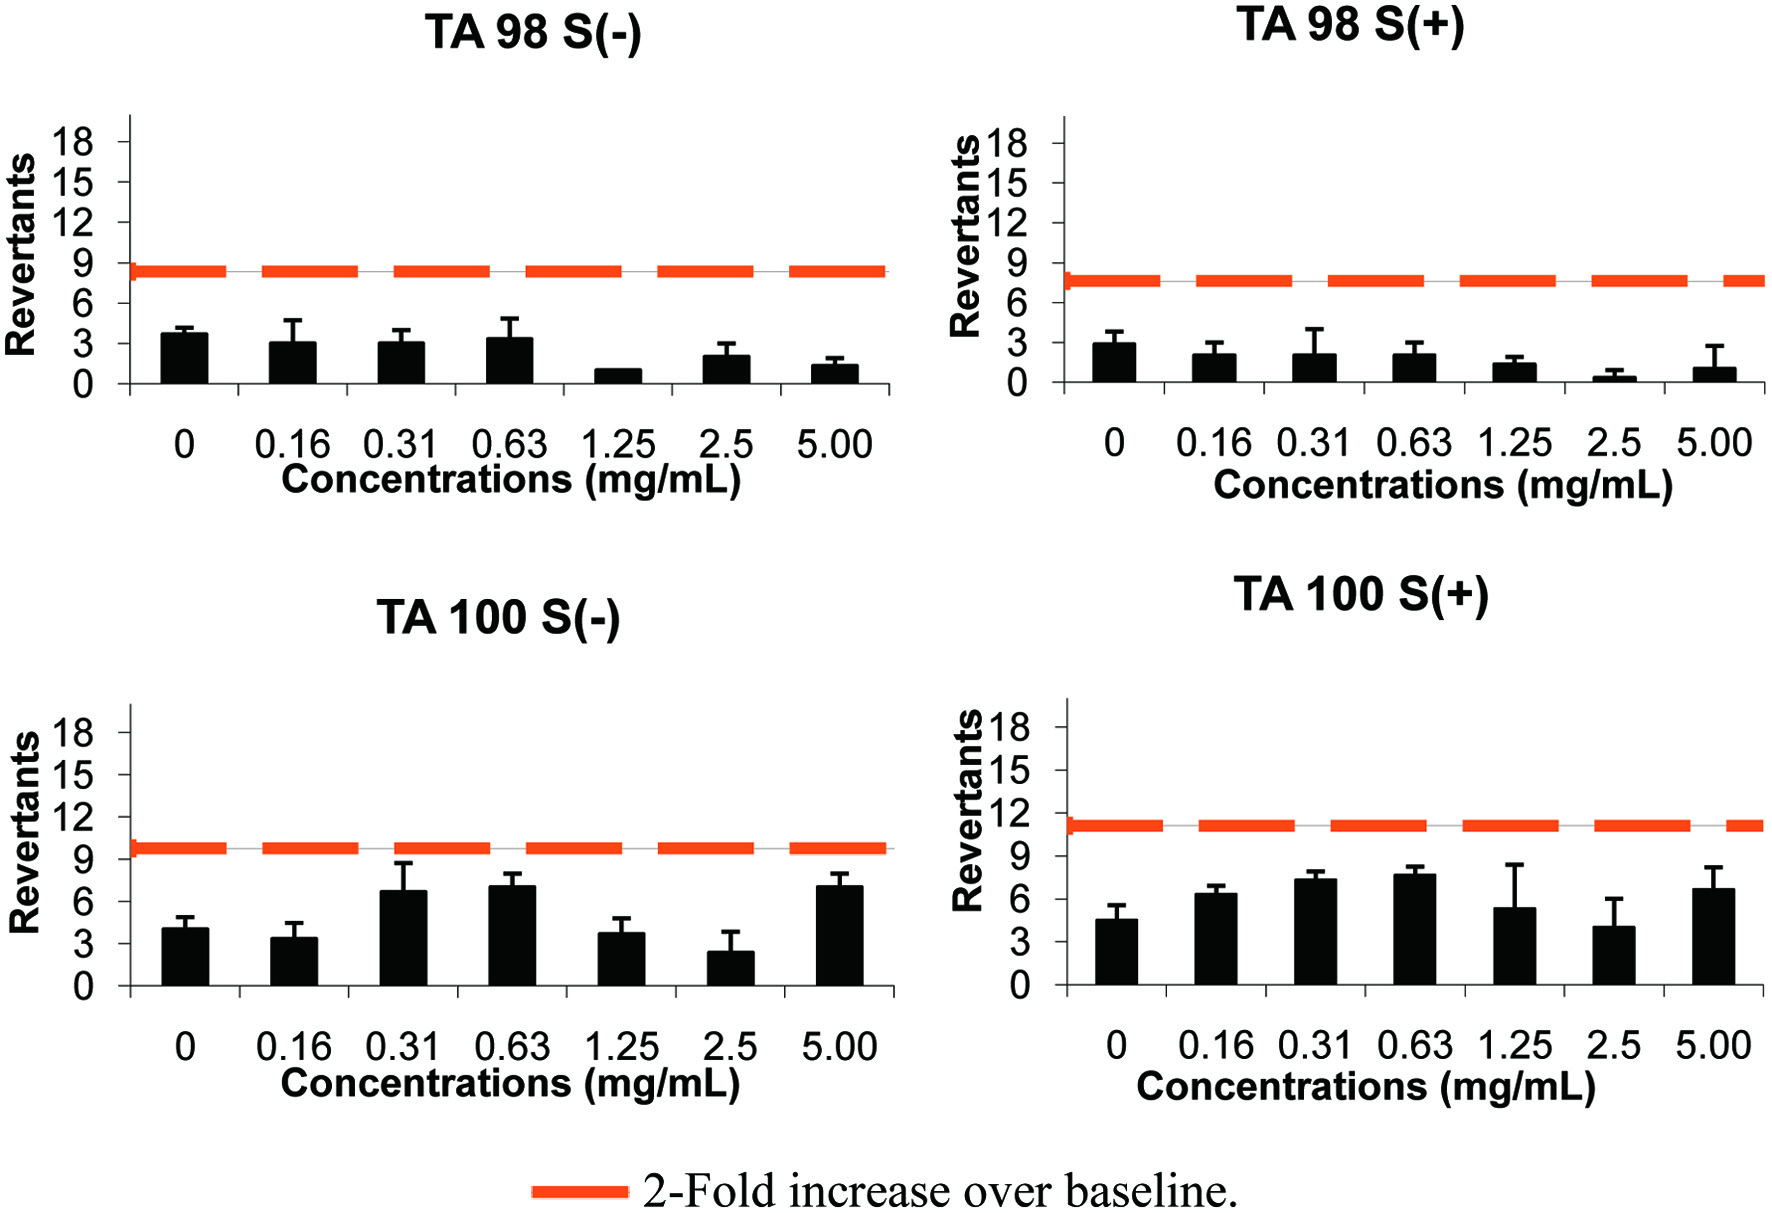
| Concentrations (mg/mL) | Mutagenity | |||||||||||
|---|---|---|---|---|---|---|---|---|---|---|---|---|
| Baseline | TA 98 (positive wells) | TA 98 (Fold increase over baseline) | Baseline | TA 100 (positive wells) | TA 100 (Fold increase over baseline) | |||||||
| S9+ | S9− | S9+ | S9− | S9+ | S9− | S9+ | S9− | S9+ | S9− | S9+ | S9− | |
| Data are expressed as the mean ± SD (n = 3). *p < 0.05, significant level according to the student-t test. ***p < 0.001, significant level according to the student-t test. | ||||||||||||
| 0.156 | 3.82 | 4.18 | 2.00 ± 1.00 | 3.00 ± 1.73 | 0.52 | 0.72 | 5.55 | 4.89 | 6.33 ± 0.58 | 3.33 ± 1.15 | 1.14* | 0.68 |
| 0.313 | 2.00 ± 2.00 | 3.00 ± 1.00 | 0.52 | 0.72 | 7.33 ± 0.58 | 6.67 ± 2.08 | 1.32*** | 1.36* | ||||
| 0.625 | 2.00 ± 1.00 | 3.33 ± 1.53 | 0.52 | 0.80 | 7.67 ± 0.58 | 7.00 ± 1.00 | 1.38*** | 1.43*** | ||||
| 1.250 | 1.33 ± 0.58 | 1.00 ± 0.00 | 0.35* | 0.24*** | 5.33 ± 3.06 | 3.67 ± 1.15 | 0.96 | 0.75 | ||||
| 2.500 | 0.33 ± 0.58 | 2.00 ± 1.00 | 0.09*** | 0.48*** | 4.00 ± 2.00 | 2.33 ± 1.53 | 0.72 | 0.48* | ||||
| 5.000 | 1.00 ± 1.73 | 1.33 ± 0.58 | 0.26* | 0.32*** | 6.67 ± 1.53 | 7.00 ± 1.00 | 1.20* | 1.43*** | ||||