Figures
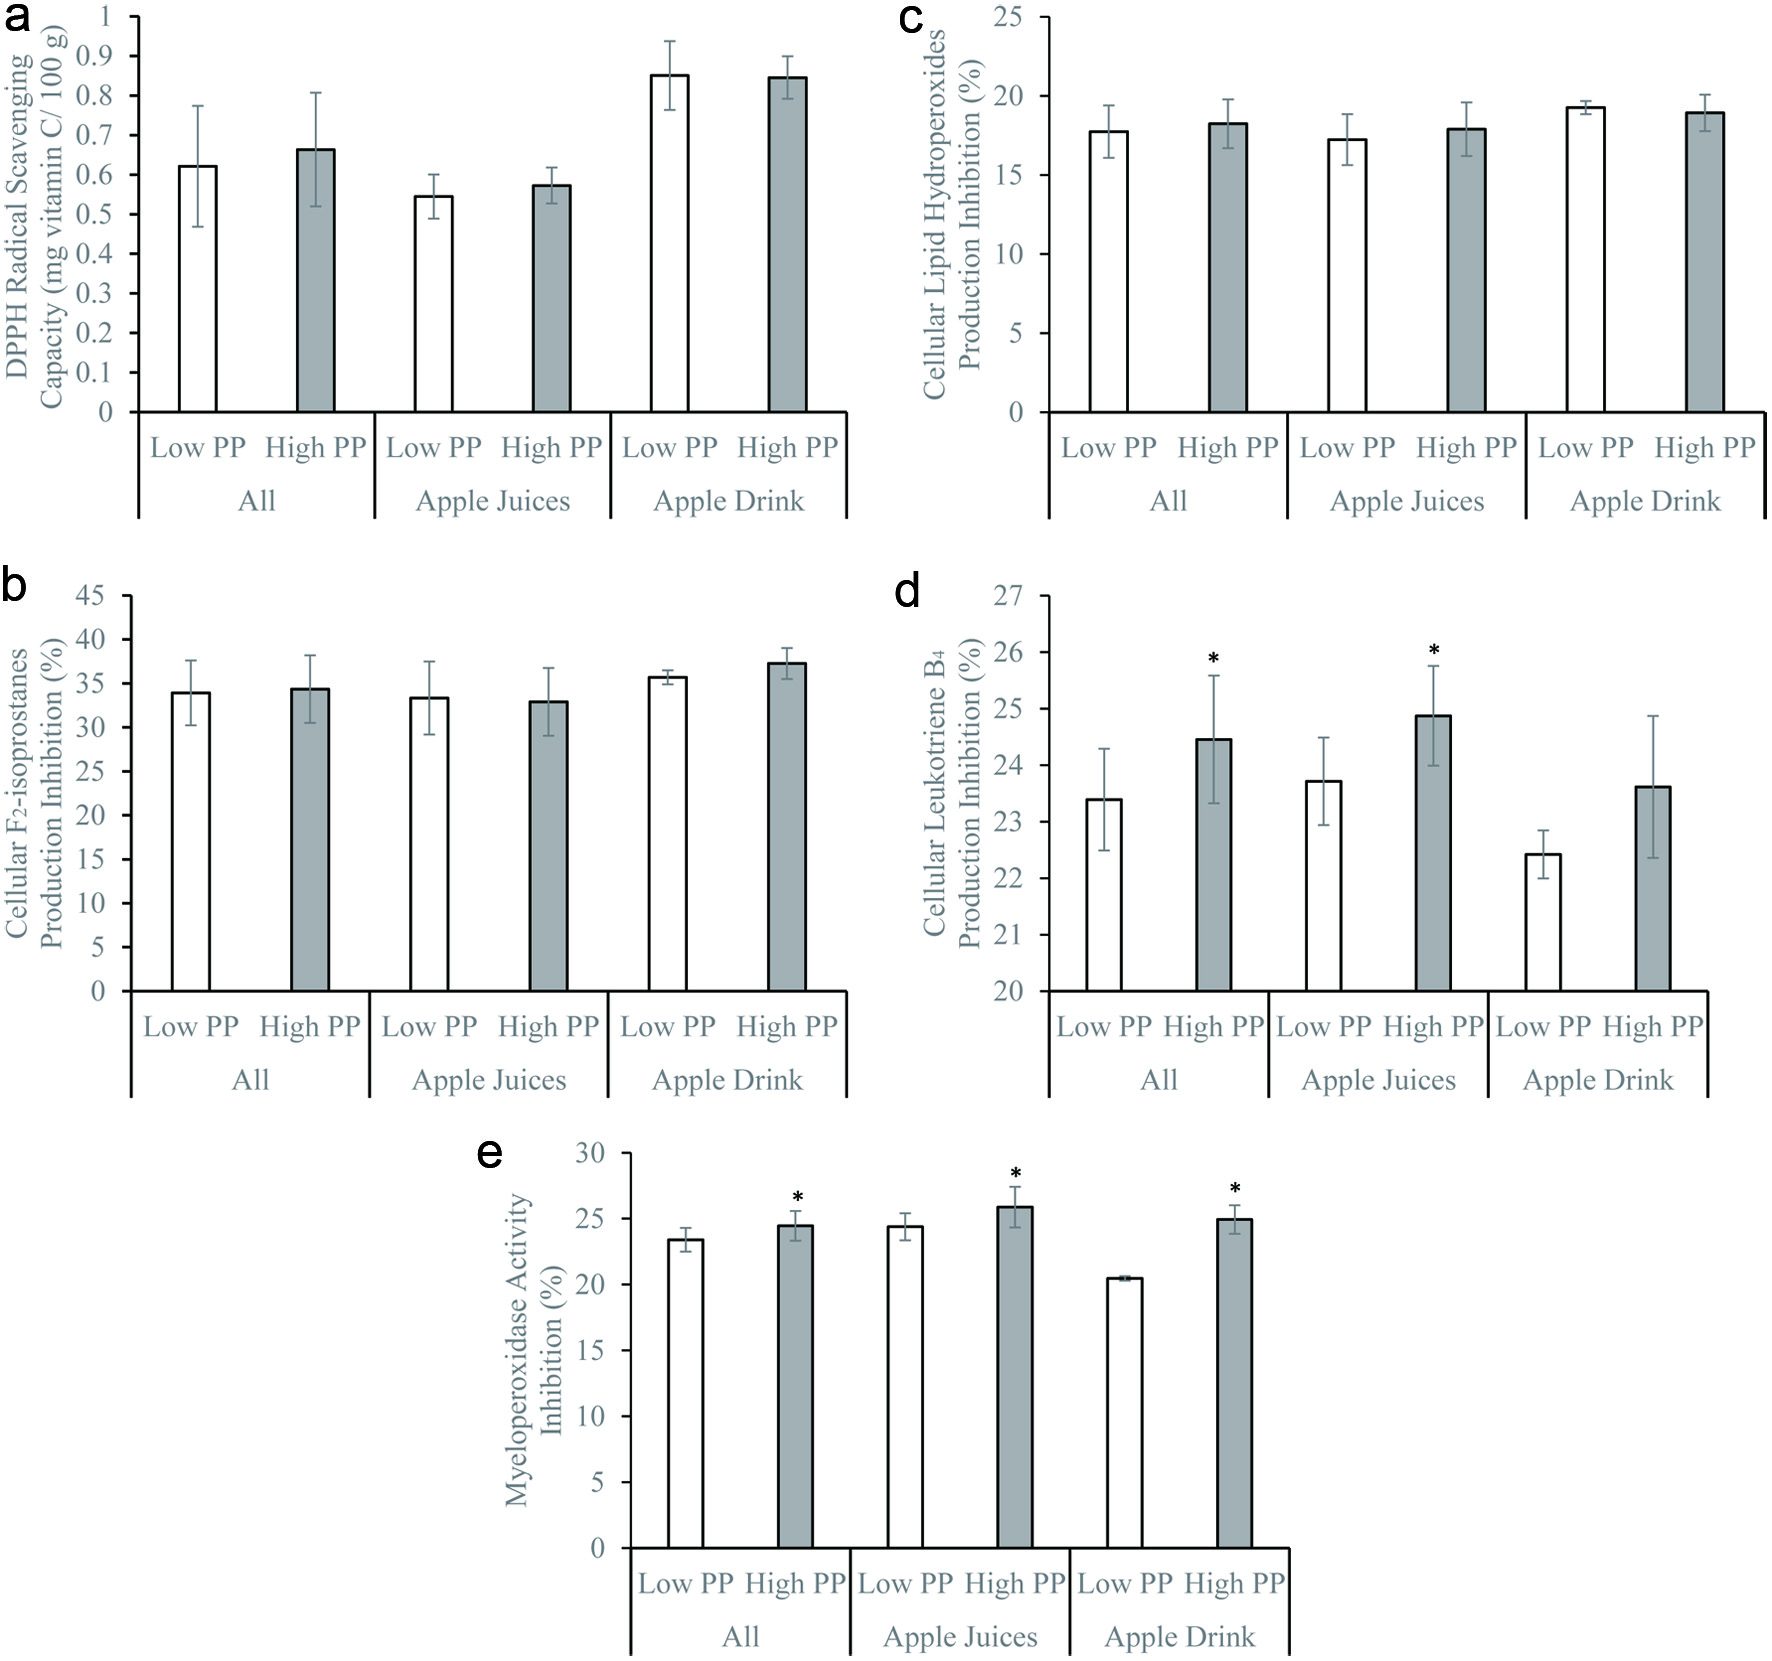
Figure 1. (a) 1,1-diphenyl-2-picrylhydrazyl radical scavenging activity, (b) inhibitions of formation of F2-isoprostanes, (c) lipid hydroperoxides, (d) leukotriene B4, and (e) myeloperoxidase activity by freshly isolated human neutrophils in vitro of apple beverages – juices and drinks with low (lower than 10 mg GAE/100g; apple beverages n = 8, juices n = 6, drinks n = 2) and high (equal or greater than 10 mg GAE/100g; apple beverages n = 9, juices n = 6, drinks n = 3) total polyphenol contents. *p < 0.05 using two-sample independent t-test.
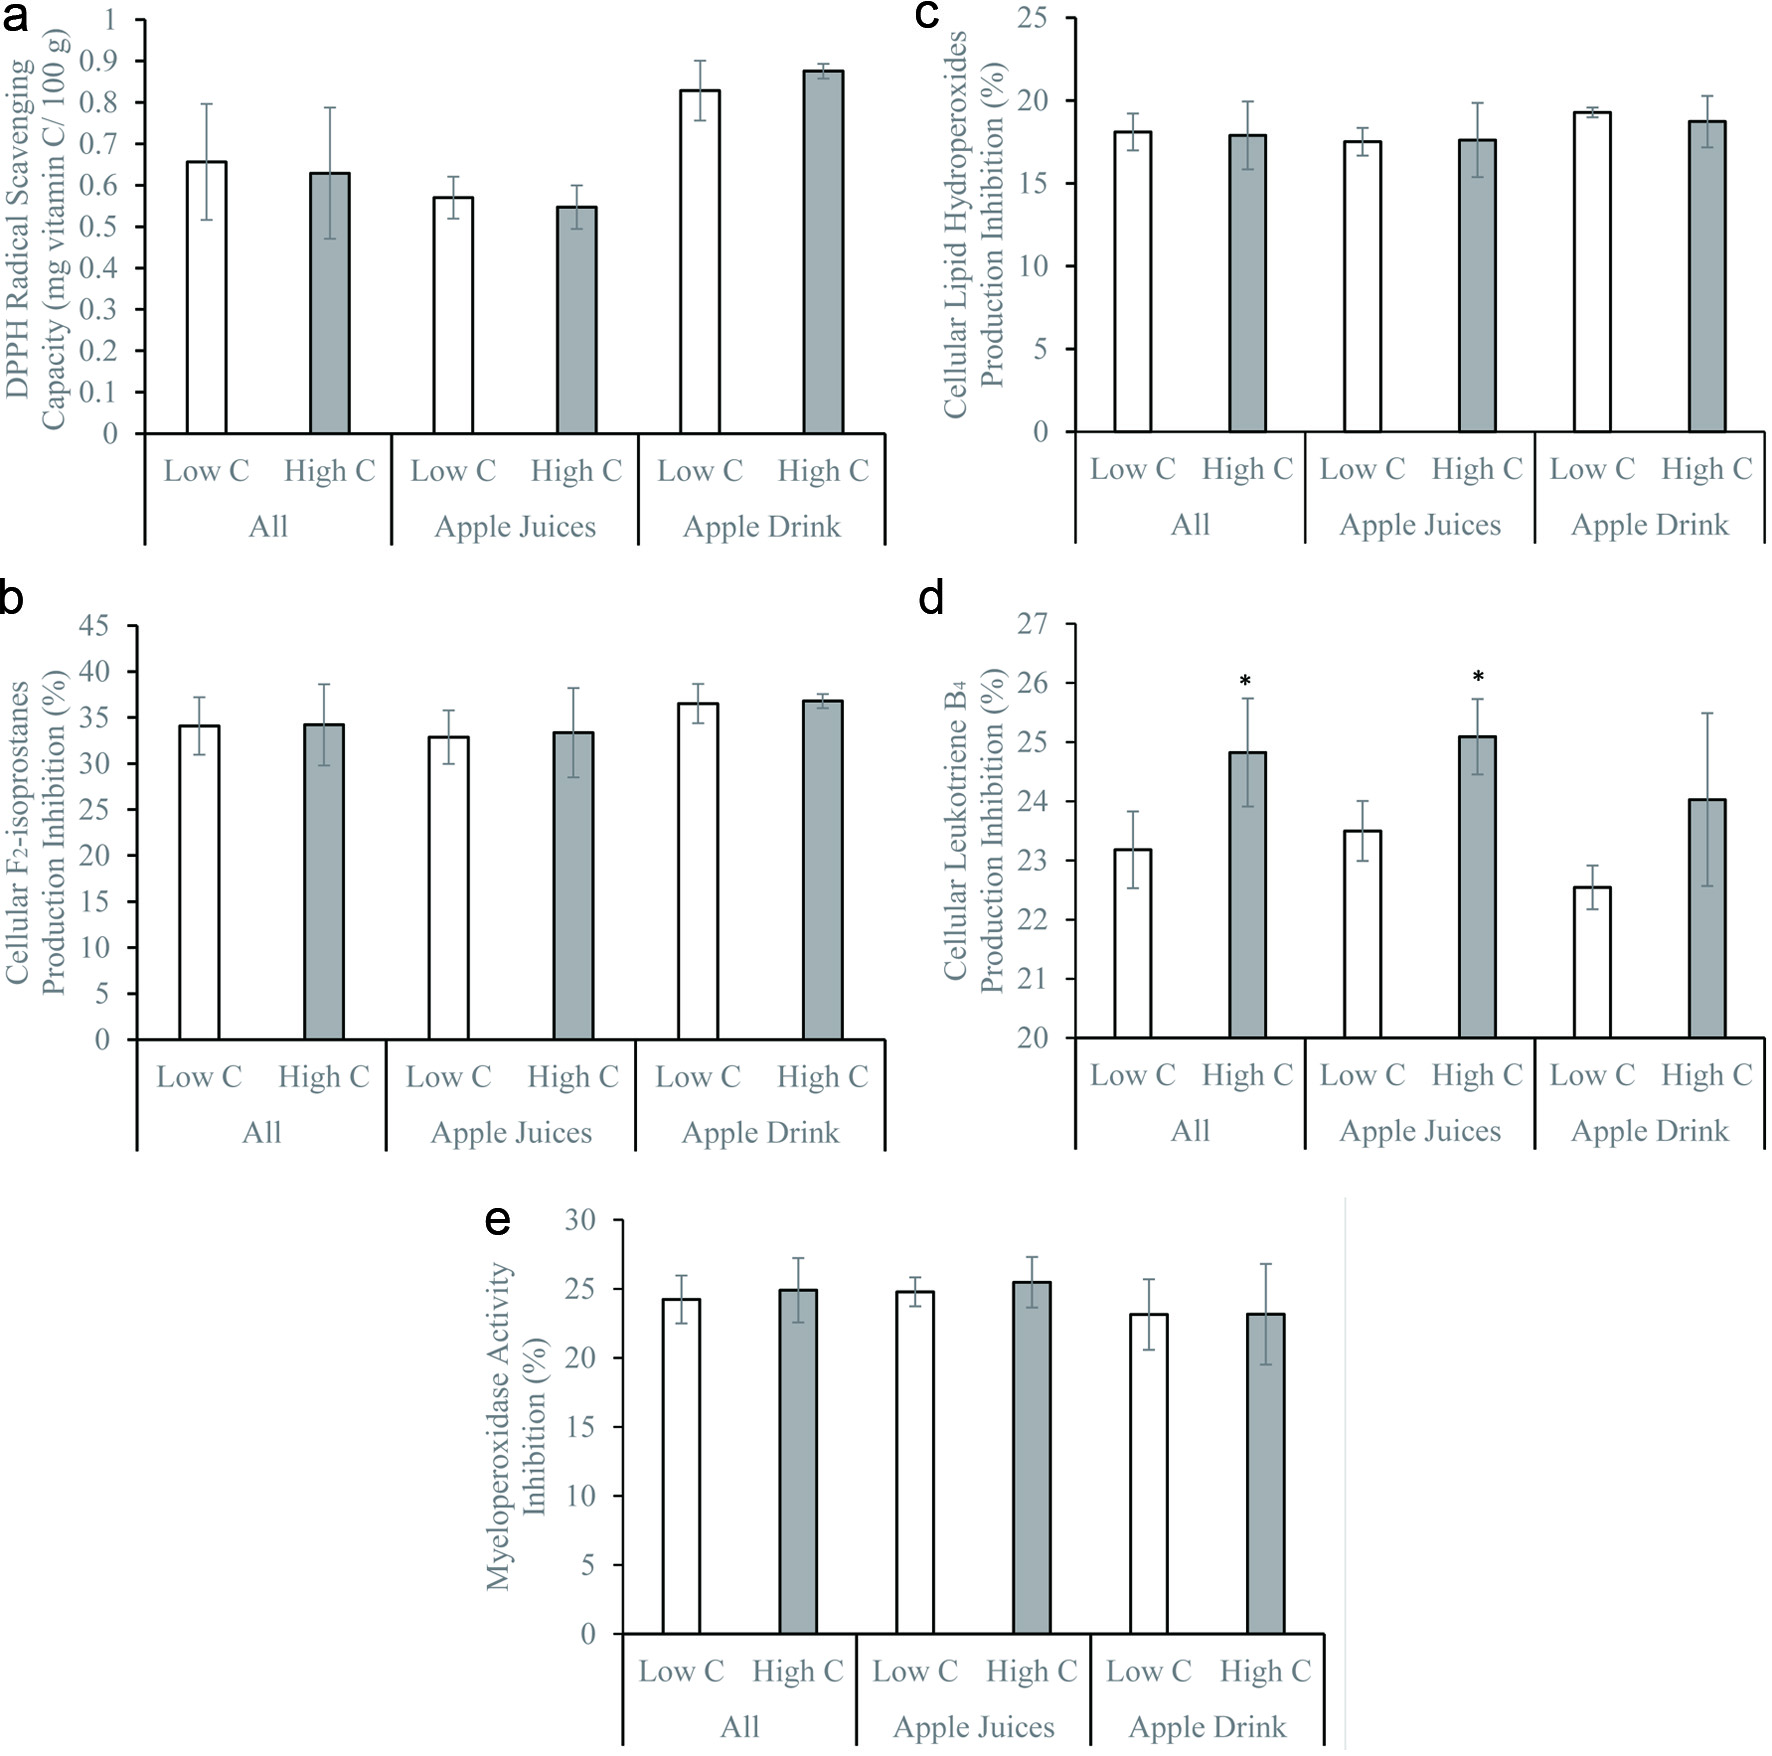
Figure 2. (a) 1,1-diphenyl-2-picrylhydrazyl radical scavenging activity, (b) inhibitions of formation of F2-isoprostanes, (c) lipid hydroperoxides, (d) leukotriene B4, and (e) myeloperoxidase activity by freshly isolated human neutrophils in vitro of apple beverages – juices and drinks with low (lower than 1.2 mg/100g; apple beverages n = 9, juices n = 6, drinks n = 3) and high (equal or greater than 1.2 mg/100g; apple beverages n = 8, juices n = 6, drinks n = 2) total catechin contents. *p < 0.05 using two-sample independent t-test.
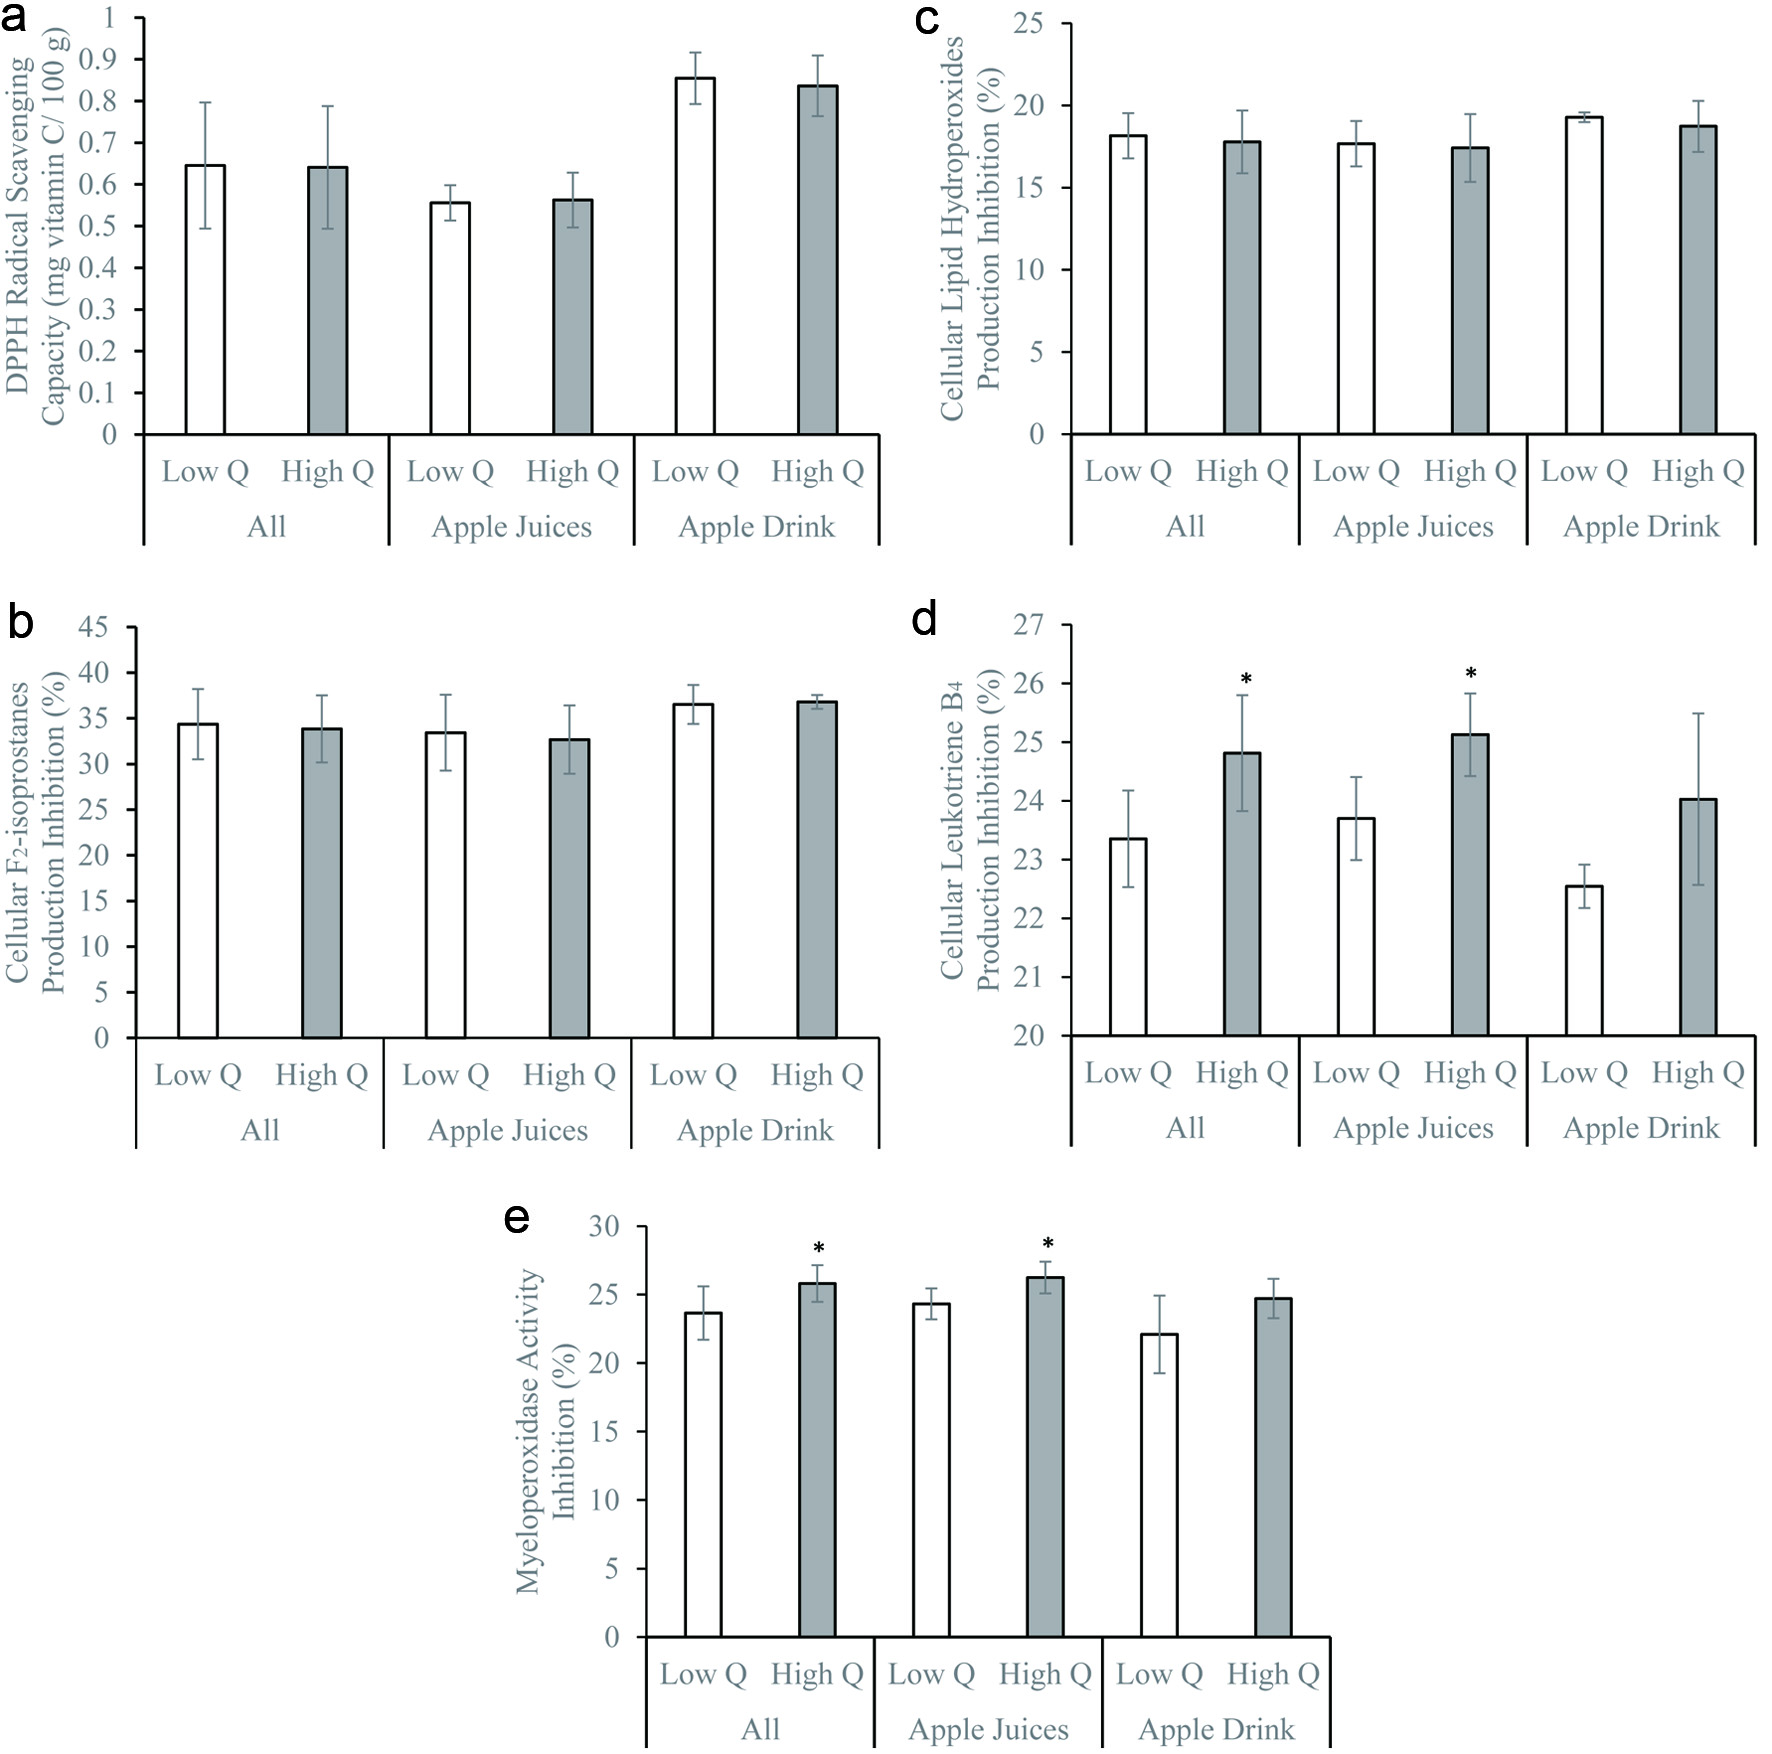
Figure 3. (a) 1,1-diphenyl-2-picrylhydrazyl radical scavenging activity, (b) inhibitions of formation of F2-isoprostanes, (c) lipid hydroperoxides, (d) leukotriene B4, and (e) myeloperoxidase activity by freshly isolated human neutrophils in vitro of apple beverages – juices and drinks with low (lower than 0.5 mg/100g; apple beverages n = 10, juices n = 7, drinks n = 3) and high (equal or greater than 0.5 mg/100g; apple beverages n = 7, juices n = 5, drinks n = 2) total quercetin contents. *p < 0.05 using two-sample independent t-test.
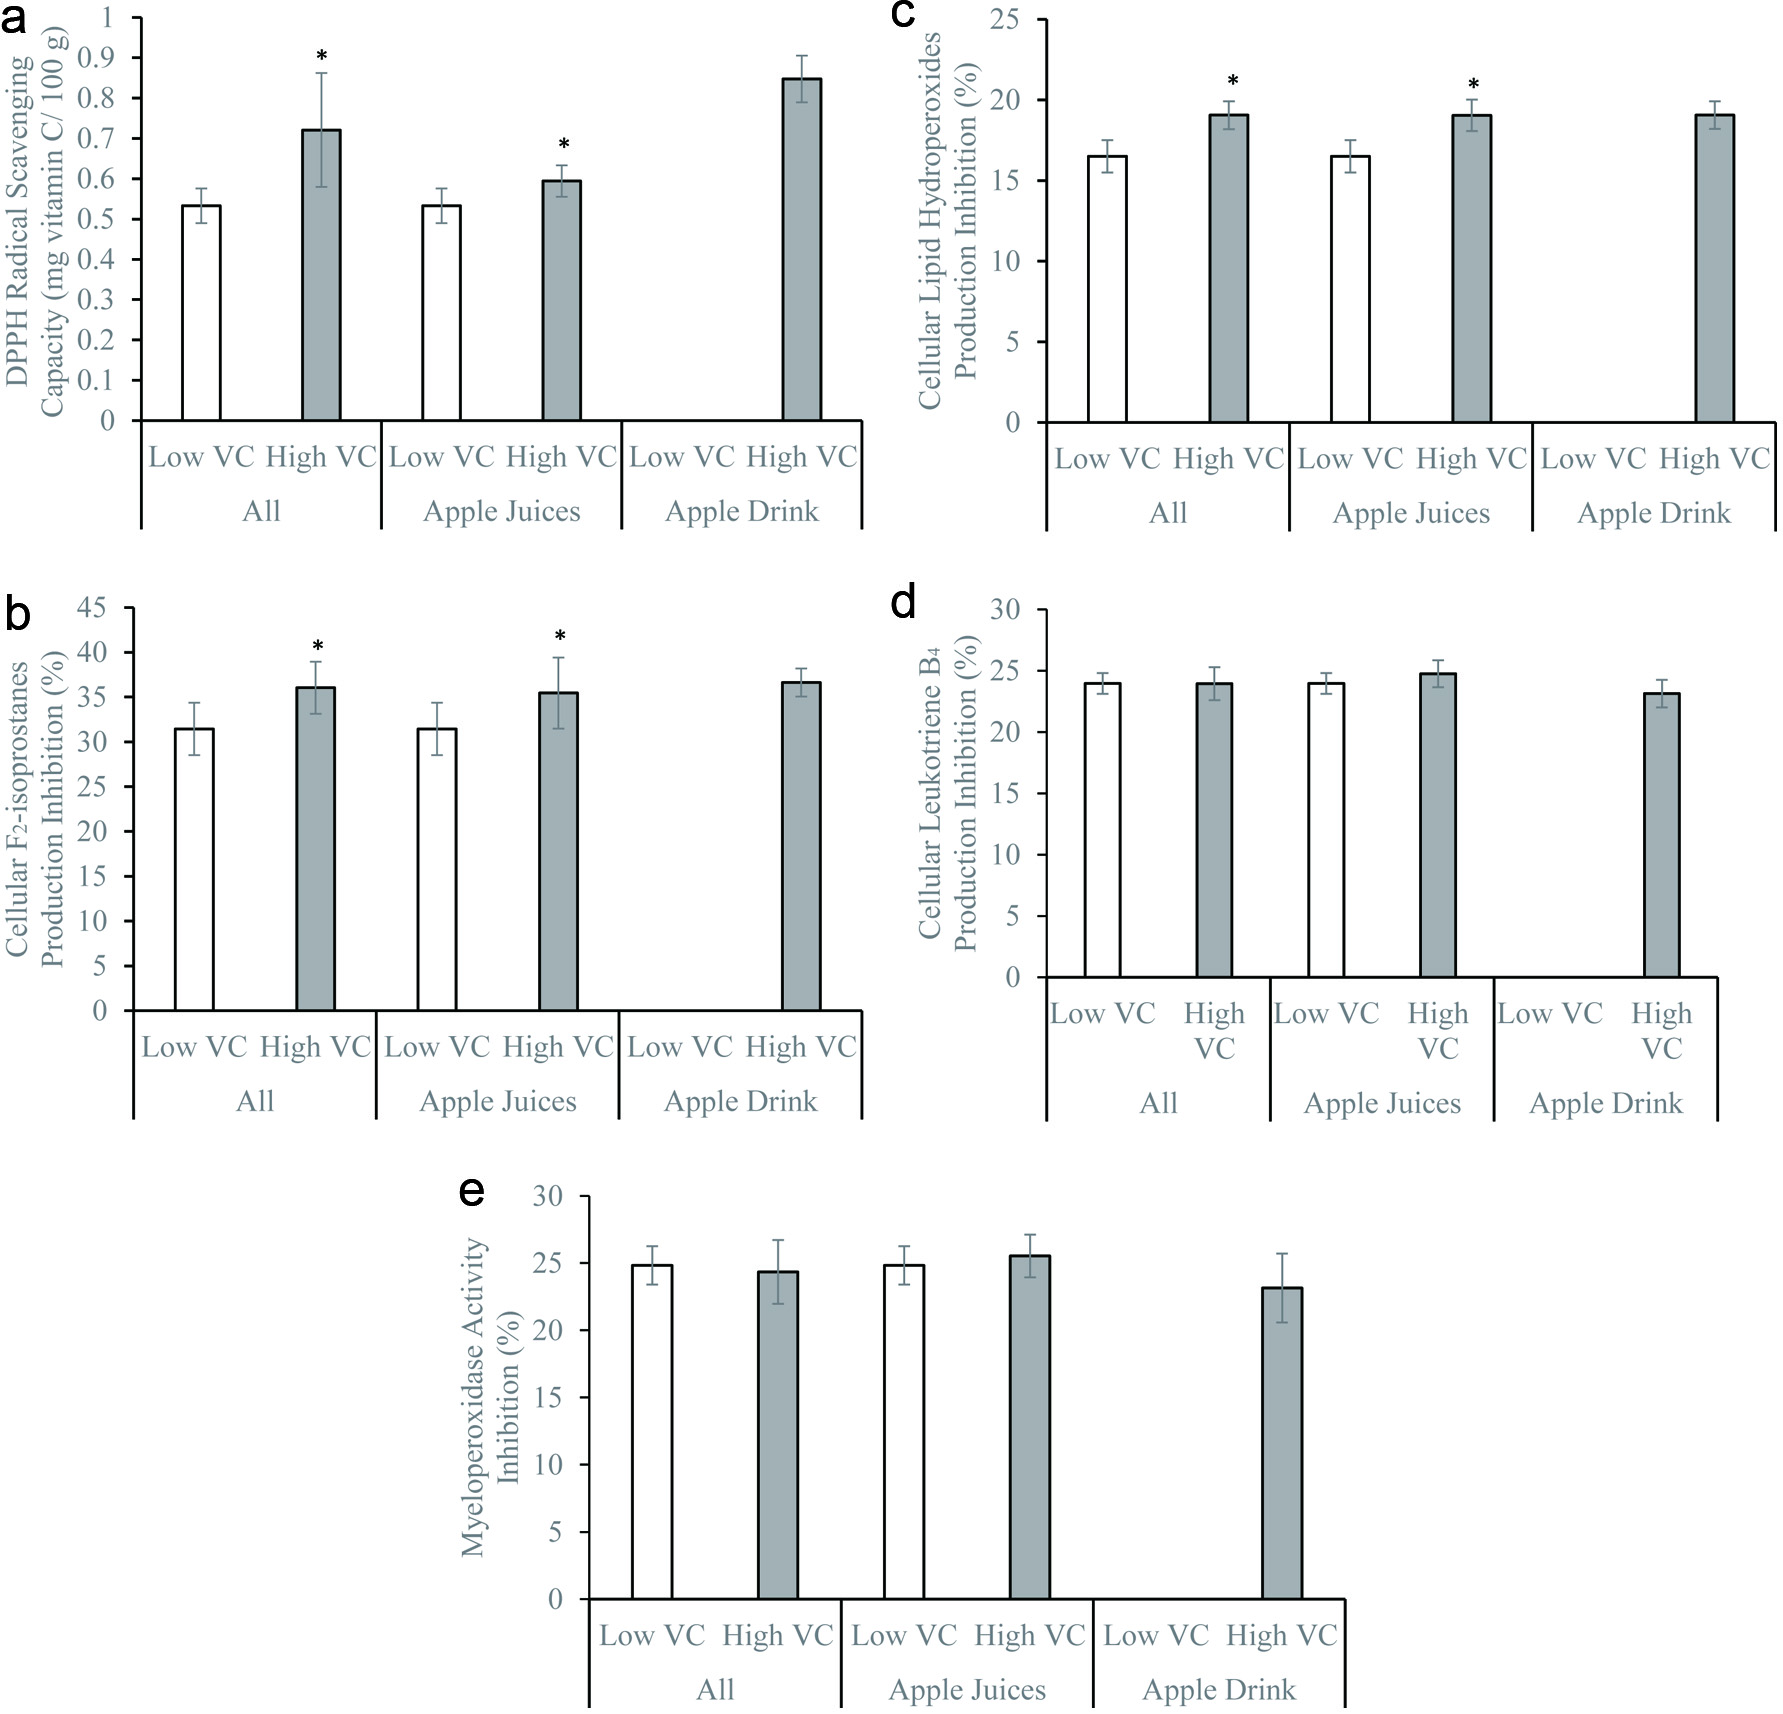
Figure 4. (a) 1,1-diphenyl-2-picrylhydrazyl radical scavenging activity, (b) inhibitions of formation of F2-isoprostanes, (c) lipid hydroperoxides, (d) leukotriene B4, and (e) myeloperoxidase activity by freshly isolated human neutrophils in vitro of apple beverages – juices and drinks with low (lower than 20 mg/100g; apple beverages n = 7, juices n = 7, drinks n = 0) and high (equal or greater than 20 mg/100g; apple beverages n = 10, juices n = 5, drinks n = 5) vitamin C. *p < 0.05 using two-sample independent t-test.
Tables
Table 1. Nutritional profile, total and specific polyphenol contents of apple beverages (N1)
| Nutrients | All | Juices | Drinks |
|---|
| 1N represents the number of fruit beverage products out of the 17 apple beverages with declared respective nutrient contents on their product labels. *p < 0.05 vs. juices using two-sample independent t-tests. **p < 0.05 vs. healthy 5.0 g/100 mL reference sugar value using one-sample t-tests. |
| Energy (N) (kJ/100g) | 45.07 ± 3.74 (17) | 46.08 ± 2.28 (12) | 42.65 ± 5.58* (5) |
| Protein (N) (g/100g) | 0.10 ± 0.12 (17) | 0.11 ± 0.13 (12) | 0.09 ± 0.09 (5) |
| Fat (N) (g/100g) | 0.03 ± 0.07 (17) | 0.03 ± 0.08 (12) | 0.02 ± 0.05 (5) |
| Carbohydrate (N) (g/100g) | 11.08 ± 1.03 (17) | 11.34 ± 0.68 (12) | 10.43 ± 1.50 (5) |
| Sugar (N) (g/100g) | 10.35 ± 1.18** (17) | 10.64 ± 0.88** (12) | 9.65 ± 1.61* ** (5) |
| Dietary fibre (N) (g/100g) | 0.01 ± 0.04 (9) | 0.00 ± 0.00 (6) | 0.04 ± 0.07 (3) |
| Sodium (N) (mg/100g) | 6.78 ± 8.55 (16) | 4.73 ± 5.91 (12) | 12.94 ± 13.05 (4) |
| Vitamin C (N) (mg/100g) | 33.35 ± 21.87 (17) | 19.50 ± 9.88 (12) | 44.42 ± 23.19 (5)* |
| Total polyphenols (N) (mg gallic acid equivalent/100g) | 9.9 ± 1.2 (17) | 10.7 ± 1.2 (12) | 9.4 ± 0.8 (5)* |
| Total catechin (mg/100g) | 1.60 ± 0.10 (17) | 1.65 ± 0.07 (12) | 1.50 ± 0.08 (5)* |
| Total quercetin (mg/100g) | 0.46 ± 0.09 (17) | 0.50 ± 0.06 (12) | 0.36 ± 0.07 (5)* |
Table 2. Antioxidant and anti-inflammatory capacity of apple beverages (N1)
| Nutrients | All | Juices | Drinks |
|---|
| 1N represents the number of fruit beverage products out of the 17 apple beverages with declared respective nutrient contents on their product labels. *p < 0.05 vs. juices using two-sample independent t-tests. |
| 1,1-diphenyl-2-picrylhydrazyl radical scavenging antioxidant capacity (N) (mg vitamin C equivalents/100g) | 0.64 ± 0.14 (17) | 0.56 ± 0.05 (12) | 0.85 ± 0.06 (5)* |
| Inhibition of cellular F2-isoprostane production (N) (% relative to the positive control) | 34.1 ± 3.7 (17) | 33.1 ± 3.8 (12) | 36.6 ± 1.6 (5)* |
| Inhibition of cellular lipid hydroperoxide production (N) (% relative to the positive control) | 18.0 ± 1.6 (17) | 17.6 ± 1.6 (12) | 19.1 ± 0.9 (5)* |
| Inhibition of cellular leukotriene B4 production (N) (% relative to the positive control) | 24.0 ± 1.14 (17) | 24.3 ± 0.1 (12) | 23.1 ± 1.1 (5)* |
| Inhibition of cellular myeloperoxidase activity (N) (% relative to the positive control) | 25.2 ± 1.4 (17) | 25.1 ± 1.5 (12) | 23.1 ± 2.6 (5)* |
Table 3. Antioxidant and anti-inflammatory capacity of simulated apple beverages
| AL1 | ALS2 | AH3 | AHS4 | AB5 | ABH6 |
|---|
| 1AL represented a simulated apple beverage containing vitamin C (20 mg/100g), apple polyphenols (10 mg gallic acid equivalent/100g), catechin (1.2 mg/100g), and quercetin (0.5 mg/100g). 2ALS represented a simulated apple beverage containing vitamin C (20 mg/100g), apple polyphenols (10 mg gallic acid equivalent/100g), catechin (1.2 mg/100g), quercetin (0.5 mg/100g), and fructose (10 g/100g). 3AH represented a simulated apple beverage containing vitamin C (80 mg/100g), apple polyphenols (40 mg gallic acid equivalent/100g), catechin (5 mg/100g), and quercetin (2 mg/100g). 4AHS represented a simulated apple beverage containing vitamin C (80 mg/100g), apple polyphenols (40 mg gallic acid equivalent/100g), catechin (5 mg/100g), quercetin (2 mg/100g), and fructose (10 g/100g). 5AB was one of the studied commercial apple beverage measured to contain vitamin C (20.5 mg/100g), apple polyphenols (9.5 mg GAE/100g), catechin (1.35 mg/100g), quercetin (0.42 mg/100g), and fructose (10 g/100g). 6ABH represented AB and added vitamin C (59.5 mg/100g), apple polyphenols (30.5 mg GAE/100g), catechin (3.65 mg/100g), and quercetin (1.58 mg/100g). a,bdifferent alphabets represent significant difference using ANOVA with Bonferroni adjustment. |
| 1,1-diphenyl-2-picrylhydrazyl radical scavenging antioxidant capacity (N) (mg vitamin C equivalents/100g) | 1.02 ± 0.08a | 1.03 ± 0.09a | 3.65 ± 0.08b | 3.79 ± 0.16b | 0.52 ± 0.03a | 3.35 ± 0.19b |
| Inhibition of cellular F2-isoprostane production (N) (% relative to the positive control) | 33.7 ± 0.8a | 32.2 ± 1.6a | 53.6 ± 2.7b | 57.3 ± 3.1b | 35.2 ± 2.1a | 59.1 ± 1.1b |
| Inhibition of cellular lipid hydroperoxide production (N) (% relative to the positive control) | 17.0 ± 1.6a | 18.0 ± 1.5a | 32.4 ± 3.1b | 29.8 ± 1.3b | 18.2 ± 0.3a | 30.6 ± 1.7b |
| Inhibition of cellular leukotriene B4 production (N) (% relative to the positive control) | 25.8 ± 3.2a | 26.1 ± 3.0a | 48.7 ± 4.0b | 46.4 ± 1.6b | 25.8 ± 1.3a | 48.9 ± 1.4b |
| Inhibition of cellular myeloperoxidase activity (N) (% relative to the positive control) | 25.2 ± 1.5a | 24.9 ± 2.2a | 40.7 ± 0.3b | 42.1 ± 1.9b | 24.9 ± 3.4a | 45.1 ± 4.6b |