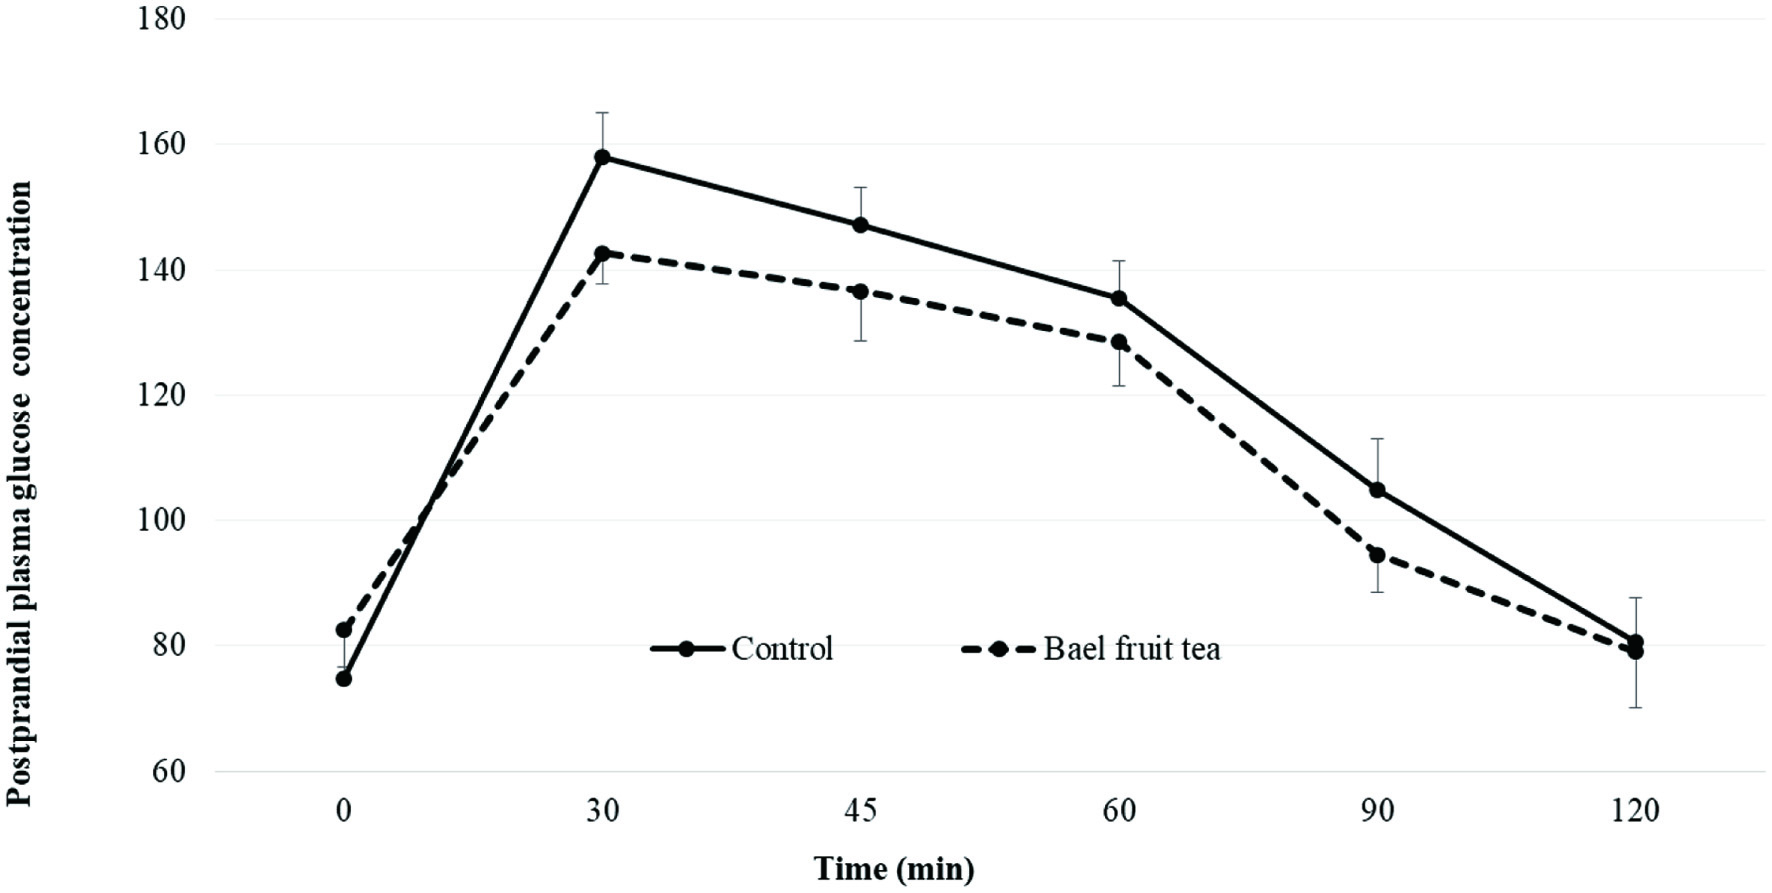
Figure 1. Mean plasma glucose concentration of healthy adults after consuming bael fruit herbal tea and the control.
| Journal of Food Bioactives, ISSN 2637-8752 print, 2637-8779 online |
| Journal website www.isnff-jfb.com |
Original Research
Volume 11, September 2020, pages 75-83
Phenolic antioxidants of bael fruit herbal tea and effects on postprandial glycemia and plasma antioxidant status in healthy adults
Figure
Tables
| Compound | [M-H]− (m/z) | Other product ions (m/z) | Contents (µg/100 g) |
|---|---|---|---|
| Data represent mean values for each sample ± standard deviations (n = 3). Means followed by the same letter within a column are not significantly different (p > 0.05). *Quantified as equivalent of protocatechuic acid. **Quantified as equivalent of catechin. nd: not detected. | |||
| Ellagic acid | 301 | 283 | 0.04 ± 0.003c |
| Protocatechuic acid derivative* | 337 | 153, 109 | 25.63 ± 0.86b |
| Resveratrol derivative** | 433 | 227 | 497.8 ± 17.2a |
| Method | Results |
|---|---|
| *Abbreviations are: GAE, gallic acid equivalents, CE, catechin equivalents; TE, trolox equivalents; AAE, ascorbic acid equivalents; EDTA, ethylenediaminetetraacetic acid; Eq, equivalents. Data represent mean values (three determinations) for each sample ± standard deviations. | |
| Total phenolic content (µmol GAE/g) | 108.3 ± 1.4 |
| Total flavanoid content (µmol CE/g) | 73.0 ± 2.4 |
| Trolox equivalent antioxidant capacity (µmol TE/g) | 429.9 ± 0.01 |
| DPPH radical scavenging ability (µmol TE/g) | 27.4 ± 4.3 |
| Reducing power (µmol AAE/g) | 122.1 ± 4.2 |
| Ferrous ion chelating ability (µmol EDTA eq/g) | 0.09 ± 0.01 |
| 780 | 892 | 531 | |
|---|---|---|---|
| All values are mean (n = 50) ± SD; Values in each row having the same letter are not significantly different (p > 0.05). | |||
| Mean scores | |||
| Color | 5.1 ± 1.5a | 6.0 ± 1.1a | 4.5 ± 1.2b |
| Taste preference | 5.3 ± 1.0a | 4.3 ± 1.3b | 3.5 ± 1.0c |
| After taste | 5.4 ± 0.8a | 5.3 ± 1.1a | 3.5 ± 0.9b |
| Overall acceptance | 5.4 ± 1.1a | 4.6 ± 0.9b | 3.7 ± 0.8c |
| Willingness to drink regularly | 5.1 ± 1.1a | 4.2 ± 1.0b | 3.6 ± 1.1c |
| Friedman test ranks | |||
| Mean rank | 2.41 | 1.98 | 1.61 |
| 0 min | 30 min | 45 min | 60 min | 90 min | 120 min | |
|---|---|---|---|---|---|---|
| SEM, Standard error of mean | ||||||
| Mean difference | −7.89 | 15.9 | 10.5 | 6.9 | 10.5 | 1.54 |
| SEM | 5.58 | 16.4 | 13.7 | 16.3 | 11.9 | 5.99 |
| Baseline | End (120 min after ingestion) | Difference between baseline and end | Percentage change (%) compared to baseline at the end | |
|---|---|---|---|---|
| All values are mean (n = 15) ± SEM; Values in each column with the same letter are not significantly different (p > 0.05); Values in each row having the same letter are not significantly different (p > 0.05). * Percentage increment of plasma antioxidant capacity of bael fruit tea compared to the respective baseline is significant (p > 0.05). | ||||
| Control | 206.9 ± 44.1a | 196.1 ± 43.5a | −10.8 | – |
| Bael fruit tea | 229.1 ± 27.1a | 397.2 ± 39.4b | 168.1 | 74.6* |