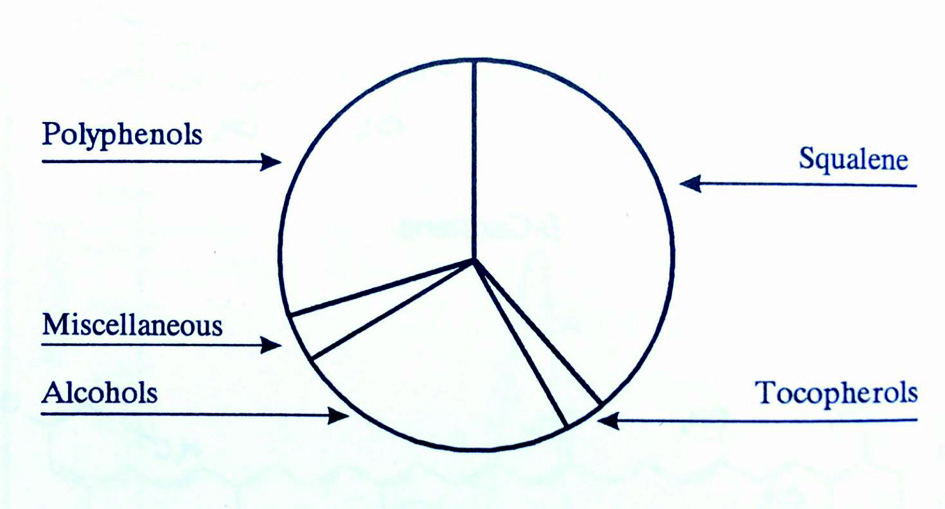
Figure 1. Unsaponifiable fraction of olive oil (Kiritsakis, 1998).
| Journal of Food Bioactives, ISSN 2637-8752 print, 2637-8779 online |
| Journal website www.isnff-jfb.com |
Review
Volume 11, September 2020, pages 31-56
A review of the evolution in the research of antioxidants in olives and olive oil during the last four decades
Figures
Tables
| Phenolic group | Compounds |
|---|---|
| Source: Adapted from Ghanbari et al. (2012). | |
| Anthocyanins | Cyanidin-3-glycoside, cyanidin-3-rutinoside, cyanidin-3-caffeyglycoside, cyanidin-3-caffeylrutinoside, delphinidin 3-rhamosylglycoside-7-xyloside |
| Flavonols and flavones | Apigenin-7-glycoside, luteolin-7-rutinoside, luteolin-7-glycoside, luteolin-5-glycoside, quercetin-3-rutinoside |
| Phenolic acids | Chlorogenic acid, caffeic acid, p-hydroxybenzoic acid, protocatechuic acid, vanillic acid, syringic acid, p-coumaric acid, o-coumaric acid, ferulic acid, sinapic acid, benzoic acid, cinnamic acid, gallic acid |
| Phenolic alcohols | (3,4-Dihydroxyphenyl) ethanol (3,4-DHPEA), (p-hydroxyphenyl) ethanol (p-HPEA) |
| Secoiridoids | Oleuropein, demethyloleuropein, ligstroside, nuzhenide hydroxycinnamic acid derivatives verbascoside |
| Olives and Olive Oil samples | Polyphenol Class | |||
|---|---|---|---|---|
| Flavonoids | Lignans | Phenolic acids | Other polyphenols | |
| “Refined” oils are deodorized, neutralized and degummed. Concentrations expressed as mg/kg (mean ± standard deviation). *Chromatography after hydrolysis. Data from www.phenol-explorer.eu (accessed Nov. 18th 2019). | ||||
| Black olives, raw | 1,598 ± 250 | 00.7 ± 00.1* | 3,075 ± 199* | 2,658 ± 340 |
| Green olives, raw | 05.6 ± 03.1 | 00.4 ± 00.1* | 2,205 ± 134* | 2,110 ± 260 |
| Extra virgin olive oil | 15.3 ± 05.7 | 10.8 ± 01.7 | 03.1 ± 00.2 | 595 ± 80 |
| Virgin olive oil | 02.3 ± 00.2 | 28.1 ± 13.6 | 05.3 ± 00.4 | 541 ± 44 |
| Refined olive oil | 01.5 ± 00.6 | 31.6 ± 11.7 | n.d. | 336 ± 39 |
| Phenolic Group | Compounds |
|---|---|
| Source: Adapted from Romani et al. (2019). | |
| Benzoic acid and Derivatives | 3-Hydroxybenzoic acid; p-Hydroxybenzoic acid; 3,4-Dihydroxybenzoic acid; Gentisic acid; Vanillic acid; Gallic acid; Siringic acid |
| Cinnamic acid and Derivatives | o-Coumaric acid; p-Coumaric acid; Caffeic acid; Ferulic acid; Sinapinic acid |
| Other Phenolic Acids and Derivatives | p-Hydroxyphenylacetic acid; 3,4-Dihydroxyphenylacetic acid; 4-Hydroxy-3-methoxyphenylacetic acid; 3-(3,4-Dihydroxyphenyl)propanoic acid |
| Phenyl Ethyl Alcohols | Tyrosol [(p-hydroxyphenyl)ethanol] or p-HPEA; Hydroxytyrosol [(3,4-dihydroxyphenyl)ethanol] or 3,4-DHPEA |
| Aglycons Secoiridoids | Oleuropein aglycon or 3,4-DHPEA-EA; Ligstroside aglycon or p-HPEA-EA; Aldehydic form of oleuropein aglycon; Aldehydic form of ligstroside aglycon |
| Dialdehydic Forms of Secoiridoids | Decarboxymethyl ligstroside aglycon (3,4-DHPEA-EDA); Decarboxymethyl oleuropein aglycon (p-HPEA-EDA) |
| Flavonols | (+)-taxifolin |
| Flavons | Apigenin; Luteolin |
| Lignans | (+)-Pinoresinol; (+)-1-Acetoxypinoresinol; (+)-1-Hydroxypinoresinol |
| Hydroxyisochromans | 1-Phenyl-6,7-dihydroxy-isochroman; 1-(3′Methoxy-4′hydroxy)phenyl-6,7-dihydroxy-isochroman |
| Treatment | Subjects | Dose of phenolics | Design | Results | Reference |
|---|---|---|---|---|---|
| 4 VOO (A, B, C, D) | 6 male healthy volunteers (27–33 years) | 50 mL samples, A: 487.5 mg/L, B: 975 mg/L, C: 1,462.5 mg/L, D: 1,950 mg/L | 4 single doses, urine sampling for 24 h | HT and T were dose-dependently absorbed and excreted in urine mainly as glucuronide conjugates. Only 30–60% of HT and 20–22% of T excreted in urine. Urinary excretion of HT metabolites, homovanillic alcohol and homovanillic acid, correlated with the dose of administered HT | Visioli et al., 2000; Caruso et al., 2001 |
| EVOO | 8 healthy volunteers (3 women and 5 men, 25–52 years) | 50 mL sample, 1,650 μg T/50 mL | Single dose, urine sampling for 24 h | T was excreted mainly in its conjugated form. Only 6–11% of T in urine was in its free form. Recovery of T at 24 h was 17–43% | Miro-Casas et al., 2001a |
| VOO | 11 healthy volunteers (6 women and 5 men, 25–65 years) | 50 mL sample, 1,055 μg HT/50 mL, 655 μg T/50 mL | Single dose, urine sampling for 24 h | HT and T are mainly excreted in conjugated form; only 5.9% of HT and 13.8% of T were in free form. Recovery of HT and T at 24 h was 32–98 and 12–32%, respectively | Miro-Casas et al., 2001b |
| 3 supplements containing olive oil phenolics | 20 healthy volunteers (12 women and 8 men, 20–75 years) | 100 mg of samples with HT, L, OE, T | 3 single doses, ileostomy effluent and urine sampling for 24 h | 55–66% of ingested olive oil phenolics are absorbed, and 5–16% is excreted as HT and T in urine | Vissers et al., 2002 |
| VOO | 6 healthy volunteers (3 women and 3 men, 25–47 years) | 25 mL sample, 49.3 mg HT/L | Single dose, plasma sampling for 8 h and urine sampling for 12 h | ≈98% of HT was present in plasma and urine in conjugated forms, mainly glucuronoconjugates | Miro-Casas et al., 2003 |
| 3 VOO (L, M, H) | 12 male healthy volunteers (20–22 years) | 40 mL samples, L: 10 mg/kg, M: 133 mg/kg; H: 486 mg/kg | 3 single doses, urine sampling for 24 h | HT and T were dose-dependently absorbed | Weinbrenner et al., 2003 |
| 3 VOO (L, M, H) | 12 male healthy volunteers (20–22 years) | 40 mL samples, L: 2.7 mg/kg, M: 164 mg/kg; H: 366 mg/kg | 3 single doses, plasma sampling for 24 h | HT and T were dose-dependently absorbed | Covas et al., 2006 |
| 2 EVOO (L, H) | 10 postmenopausal Women (47–67 years) | 50 g samples, L: 147 mg/kg, H: 592 mg/kg | 8 weeks crossover 50 g per day Urine sampling for 24 h | Urinary excretion of HT and its metabolite homovanillyl alcohol were significantly increased in subjects consuming high EVOO | Salvini et al., 2006 |
| 20 olives | 8 male healthy volunteers (30–40 years) | ≈100 g sample, 76.73 mg HT/100 g, 19.48 mg T/100 g | Single dose, blood sampling for 4 h, urine sampling for 24 h | HT and T appeared in plasma and urine, mainly as glucuronides | Kountouri et al., 2007 |
| EVOO | 10 healthy volunteers (5 women and 5 men, 24–35 years) | 50 mL sample | Single dose, urine sampling for 6 h | Tentative identification of more than 60 metabolites of olive oil polyphenols was achieved | Garcia-Villalba et al., 2010 |
| HT supplement | 10 healthy volunteers (2 women and 8 men, 22–34 years) | 2.5 mg HT/kg weight | Single dose, blood sampling for 120 min, urine sampling for 24 h | HVA was detected in plasma. The main metabolites in urine were HVA (31%), DHPA glucuronide (22.7%), and 5% free or conjugated HT | Gonzalez-Santiago et al., 2010 |
| VOO | 11 healthy volunteers (5 women and 6 men, 20–44 years) | 50 mL sample, 21.96 μmol HT/50 mL, 15.20 μmol T/50 mL, 0.27 μmol HVA/50 mL | Single dose, plasma and urine, sampling for 24 h | 13% of the olive oil polyphenols were recovered in urine, where 75% of them were glucuronides and 25% as free compounds | Khymenets et al., 2011 |
| VOO vs. PEVOO | 13 healthy volunteers (6 women and 7 men, 25–69 years) | 30 mL samples, VOO: 288.89 mg/kg, PEVOO: 961.17 mg/kg | 2 single doses, blood sampling for 300 min | 24 compounds detected, mostly secoiridoids and phenol alcohol groups in sulfated and glucuronidated forms. 14 out of 24 compounds were higher in samples of PEVOO compared to VOO | Suarez et al., 2011 |
| 3 PEVOO (L, M, H) | 12 healthy volunteers (6 women and 6 men, 22–60 years) | 30 mL samples, L: 250 mg/kg, M: 500 mg/kg, H: 750 mg/kg | 3 single doses, plasma sampling for 360 min | Dose-dependent responses of phenol conjugates were obtained in plasma. Hydroxytyrosol acetate sulfate was identified as the main biological metabolite of HT from olive oil ingestion | Rubio et al., 2012a; 2012b |
| EVOO | 45 healthy volunteers (34 women and 11 men, 21–45 years) | 50 mL sample, 509.72 mg/L | 30 days crossover, twice (30+20 mL)/day, blood sampling on days 0 and 30. | HT and its 3 metabolites, and T and its 2 metabolites, were identified in the plasma | Oliveras-Lopez et al., 2014 |
| Ordinary olive oil vs. EVOO | A healthy male volunteer | 25 mL sample, ordinary: 19.7 mmol HT/oil, EVOO: 398.2 mmol HT/oil | Single dose, blood sampling for 4 h | Higher HT levels were detected in EVOO, whereas HT levels in ordinary olive oil were undetectable. 0.3% of the administered dose of free HT was detected in plasma | Pastor et al., 2016 |
| HT capsules (A, B, C) | 21 male volunteers | A: 25 mg HT/day, B: 5 mg HT/day, C: Placebo | 7 days treatment and 1 week wash-out, cross-over, urine sampling for 24 h | 21–28% of the HT and its metabolites (mainly HT-glucuronide 3′, 16.6–23.6%) were recovered in the urine. Interindividual variability was 10% | Khymenets et al., 2016 |
| Olive oil extract | 3 healthy volunteers (25–30 years) | 50 mL sample, 120 mg HT+OE | Blood sampling for 120 min | 3 metabolites, namely HT-3-O-sulphate, HT acetate sulphate and homovanillic alcohol sulphate were idemtified in collected samples | Lopez de las Hazas et al., 2016 |
| EVOO | 9 healthy volunteers (6 women & 3 men, 24–61 years) | 50 mL sample, 322 mg phenolics/kg + 6 mg HT and derivatives/20 g | Single dose, plasma sampling for 6 h, urine sampling for 24 h | Plasma and urinary secoiridoid compounds (oleuropein and ligstroside derivatives) were selected as biomarkers | Silva et al., 2018 |