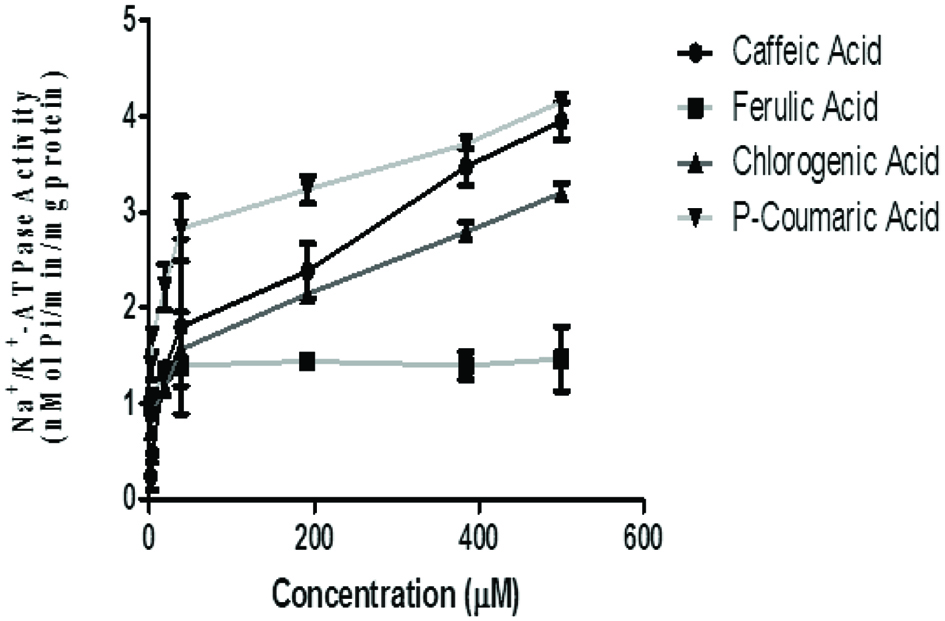
Figure 1. Effect of the phenolic acids (caffeic, ferulic, chlorogenic and p-coumaric acid) on Na+/K+-ATPase Activity in isolated rat brain. Values represent mean ± SD of triplicate experimental readings.
| Journal of Food Bioactives, ISSN 2637-8752 print, 2637-8779 online |
| Journal website www.isnff-jfb.com |
Original Research
Volume 7, September 2019, pages 56-62
Modulatory effect of selected phenolic acids on enzyme activities of purinergic signaling
Figures
Tables
| Enzyme activity | Caffeic Acid | Ferulic Acid | Chlorogenic Acid | p-coumaric Acid |
|---|---|---|---|---|
| Values represent means ± standard deviation (n = 3). a–dMean values with the same superscript letter on the same row are not significantly different (p > 0.05). | ||||
| Na+/K+-ATPase | 75.57 ± 0.22c | 3.48 ± 0.09a | 253.9 ± 0.14d | 48.59 ± 0.15b |
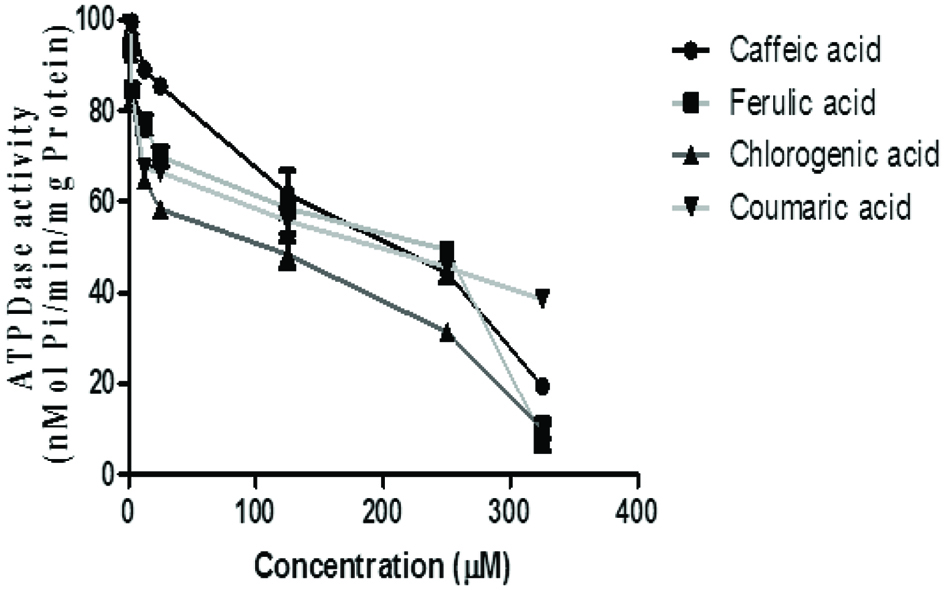
| ATPDase | 346.9 ± 0.03d | 27.48 ± 0.02c | 18.37 ± 0.07b | 17.56 ± 0.04a |
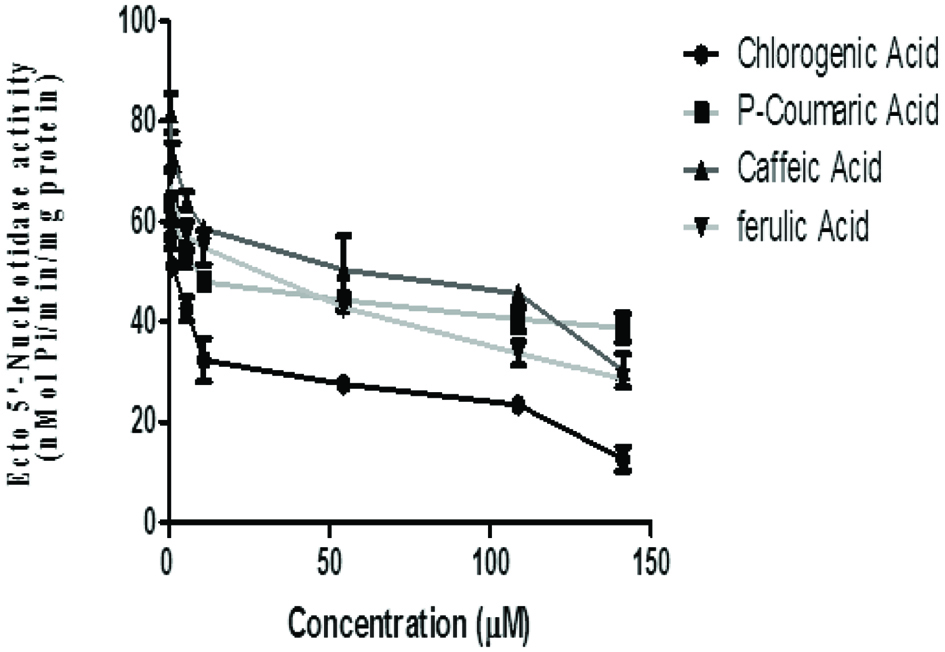
| Ecto-5′ nucleotidase | 8.25 ± 4.13a | 6.22 ± 1.76a,b | 12.48 ± 3.26b | 35.31 ± 1.59c |
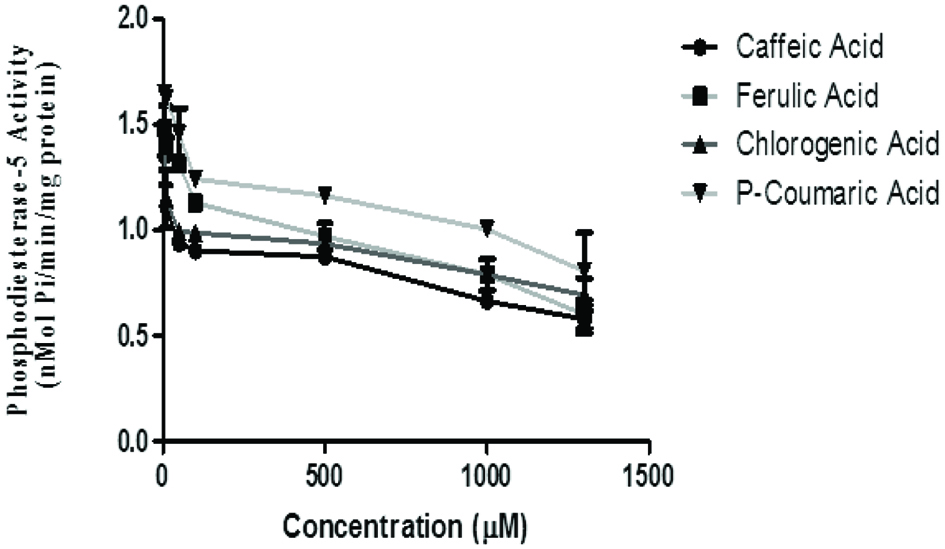
| Phosphodiesterase-5′ | 35.73 ± 0.11b | 400.3 ± 0.05d | 21.03 ± 0.21a | 128.4 ± 0.08c |
| Caffeic Acid | Ferulic Acid | Chlorogenic Acid | p-coumaric Acid | |
|---|---|---|---|---|
| Values represent means ± standard deviation (n = 3). a–dMean values with the same superscript letter on the same row are not significantly different (p > 0.05). *µmol. Trolox Antioxidant Equivalent. | ||||
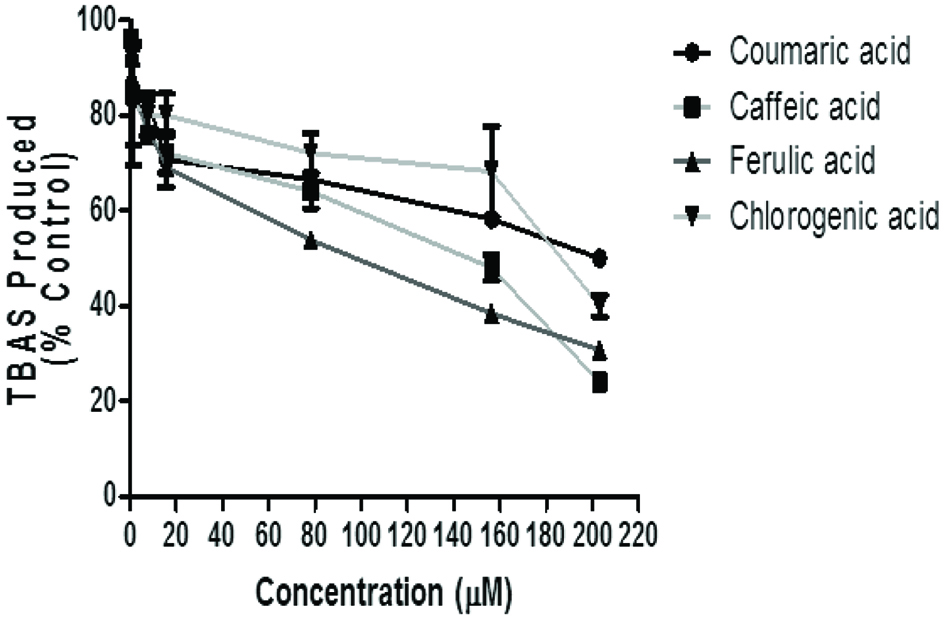
| TBAS Production | 14.85 ± 0.12b | 81.38 ± 0.04d | 7.54 ± 6.42a | 32.61 ± 2.87c |
| DPPH scavenging ability | 91.73 ± 1.70d | 79.42 ± 1.59c | 10.33 ± 8.89a | 20.30 ± 3.01b |
| ABTS scavenging ability* | 8.72 ± 0.07b | 13.88 ± 0.06c | 7.211 ± 0.06a | 63.07 ± 0.06d |