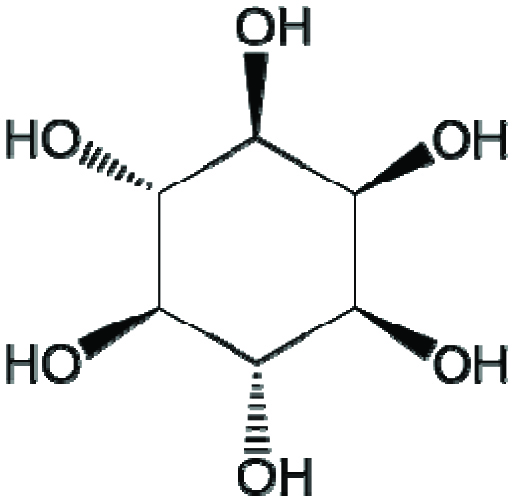
Figure 1.
Chemical structure of myo-inositol.
| Journal of Food Bioactives, ISSN 2637-8752 print, 2637-8779 online |
| Journal website www.isnff-jfb.com |
Review
Volume 1, March 2018, pages 41-55
Inositol phosphates: health implications, methods of analysis, and occurrence in plant foods
Figures
Chemical structure of myo-inositol.
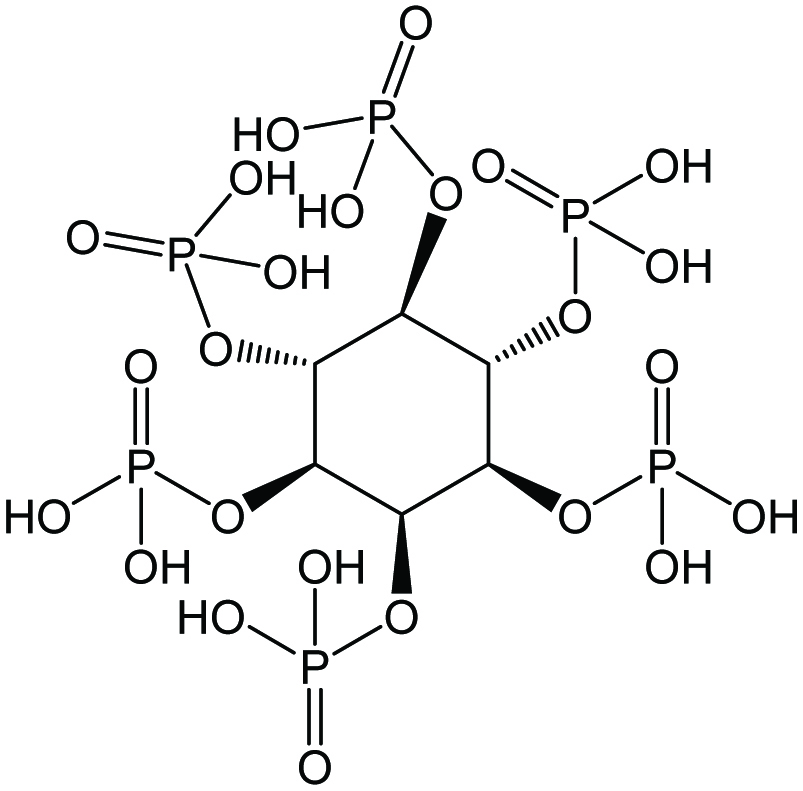
Chemical structures of myo-inositol hexakisphosphate (InsP6) or phytic acid.
Tables
| Sample | Taxonomic names | InsP6 content (µmol/g)* |
|---|---|---|
| *InsP6: myo-inositol hexakisphosphate. 1Barrier-Guillot et al. 1996; 2Blatny et al. 1995; 3Burbanoet et al. 1995; 4Carnovale et al. 1988; 5Chen 2004; 6de Koning 1994; 7Dost and Karaca 2016; 8El Tinay et al. 1989; 9Ferguson et al. 1988; 10Fredrikson et al. 2001; 11Harland and Oberleas 1986; 12Helfrich and Bettmer 2004; 13Hídvégi and Lásztity 2002; 14Karkle and Beleia 2010; 15Kasim and Edwards 1998; 16Lehrfeld 1989; 17Lestienne et al. 2005a; 18Lolas et al. 1976; 19Lott et al. 2000; 20Marfo et al. 1990; 21Morris and Hill 1996; 22Nahapetian and Bassiri 1976; 23O’Dell et al. 1972; 24Radhakrishnan & Sivaprasad 1980; 25Ravindran et al. 1994; 26Rodehutscord et al. 2016; 27Simonet et al. 2003; 28Simwemba et al. 1984; 29Singh and Sedeh 1979; 30Steiner et al. 2007; 31Talamond et al. 2000; 32Venkatachalam and Sathe 2006; 33Wang et al. 1959; 34Zdunczyk et al. 1997. | ||
| Cereal | ||
| Barley | Hordeum vulgare L. | 5.7–18.92,13,15,16,18,19,26,30 |
| Maize | Zea mays L. | 3.3–19.52,12,13,15–17,19,20,23,25,26,31 |
| Millet | Pennisteum spp. | 3.6–16.517,25,28,31 |
| Oats | Avena sativa L. | 6.3–21.56,11,13,15,18,19,26,30 |
| Rice | Oryza sativa L. | 4.7–16.46,17,19,23,25 |
| Rye | Secale cereale L. | 6.6–14.716,19,26,30 |
| Sorghum | Sorghum spp. | 5.5–19.815–17,19,20,24,25,31,33 |
| Triticale | x Triticosecale Wittm. | 3.5–15.216,19,26,29,29 |
| Wheat | Triticum spp. | 4.9–20.51,13,15,6,18,19,22,23,26,30 |
| Legume | ||
| Chickpeas | Cicer arietinum L. | 4.2–19.13,8,19,21,27 |
| Common beans | Phaseolus vulgaris L. | |
| Black beans | 6.7–14.95,21 | |
| Kidney beans | 7.4–16.15,4,9,21,31 | |
| Pinto beans | 7.8–12.15,21,27 | |
| Great Northern beans | 12.7–13.15,21 | |
| Navy beans | 12.4–12.65,21 | |
| White beans | 7.4–25.88,27 | |
| Cowpeas | Vigna unguiculata L. | 4.4–13.913,17,19–21,31 |
| Lentils | Lens culinaris Medikus | 3.7–15.93,12,19,21,27 |
| Mung beans | Vigna radiata (L.) R. Wilczek | 3.6–5.95,17 |
| Peas | Pisum sativum L. | 6.5–20.213,10,19,34 |
| Peanuts | Arachis hypogaea L. | 2.6–10.37,19,31,32 |
| Soybeans | Glycine max (L.) Merr. | 13.3–28.88,13,14,17–20,31 |
| Sample | Taxonomic names | InsP6 content (µmol/g)* |
|---|---|---|
| *InsP6: myo-inositol hexakisphosphate. 1Chen 2004; 2Dost and Karaca 2016; 3Duong et al. 2017a; 4Duong et al. 2017b; 5Harland et al. 2004; 6Helfrich and Bettmer 2004; 7Liu et al. 2009; 8Lott et al. 2000; 9Simonet et al. 2003; 10Venkatachalam and Sathe 2006. | ||
| Almonds | Prunus dulcis [Mill.] D.A. Webb | 5.3–32.01,2,4–10 |
| English walnuts | Juglans regia L. | 2.7–21.01,2,3,5,8,10 |
| Cashews | Anacardium occidentale L. | 2.3–29.81,3,5,8,10 |
| Brazil nuts | Bertholletia excelsa Humb. & Bonpl.: Lecythidaceae | 2.9–27.33,8,10 |
| Macadamias | Macadamia integrifolia Maiden & Betche | 2.3–14.31,3,5,10 |
| Pistachios | Pistachia vera L. | 3.0–43.03,5,8,10 |
| Pecans | Carya illinoinensis (Wangenh.) K. Koch. | 1.8–28.93,5,10 |
| Hazelnuts | Corylus avellana L. | 2.2–35.52,3,5-10 |
| Pine nuts | Pinus L. | 3.0–11.98,10 |
| Sample | Lower inositol phosphate content (µmol/g) | ||||
|---|---|---|---|---|---|
| InsP5 | InsP4 | InsP3 | InsP2 | InsP1 | |
| *InsP1–5 are myo-inositol monophosphate, myo-inositol bisphosphate, myo-inositol trisphosphate, myo-inositol tetrakisphosphate, myo-inositol pentakisphosphate, respectively. N.d.: not detected and the author(s) did not specify the limit of detection: 1Burbano et al.1995; 2Chen et al. 2007; 3Duong et al. 2017a; 4Duong et al. 2017b; 5Helfrich and Bettmer 2004; 6Kasim and Edwards 1998; 7Liu et al. 2009; 8Morris and Hill 1996; 9Rodehutscord et al. 2016; 10Simonet et al. 2003. | |||||
| Cereals | |||||
| Barley | N.d.–0.86,9 | N.d.6,9 | N.d.–2.96,9 | – | – |
| Maize | 0.3–2.55,6,9 | N.d.– 0.75,6,9 | 0.1–0.59 | – | – |
| Oat | 0.1–0.29 | N.d. 6,9 | N.d.6,9 | – | – |
| Rye | 0.2–0.49 | N.d.9 | N.d.9 | – | – |
| Sorghum | N.d.–0.96 | N.d.6 | N.d.6 | – | – |
| Triticale | 0.2–0.49 | N.d.9 | N.d.9 | – | – |
| Wheat | N.d.–0.56.9 | N.d.6,9 | N.d.6,9 | – | – |
| Legumes | |||||
| Chickpeas | – 2.11,8,10 | 0.04–0.61,8,10 | <0.005–0.61,6,8 | 0.310 | 0.110 |
| Common beans | |||||
| Black beans | 0.5–3.24,8 | 0.18 | <0.0058 | – | – |
| Great Northern beans | 0.6–2.24,8 | 0.28 | <0.0058 | – | – |
| Navy beans | 0.6–1.84,8 | 0.18 | <0.0058 | – | – |
| Pink beans | 0.64 | – | – | – | – |
| Pinto beans | 0.3–3.12,8,10 | 0.2–0.78,10 | <0.005–0.28,10 | 0.210 | 0.110 |
| Red kidney bean | 0.3–1.82,8,10 | 0.28 | <0.0058 | – | – |
| White beans | 3.010 | 0.610 | 0.210 | 0.210 | 0.210 |
| Cow peas | 2.58 | 0.38 | 0.018 | – | – |
| Lentils | 0.2–3.21,5,8,10 | 0.1–0.81,5,8,10 | 0.3–0.41,8,10 | 0.310 | 0.210 |
| Mung beans | 1.22 | – | – | – | – |
| Tree nuts | |||||
| Almonds | 0.4–10.02,4,5,7,10 | 0.4–8.54,5,7,10 | 1.0–1.84,7,10 | 0.7–3.84,7,10 | <0.002– 1.54,7,10 |
| Cashews | 1.3–6.62,3,5 | 0.3–1.23,5 | 0.2– 0.53,5 | 0.07– 0.23,5 | <0.002– 0.23,5 |
| Hazelnuts | 0.4–1.23,5,7,10 | 0.2–1.13,7,10 | 0.01–0.53,7,10 | 0.04–0.53,7,10 | 0.003–0.33,7,10 |
| Macadamias | 0.6–1.22,3 | 0.23 | 0.023 | <0.0023 | 0.063 |
| Pecans | 0.3–0.52,3 | 0.23 | 0.083 | 0.023 | 0.043 |
| Pine nuts | 1.510 | 1.110 | 0.710 | 0.910 | 1.110 |
| English Walnuts | 0.8–1.62,3 | 0.23 | 0.023 | <0.0023 | 0.073 |