Journal of Food Bioactives, ISSN 2637-8752 print, 2637-8779 online
Journal website www.isnff-jfb.com

Original Research

Volume 1, March 2018, pages 166-173


Antihypertensive effect of aqueous polyphenol extracts of Amaranthusviridis and Telfairiaoccidentalis leaves in spontaneously hypertensive rats

Figures

Figure 1.
Figure 1.

ACE-inhibitory activity of Amaranthusviridis (AV) and Telfariaoccidentalis (TO) polyphenol concentrates at 0.5 mg/mL.

0–80 represent applied nitrogen fertilizer at planting (T1) or 1 week after seedling emergence (T2). Bars with different letters have significantly different (P < 0.05) mean values.
Figure 2.
Figure 2.

Renin-inhibitory activity of Amaranthusviridis (AV) and Telfariaoccidentalis (TO) polyphenol concentrates at 0.25 mg/mL.

0–80 represent applied nitrogen fertilizer at planting (T1) or 1 week after seedling emergence (T2). Data are expressed as mean ± standard deviation. Bars with different letters have significantly different (P < 0.05) mean values.
Figure 3.
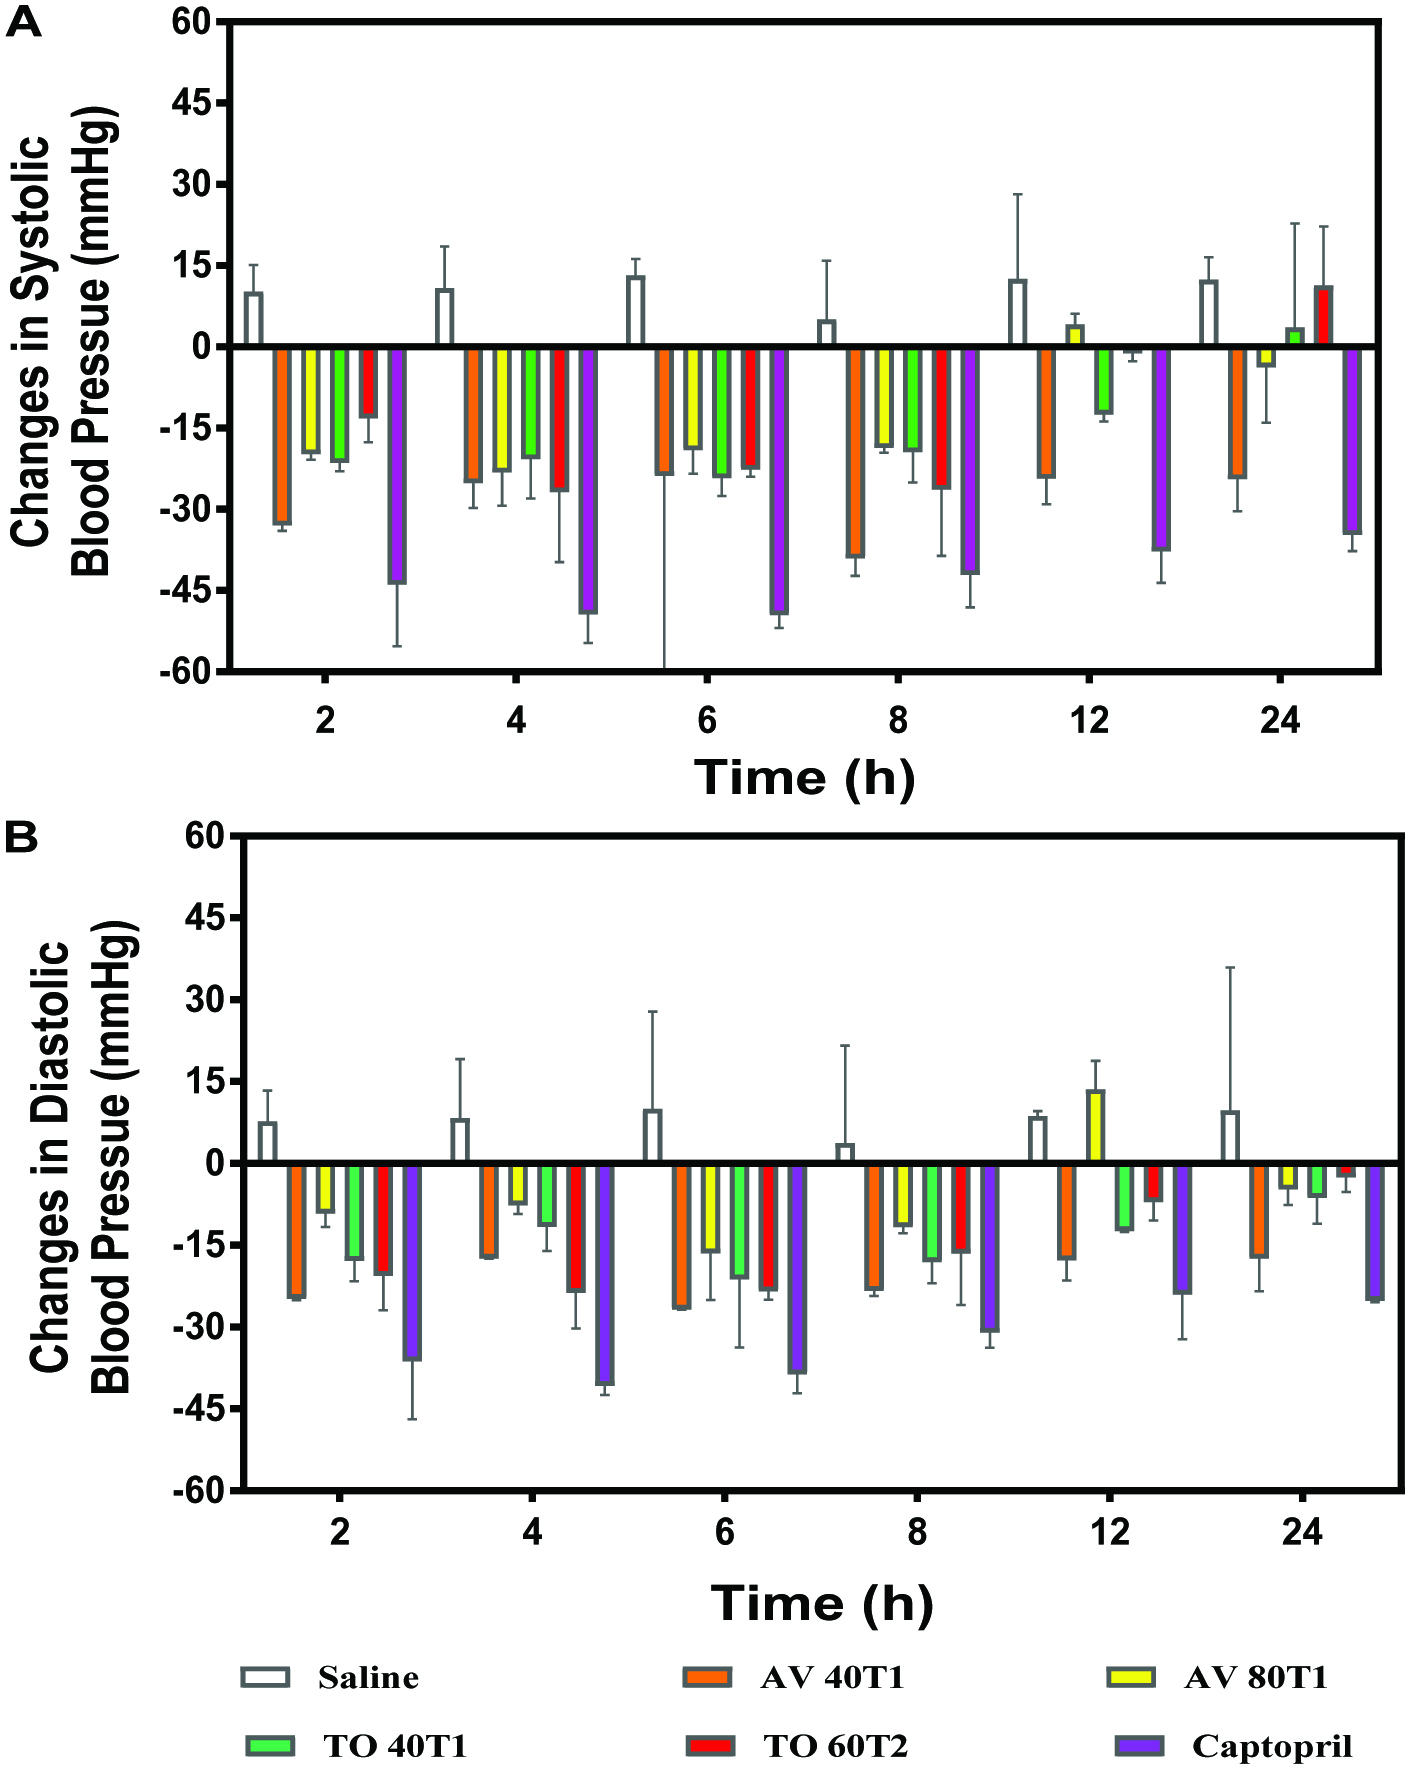
Figure 3. (A) Changes in Systolic and (B) Diastolic blood pressure (mmHg) of spontaneously hypertensive rats after oral administration of 100 mg/kg body weight polyphenol concentrates from Amaranthusviridis (AV 40T1 and AV 80T2), and Telfairiaoccidentalis f. treatments (TO 40T1 and TO 60T2). 40, 60, and 80 represent applied nitrogen fertilizer at planting (T1) or 1 week after seedling emergence (T2).
Figure 4.
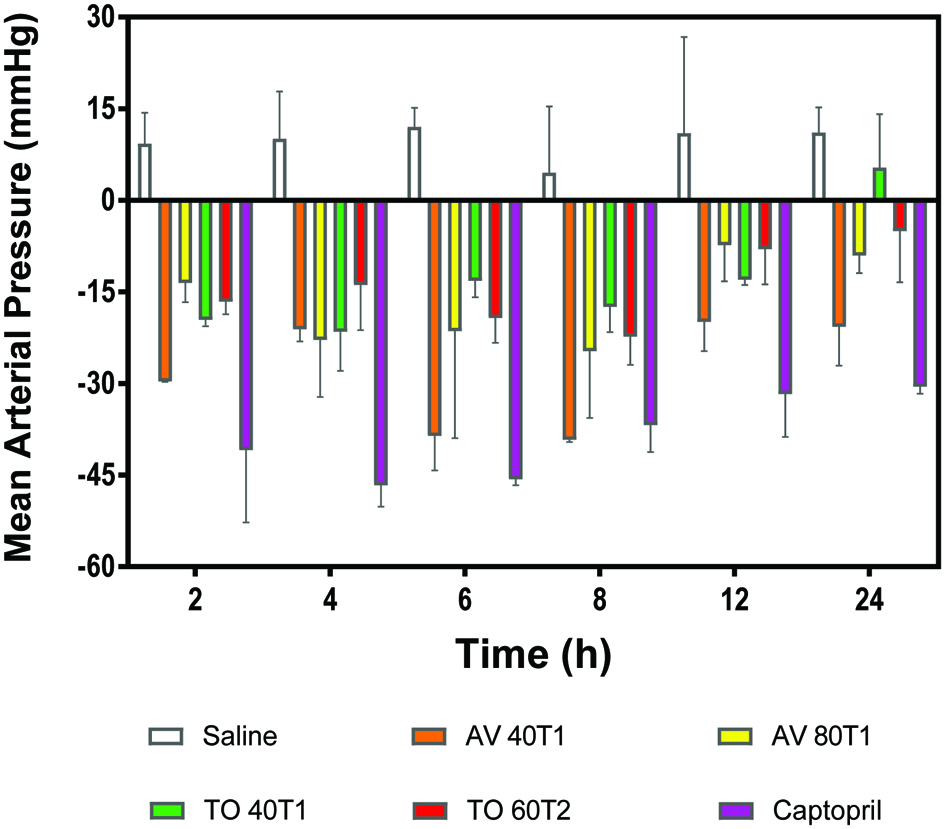
Figure 4. Changes in mean arterial blood pressure (mmHg) of spontaneously hypertensive rats after oral administration of 100 mg/kg body weight polyphenol concentrates from Amaranthusviridis (AV 40T1 and AV 80T2), and Telfairiaoccidentalis f. treatments (TO 40T1 and TO 60T2). 40, 60, and 80 represent applied nitrogen fertilizer at planting (T1) or 1 week after seedling emergence (T2).
Figure 5.
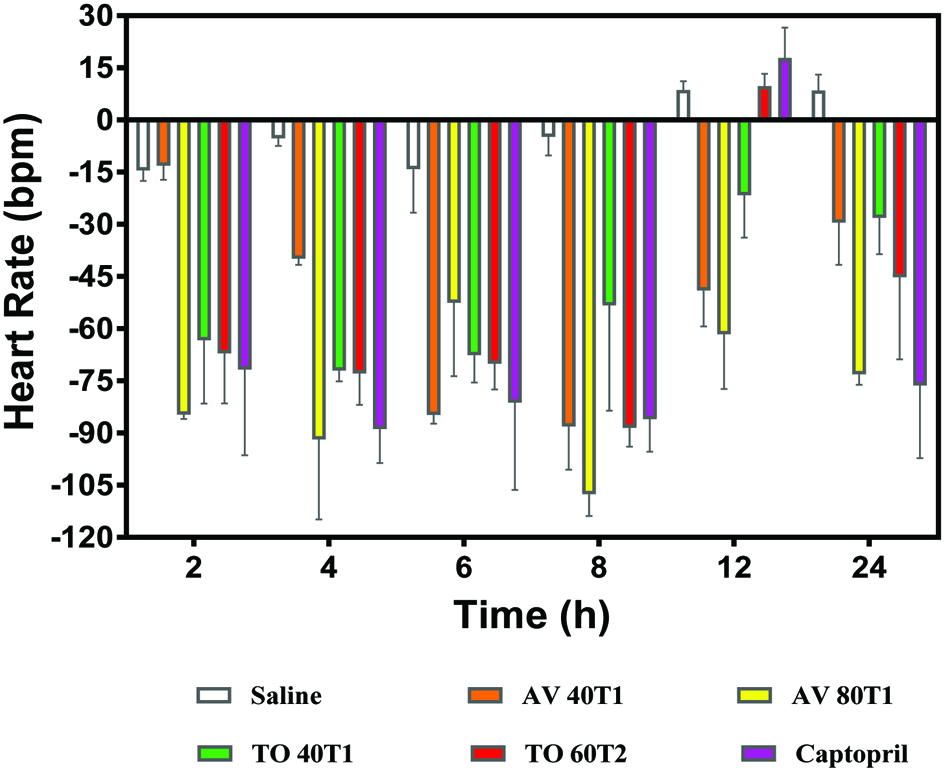
Figure 5. Changes in heart rate (bpm) of spontaneously hypertensive rats after oral administration of 100 mg/kg body weight polyphenol concentrates from Amaranthusviridis (AV 40T1 and AV 80T2), and Telfairiaoccidentalis f. treatments (TO 40T1 and TO 60T2). 40, 60, and 80 represent applied nitrogen fertilizer at planting (T1) or 1 week after seedling emergence (T2).

Tables

Table 1. Total phenoliccontent (mggallic acid equivalent/g) of Amaranthusviridis (AV) and Telfairiaoccidentalis (TO) leaf extracts
 
SamplesAVTO
*Mean + standard deviation. For each column, values with different letters are significantly different (P < 0.05).
0T1462.09 ± 1.42a,b597.57 ± 1.50f
0T2466.18 ± 2.45b,c581.94 ± 3.97c,d
20T1460.46 ± 2.83a585.42 ± 0.00d
20T2469.44 ± 5.10c590.63 ± 2.60e
40T1462.91 ± 1.42a,b573.26 ± 1.50b
40T2460.46 ± 3.74a582.81 ± 2.60c,d
60T1462.09 ± 1.42a,b578.47 ± 1.50c
60T2462.91 ± 1.42a,b557.64 ± 6.01a
80T1461.27 ± 2.45a,b592.36 ± 1.50e
80T2463.73 ± 0.00a,b611.46 ± 2.60g


Table 2. Estimated phenolic compounds in Amaranthusviridis (AV) and Telfairiaoccidentalis (TO) leaf aqueous extract (mg/g dry weight)*
 
SamplesCaffeic acidRutinMyricetin
AVTOAVTOAVTO
*0, 20, 40, 60, 80 indicate amount of applied urea fertilizer (kg/ha); T1 and T2 represents fertilizer applied at planting and 1 week after seedling emergence, respectively.
0T11.57 ± 0.086.22 ± 0.041.55 ± 1.340.05 ± 0.000.17 ± 0.150.01 ± 0.00
0T21.55 ± 0.044.19 ± 0.021.24 ± 0.920.01 ± 0.000.17 ± 0.050.01 ± 0.00
20T11.70 ± 0.045.23 ± 0.111.18 ± 0.150.06 ± 0.000.15 ± 0.010.01 ± 0.00
20T21.62 ± 0.013.64 ± 0.260.94 ± 0.040.05 ± 0.020.13 ± 0.010.01 ± 0.00
40T10.30 ± 0.047.33 ± 0.020.33 ± 0.020.07 ± 0.000.11 ± 0.010.01 ± 0.00
40T21.14 ± 0.946.66 ± 0.431.16 ± 0.770.32 ± 0.140.14 ± 0.030.01 ± 0.00
60T11.62 ± 0.057.73 ± 0.101.04 ± 0.540.07 ± 0.000.17 ± 0.020.01 ± 0.00
60T21.54 ± 0.025.24 ± 0.290.94 ± 0.050.03 ± 0.000.17 ± 0.020.01 ± 0.00
80T11.49 ± 0.024.64 ± 0.150.89 ± 0.010.03 ± 0.000.08 ± 0.060.00 ± 0.00
80T21.44 ± 0.066.88 ± 0.020.80 ± 0.070.06 ± 0.000.05 ± 0.000.01 ± 0.00


Table 3. Results from 3-way ANOVA and Duncan’s test of the effects of vegetable variety, VV; fertilizer dose, D; fertilizer application time, FT; Telfairiaoccidentalis, TO; Amaranthusviridis, AV; (0T–80T as fertilizer dosing treatments) on ACE and renin inhibitory activities of vegetable extracts
 
ParametersSource of variation (F value)Mean inhibition ofFDMean inhibition of VVMean inhibition for application time
*Significant at P < 0.05; Mean inhibition values (followed in brackets by the standard error of the mean) within the same variable (FD, VV, FT) with different alphabets within the same row (parameter) are significantly different (P < 0.05).
VVDFTVV*DVV*FTD*FTVV*D*FT20T40T60T80T0TAVTOBeforeAfter
ACE183.56*12.86*4.87*7.31*0.360.903.62*41.71a43.49a60.98b59.19b56.39b38.33a66.17b54.52b49.98a
(2.39)(2.34)(2.34)(2.39)(2.34)(1047)(1.43)(1.41)(1.49)
Renin23.43*3.18*0.4810.29*0.381.430.8026.77bc31.58c18.67ab18.22ab17.20a30.07b15.80a23.96a21.92a
(3.43)(3.21)(3.21)(3.43)(3.21)(2.11)(2.06)(2.03)(2.14)