Journal of Food Bioactives, ISSN 2637-8752 print, 2637-8779 online
Journal website www.isnff-jfb.com

Review

Volume 2, Number , June 2018, pages 1-15


Influence of branched chain amino acids on insulin sensitivity and the mediator roles of short chain fatty acids and gut hormones: a review

Figures

Figure 1.
Figure 1.

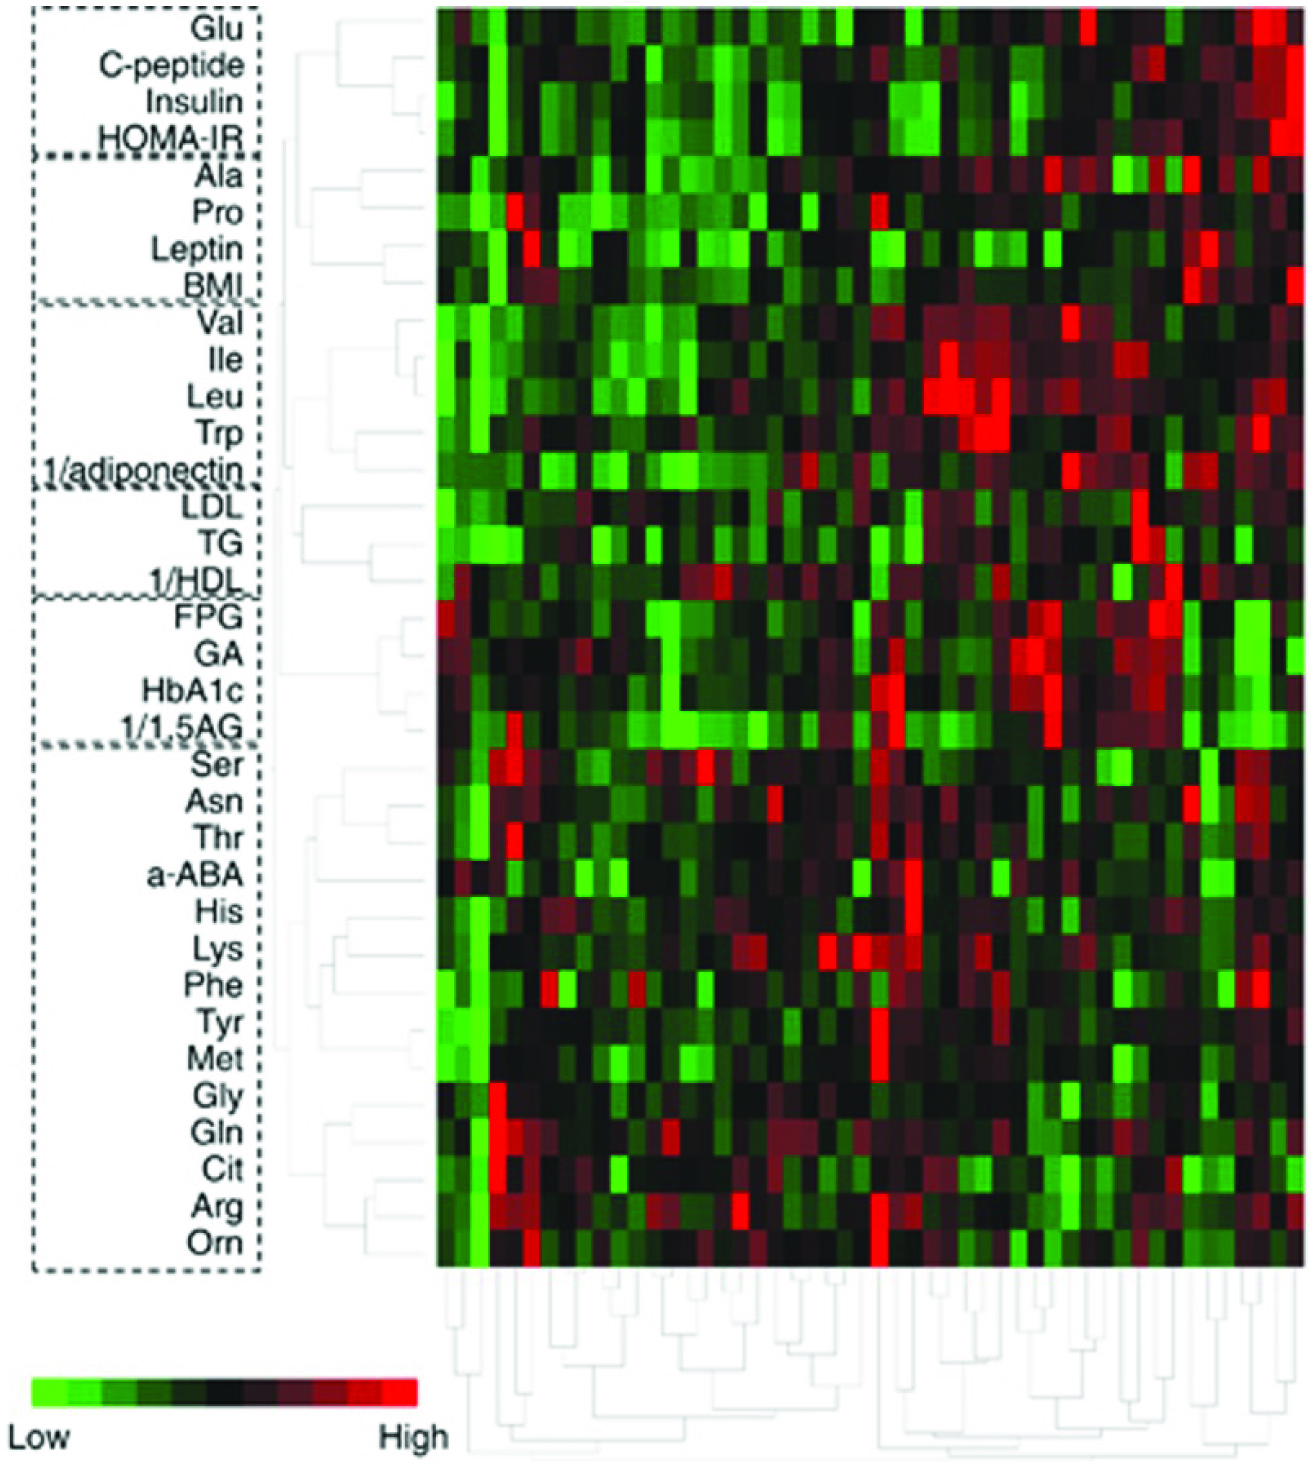
Cluster analysis of plasma amino acid with clinical variables relating to glucose, insulin resistance and lipid homeostasis in 51 type 2 diabetic patients using Ward’s method.

The following 21 amino acids were measured: Ala, alpha-aminobutyric acid (a-ABA), arginine (Arg), asparagine (Asn), citrulline (Cit), Glu, glutamine (Gln), Gly, histidine (His), isoleucine (Ile), leucine (Leu), lysine (Lys), methionine (Met), ornithine (Orn), phenylalanine (Phe), proline (Pro), serine (Ser), threonine (Thr), Trp, Tyr and valine (Val). Adapted from Nakamura et al., (2014). Furthermore, BCAAs were in the same cluster as insulin-related variables such as insulin, C-peptide (pro-hormone of insulin) and HOMA-IR and adiponectin (With permission; from Nakamura et al., 2014).
Figure 2.
Figure 2.

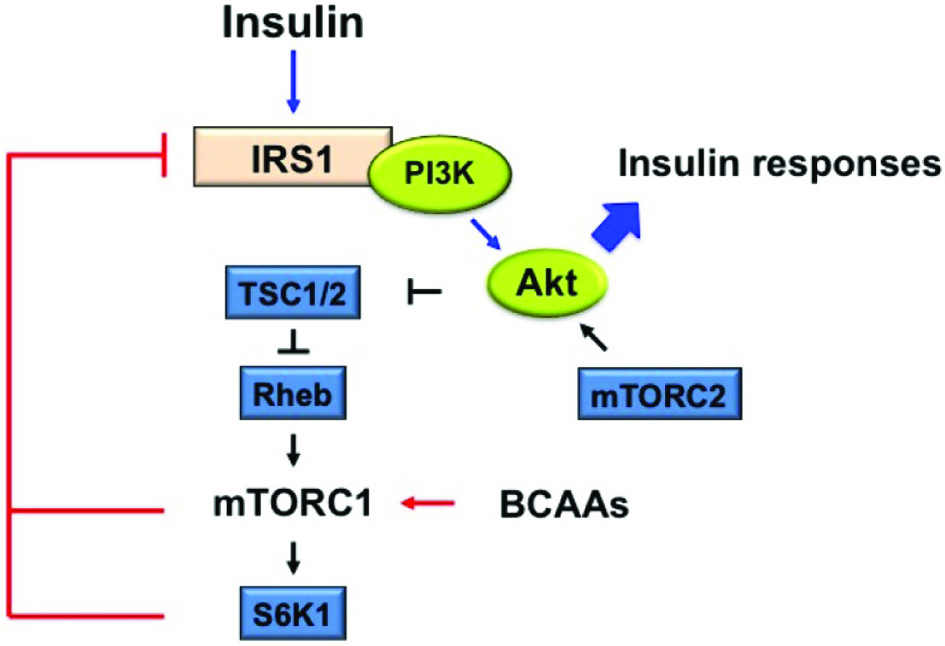
Proposed mechanism of branched-chain amino acids (BCAAs)-stimulated mammalian target of rapamycin complex1 (mTORC1) activation on insulin resistance (IR).

BCAAs enable mTORC1 activation resulting in insulin receptor substrate 1 (IRS-1) phosphorylation by S6K1at serine 307, 636/639, 1101, 312, thereby inhibiting IRS-1. Impaired protein kinase B which is also known as Akt activation through the negative feedback regulation decreases insulin responses such as increase glucose uptake and glycogen synthesis and reduced glucose synthesis (With permission; from Yoon, 2016).
Figure 3.
Figure 3.

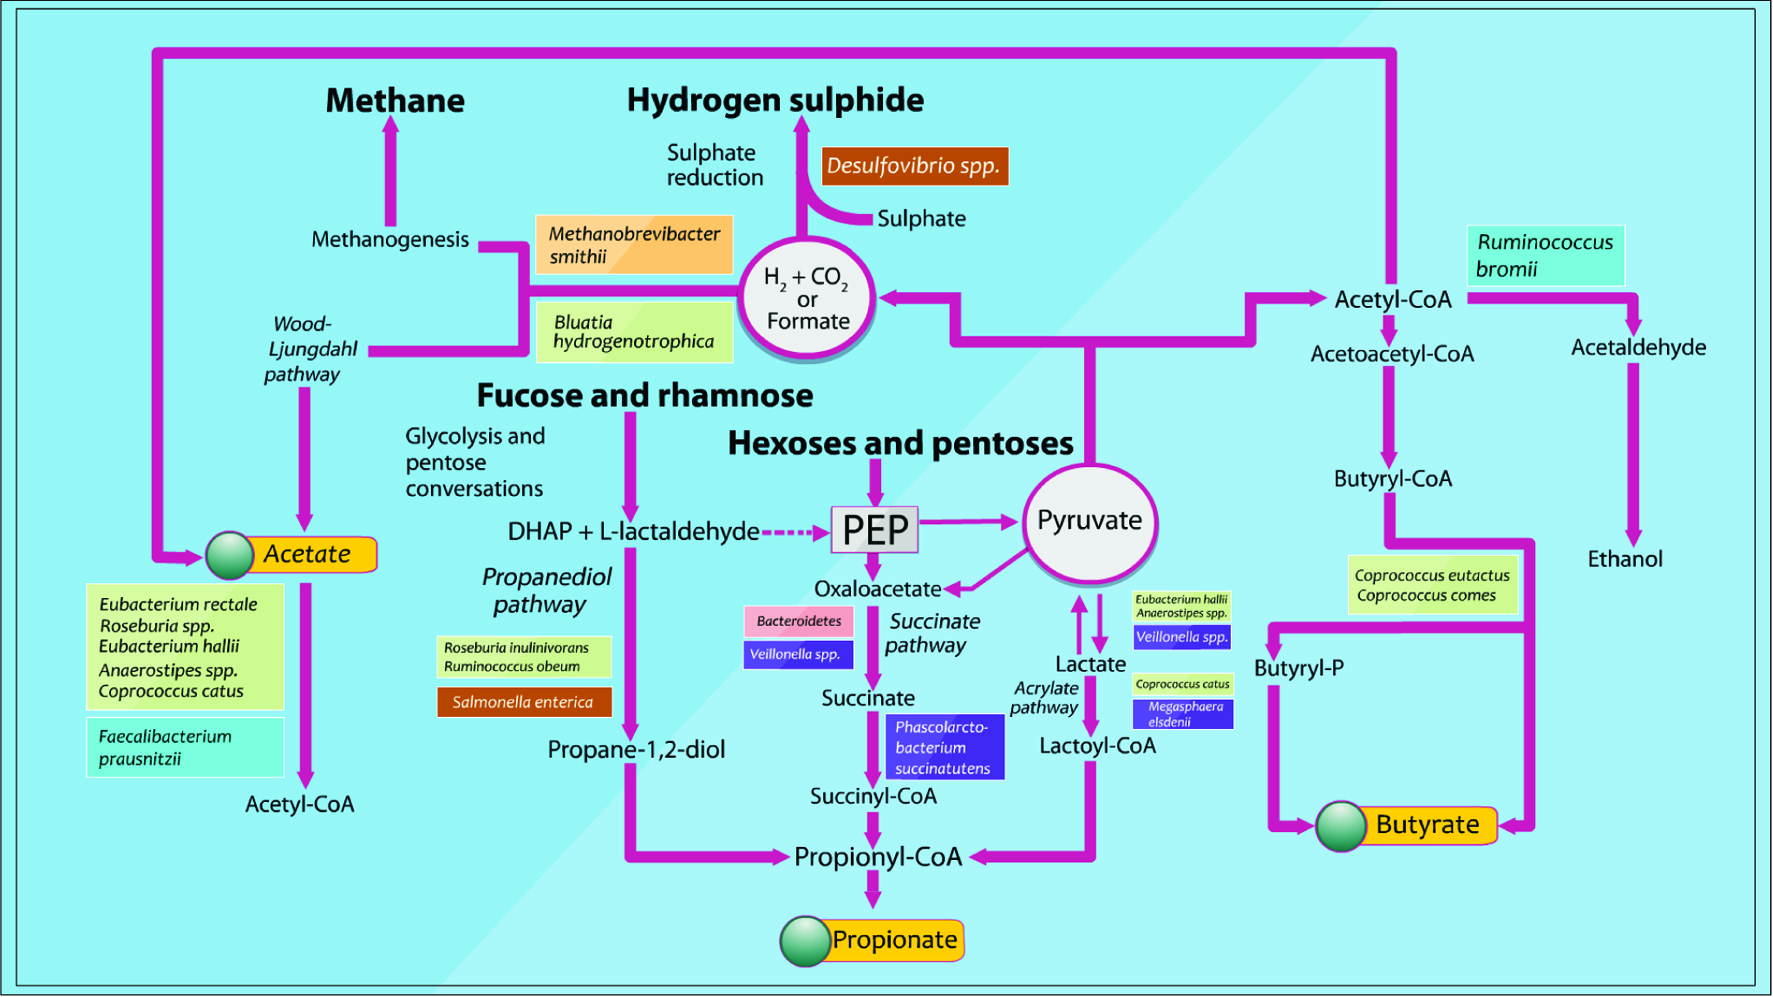
Pathways identified for the biosynthesis of major microbial metabolites and SCFAs from carbohydrate fermentation and bacterial cross-feeding (Adapted from Louis et al., 2014).

Figure 4.
Figure 4.

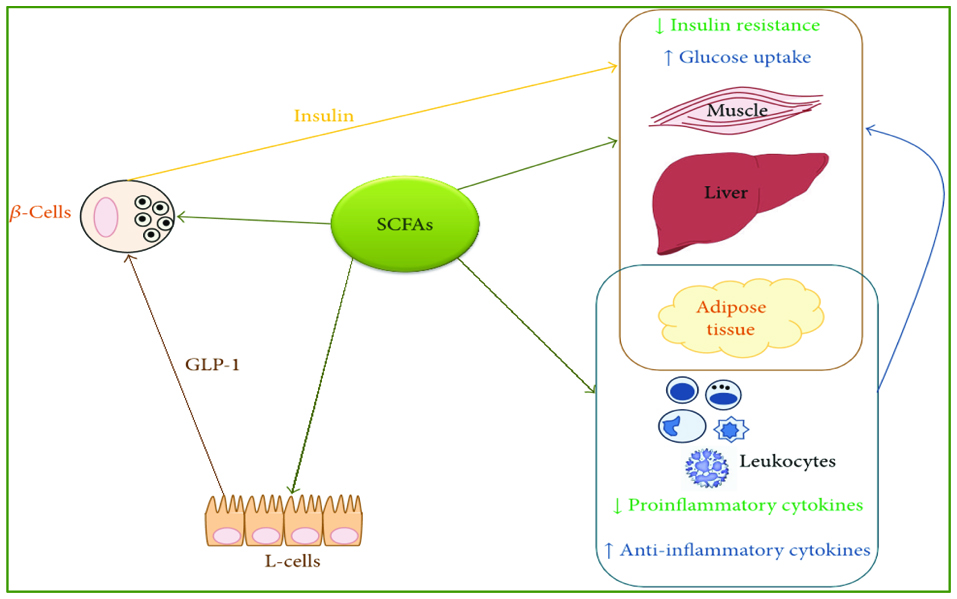
A graphic depiction of SFCAs as HDAC inhibitors and thus genetic inducers of Enteroendocrine L-cells, pancreatic beta-cells, and anti-inflammatory cytokines resulting in increased insulin levels and anti-inflammatory states (With permission; from Patil et al., 2012a).

Figure 5.
Figure 5.

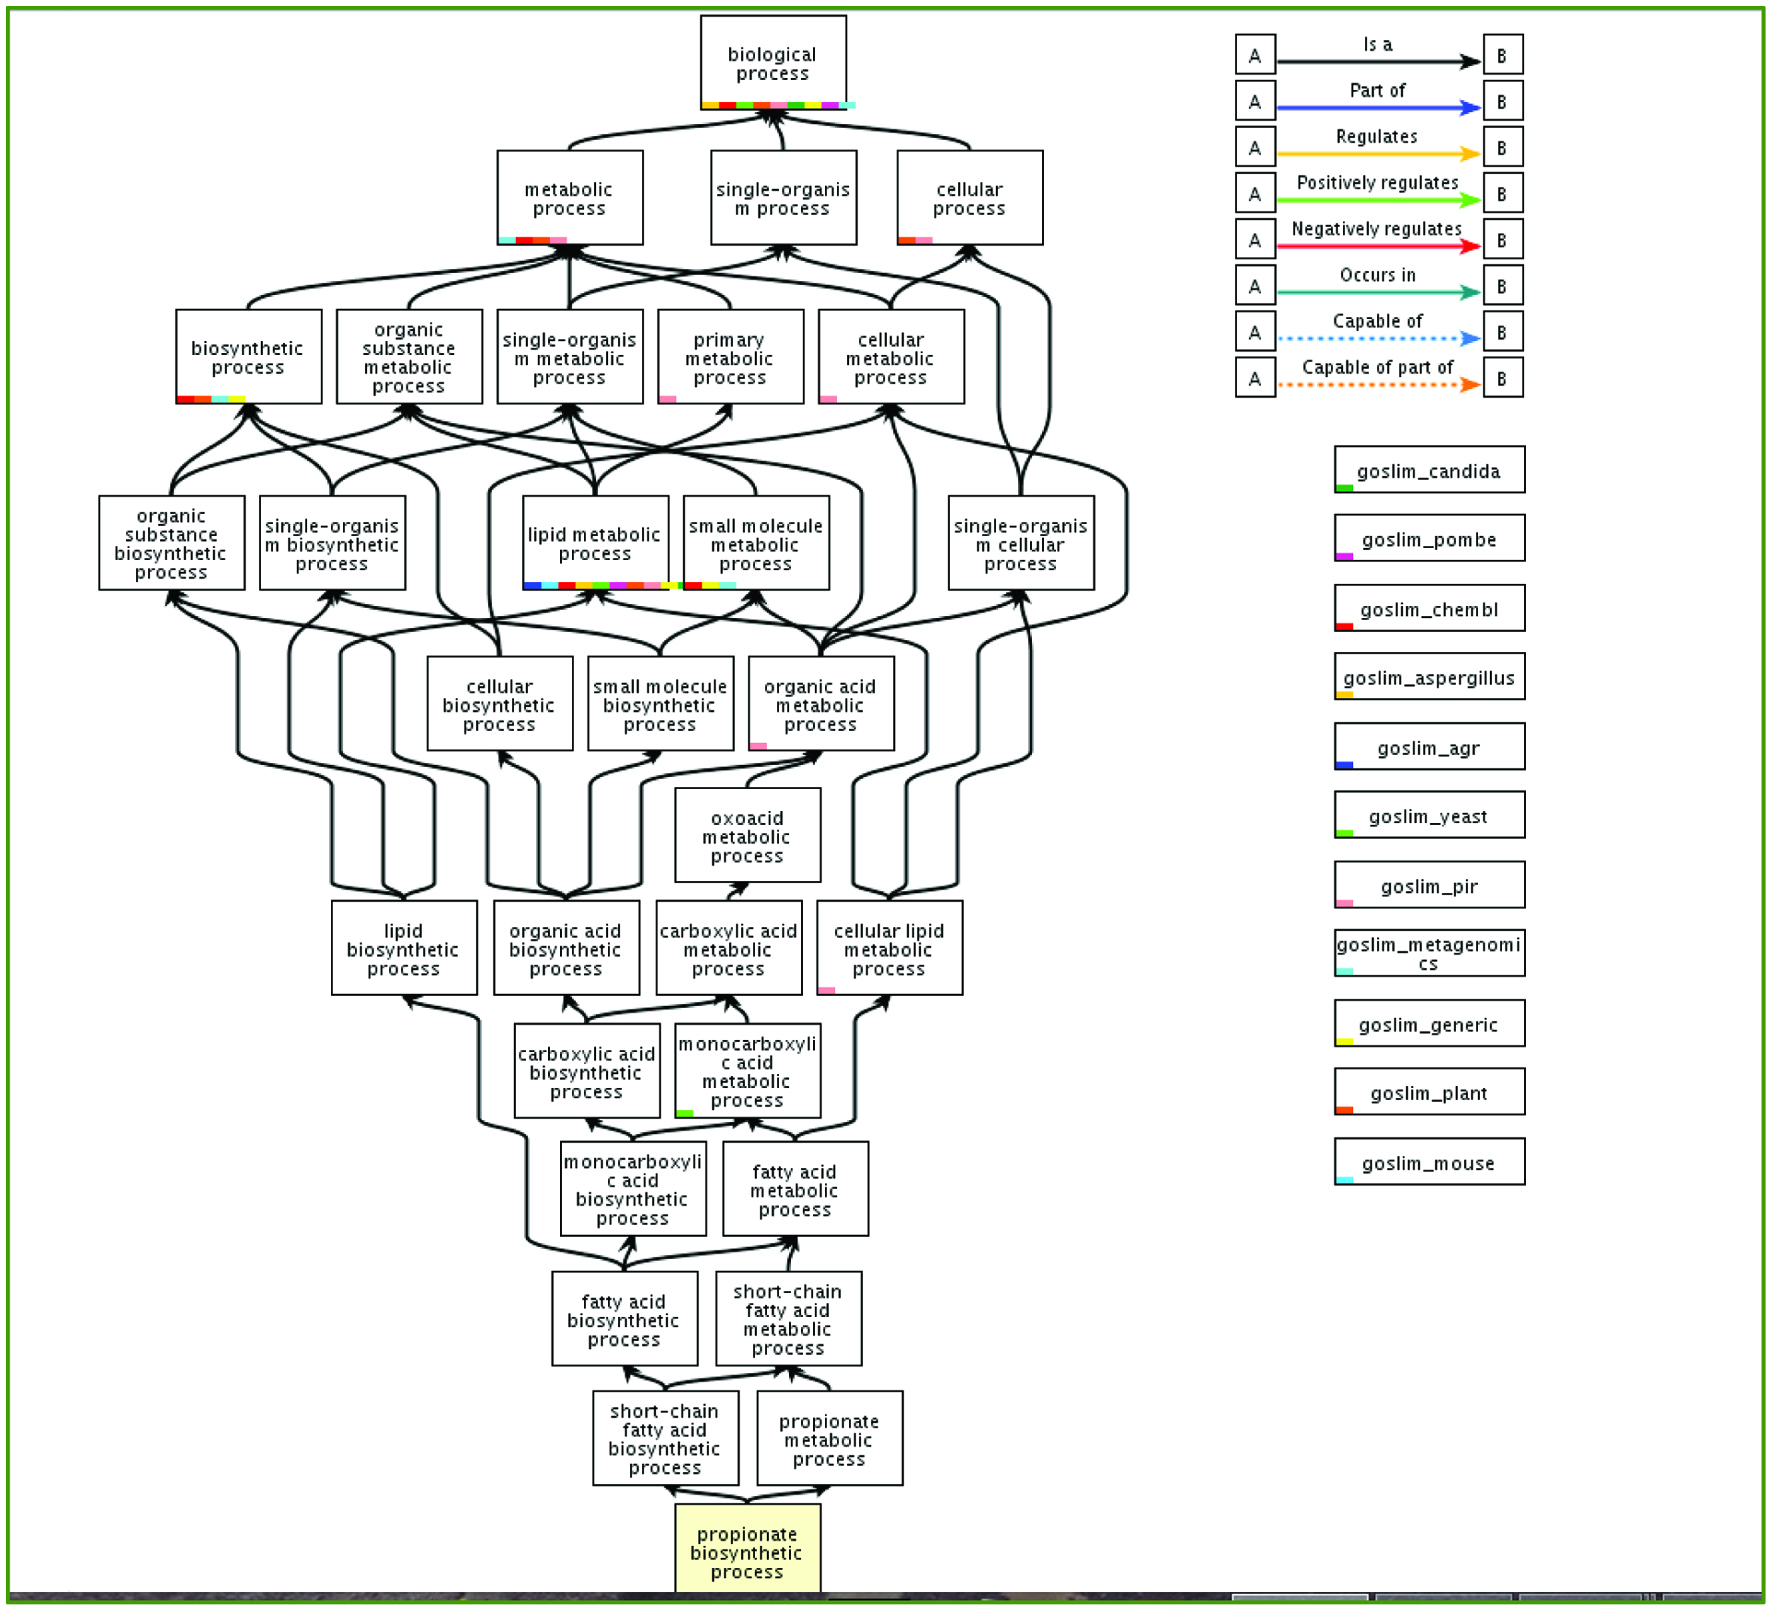
Metabolic and biosynthetic pathway of propionate and its interaction with various components in gut microbiota in humans. (With permission; http://www.geneontology.org/).

Figure 6.
Figure 6.

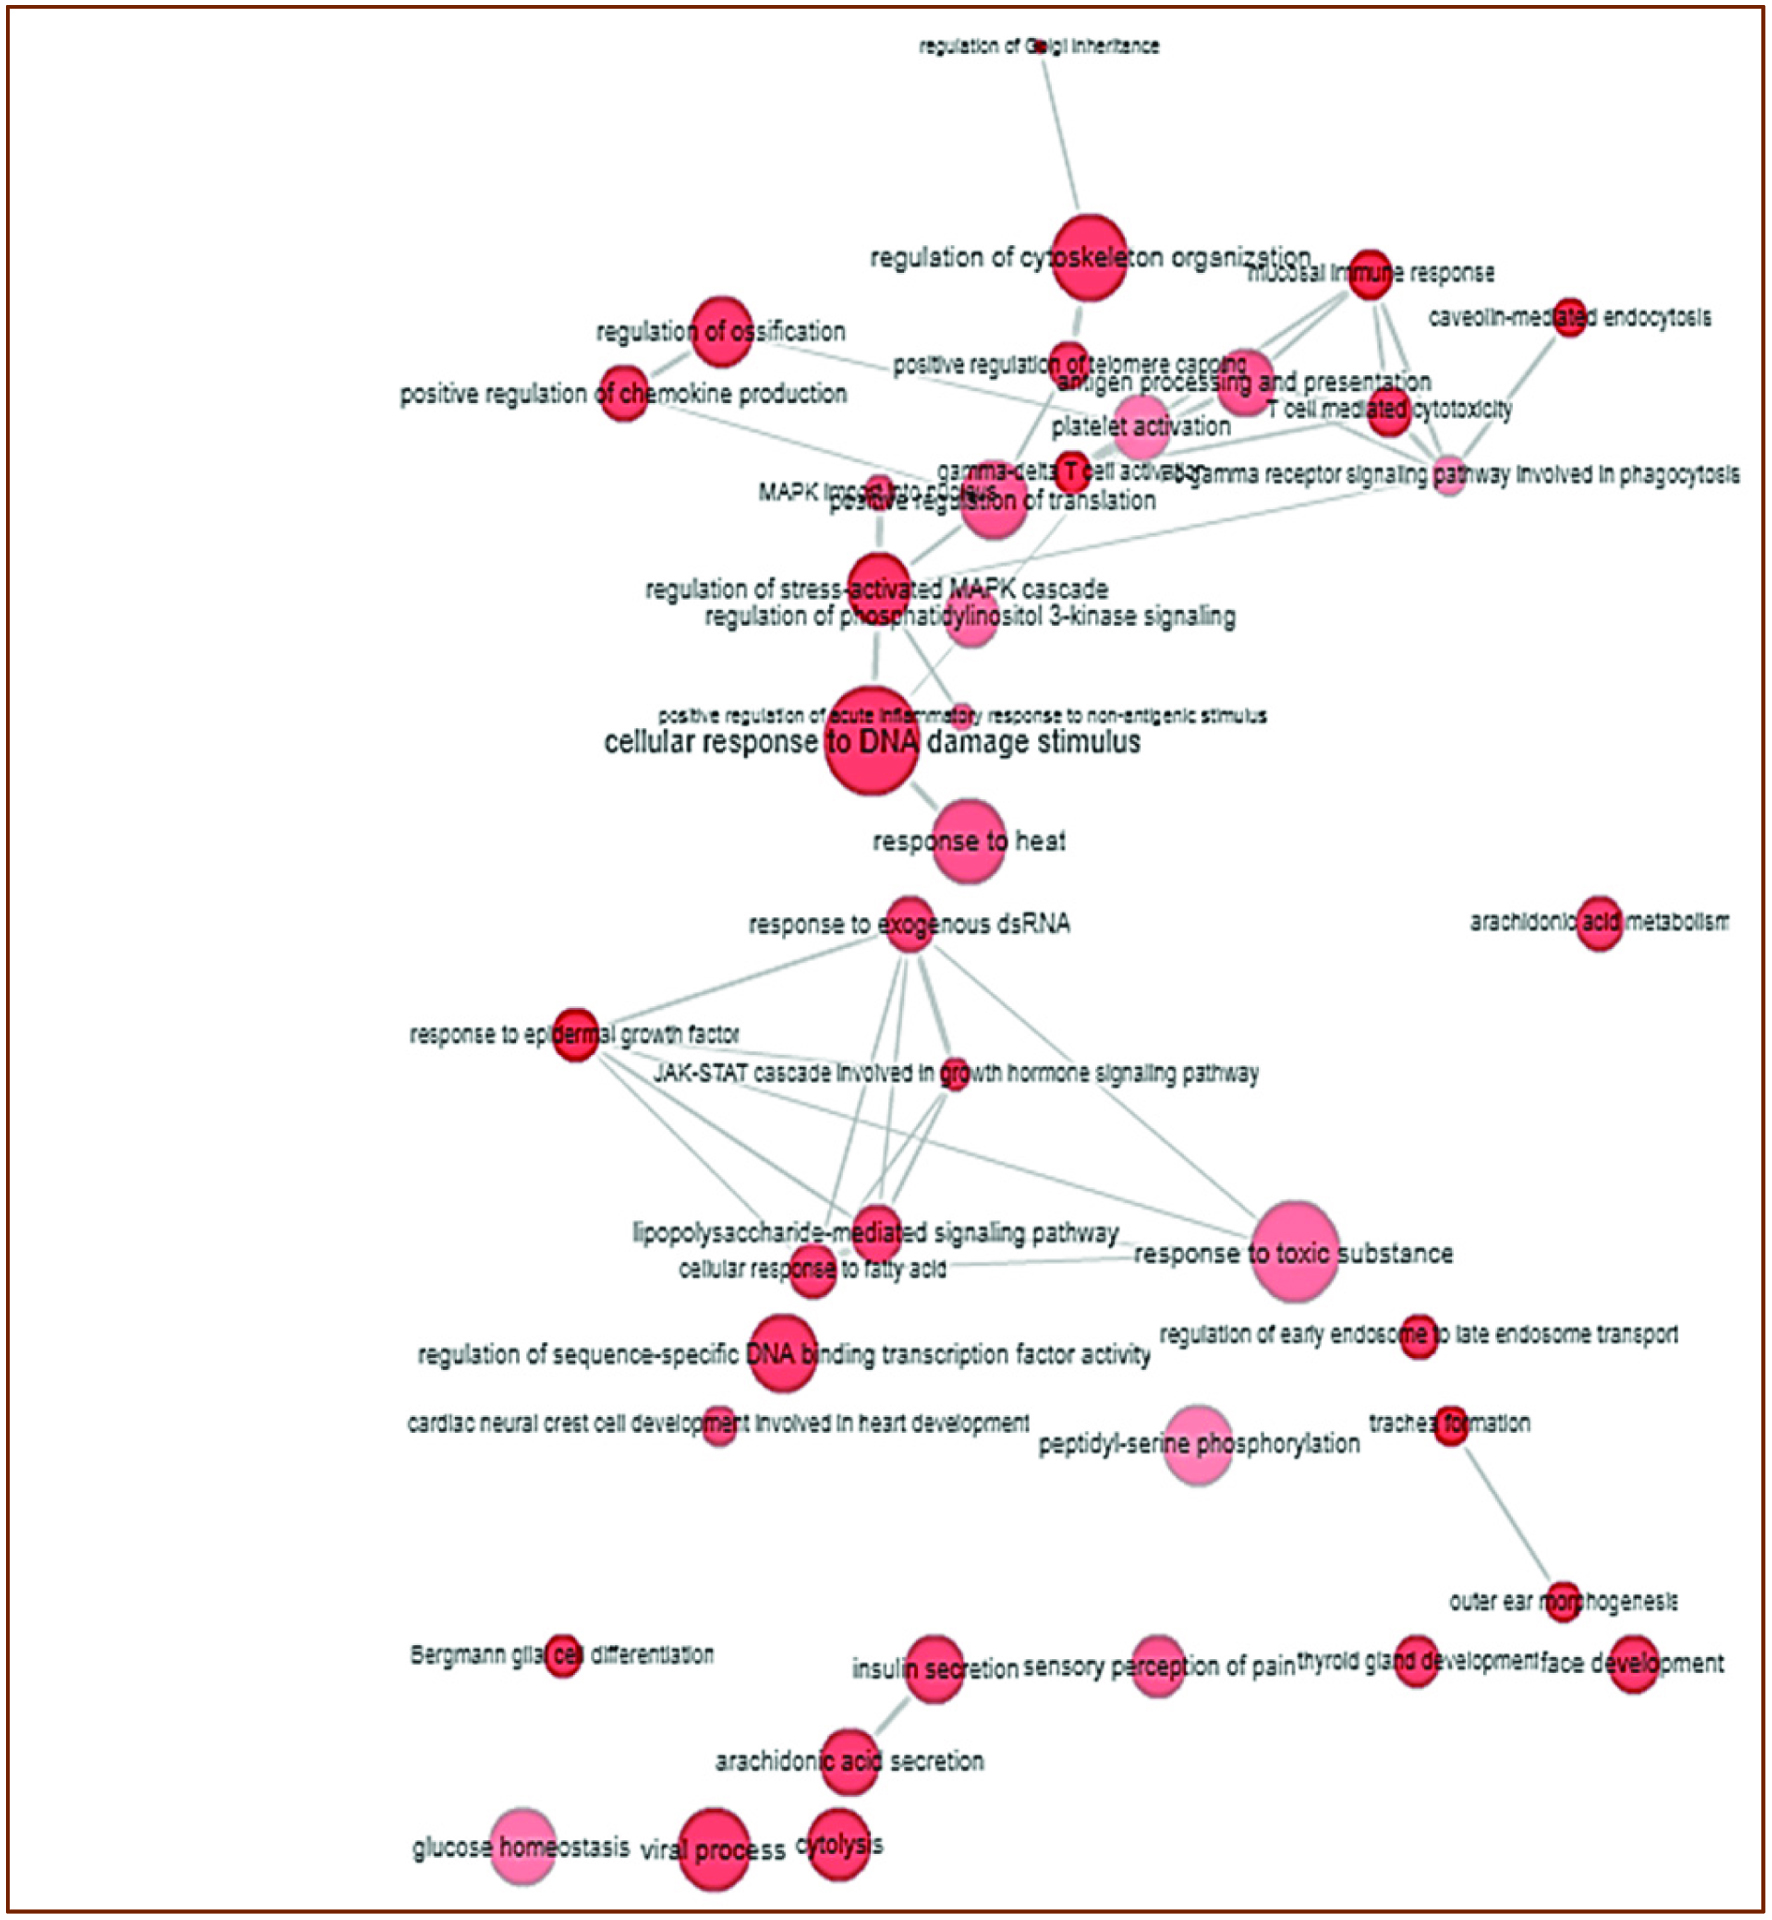
Interactive graph showing the relationship between biological process (Go term) and group of genes regulating the propionate levels in gut microbiota of diabetes (With permission; http://www.geneontology.org/).

Figure 7.
Figure 7.

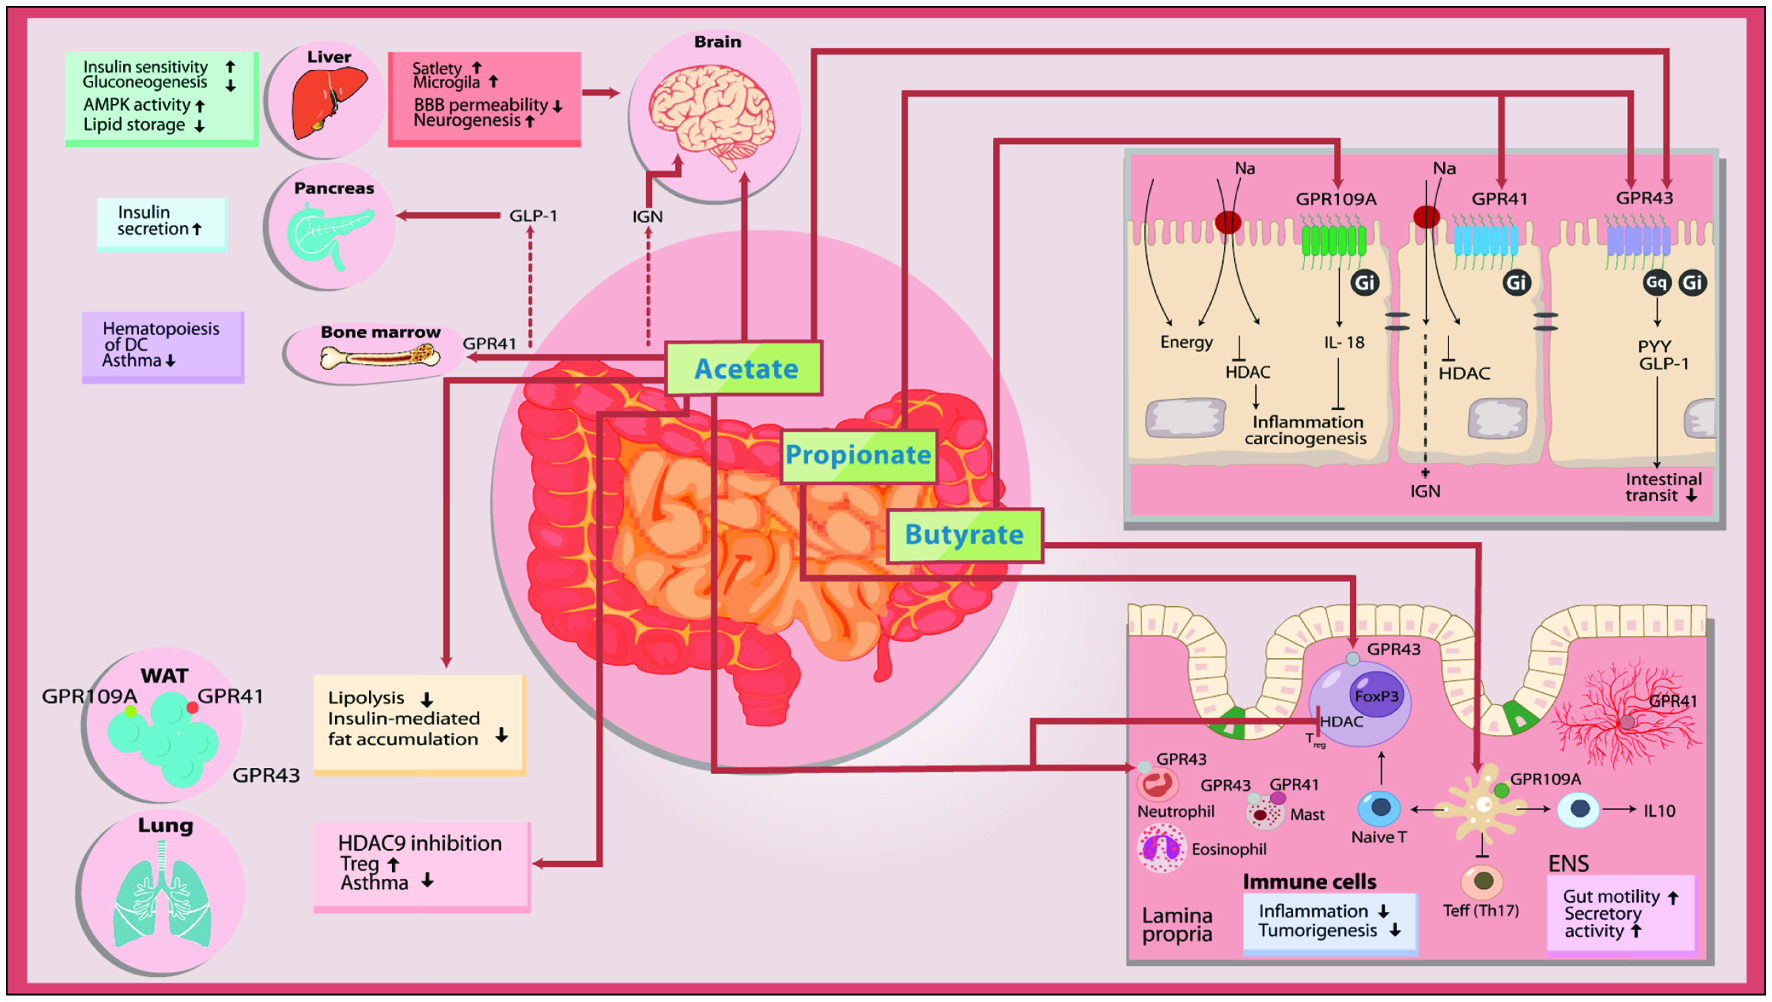
Schematic view of the mechanism of microbial SCFAs.

Size of the letters symbolizes the ratio of SCFAs present. Solid arrows in the figure indicates the direct action of each SCFAs, and dashed arrows from the gut are indirect effects (Adapted from Koh et al., 2016).

Tables

Table 1. Impact of diet on SCFAs produced by the gut microbiota by various epidemiological studies conducted since 2010
 
Subjects, age (n)Parameters determinedMain resultsReferences
d represents the days and y represents the year.
European children, 1–6 y (15)
Burkina Faso (BF) (rural) children (15)
3-d dietary questionnaire (from EU parents) and interview on diet (from BF mothers), fecal samplesBF children: ↑SCFAs;↑Bacteroidetes, ↓Firmicutes, ↓Enterobacteriaceae; unique Prevotella, Xylanibacter (lacking in EU)Sgobio et al., 2010
Healthy African Americans, 50–65 y (12)
Healthy South Africans (12)
Fresh fecal samples, microbiota and SCFAs analysis, cancer biomarkersNative Africans: ↑SCFAs, total bacteria, major butyrate-producing groups, dominance of Prevotella
African-Americans: Bacteroides dominance
Ou et al., 2013
Healthy elderly, 76–95 (32)Food frequency questionnaire, fecal SCFAs analysisCorrelation fiber and SCFAs: Potato intake with total SCFAs and apple with propionateCuervo et al., 2013
Overweight (Krebs et al.) (11)
Lean (11)
3-d diet record, fresh fecal sample, SCFAs absorption measureOWO: ↓Age-adjusted fecal SCFAs concentration, not due to higher absorption rateRahat-Rozenbloom et al., 2014
Overweight (Krebs et al.) (42)
Lean (52)
3-d diet record, physical activity questionnaires, fecal samplesOWO: ↓ SCFAs; dietary intakes and physical activity levels did not differFernandes et al., 2014
Indian individuals, 21–62 y (20): lean (5), normal (5), obese (5), surgically treated obese (5)Fresh fecal samples, microbiota, and SCFAs analysisObese: ↓ SCFAs,↑Bacteroides
Treated-obese: ↑SCFAs ↓Bacteroides
Patil et al., 2012b
Advanced colorectal adenoma patients (A-CRA) (344)
Healthy control (344)
Dietary fiber intake, fecal SCFAs, and microbiota analysisA-CRA group: ↓SCFAs production, ↓butyrate and butyrate-producing bacteriaChen et al., 2015
Celiac disease (CD) patients: normal diet, 13–60 y (10) and gluten-free, 21–66 y (11)
Healthy, 24–42 y (11)
Fresh fecal samples, microbiota, and SCFAs analysisTreated CD: ↑ SCFAs than untreated patients: ↓Lactobacillus and Bifidobacterium diversityCaminero et al., 2012


Table 2. Impact of diet on SCFAs produced by the gut microbiota in intervention studies conducted since 2010
 
Subjects, age (n)Intervention diet (period)Main outcomesReferences
d, w, m and y represent day, week month, and year, respectively.
Healthy African Americans, 50–65 y (20)
Healthy South Africans, 50–65 y (20)
Own diet (2 w) followed by exchange to high-fiber, low-fat African-style (2 w)
Own diet (2 w) followed by high-fat, low-fiber Western-style (2 w)
African style diet: ↑ butyrate; reciprocal changes in colon cancer risk biomarkersO’Keefe et al., 2015
Healthy volunteers (23)Cross-over: high red meat (HRM) diet vs. HRM plus butylated high-amylose maize starch (HAMSB) (4/4 w wash-out)HRM+HAMSB diet:↑ excretion of SCFAs and microbiota composition changesLe Leu et al., 2015
Healthy active volunteers (51)Parallel-groups: butylated high amylose maize starch (HAMSB) vs. low-AMS (28 d)HAMSB diet:↑free, bound and total butyrate and propionateWest et al., 2013
Healthy volunteers, 20–50 y (17)Cross-over: whole-grain (Newgard et al.) vs. refined grain (2/5 w wash out)WG diet: ↑acetate and butyrateRoss et al., 2013
Healthy volunteers, 18–85 y (63)Cross-over: wheat bran extract (WBE) (3 or 10 g WBE) vs. placebo (0 g WBE; 3 w, 2 w wash-out)Daily 10 g intake WBE:↑bifidobacteria;↑ fecal SCFAs and ↓ fecal pHFrancois et al., 2012
Healthy volunteers, 18–24 y (60)Parallel-groups: xylo-oligosaccharide (XOS) vs. inulin-XOS mixture (INU-XOS) vs. placebo (maltodextrin; 4 w)XOS: ↑bifidobacteria and butyrate, and ↓acetate INU-XOS: ↑SCFAs, especially propionate, maintain acetate levelLecerf et al., 2012
Ulcerative colitis (UC) remission patients (19)
Healthy volunteers (10)
Cross-over: Australian diet vs. plus wheat bran-associated fiber and high amylose-associated resistant starch (8 w)Intervention diet: did not correct the low gut fermentation in patients with UCJames et al., 2015
Irritable bowel syndrome
with constipation woman, 20–69 y (32)
Parallel-groups: Milk acidified product vs. Fermented Milk product (FMP) (4 w)FMP:↑potential butyrate producers, and ↑Total SCFAs in vitro↑butyrateSalazar et al., 2015
IBS patients (27)
Healthy volunteers (6)
Cross-over: Australian diet vs. low FODMAP (Fermentable Oligo-, Di-, Mono-saccharides And Polyols) diet (21/21 d wash-out)Australian diet:↑ relative abundance ClostridiumclusterXIVa (butyrate-producer)
Low FODMAP diet:↓total bacterial abundance
Halmos et al., 2015
Cow’s milk protein allergy infants (16)Cross-over:hydrolysed whey protein formula (eHF) without lactose vs. eHF containing 3.8% lactose (2 m)Addition of lactose: ↑SCFAs; ↑LAB and bifidobacteria; ↓Bacteroides/clostridiaDi Cagno et al., 2011
Obese women 18–65 y (30)Parallel-groups: ITF vs. placebo (maltodextrin) (3m)ITF:↓ total SCFAs, acetate and propionate; ↑bifidobacteriaSalazar et al., 2015