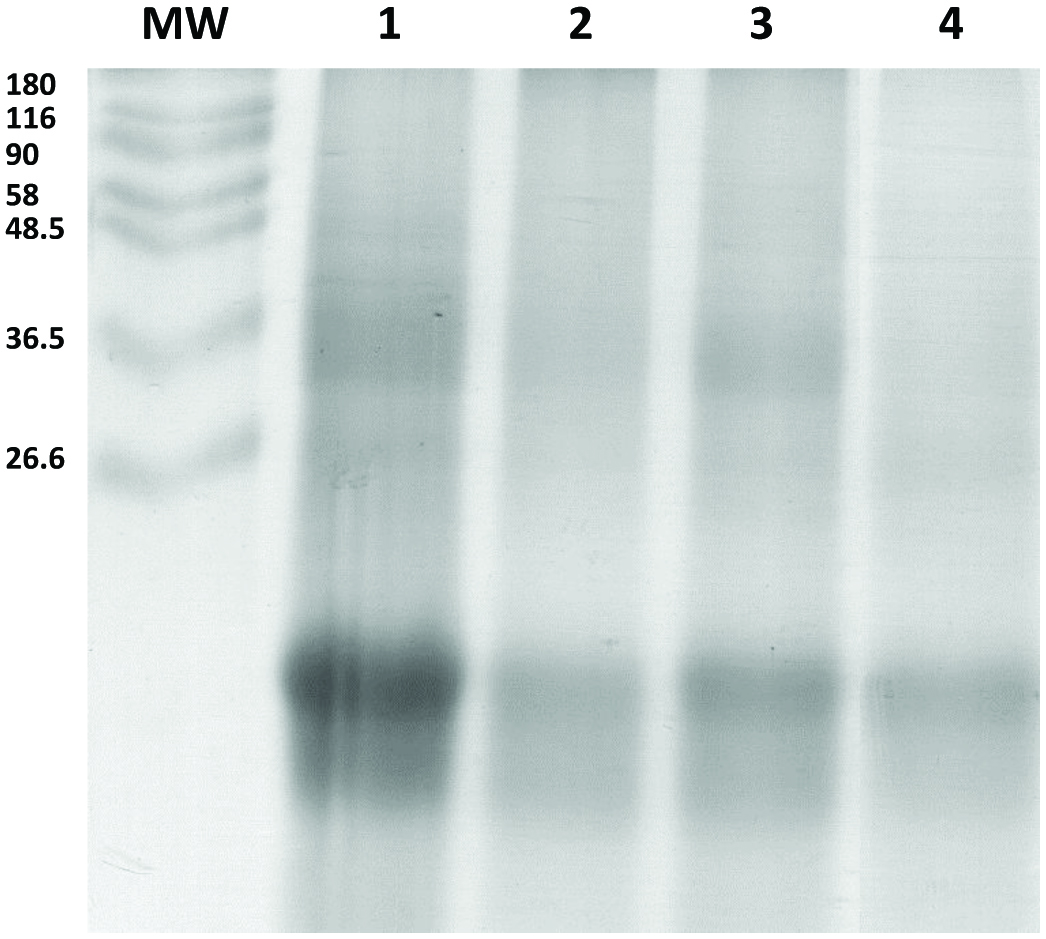
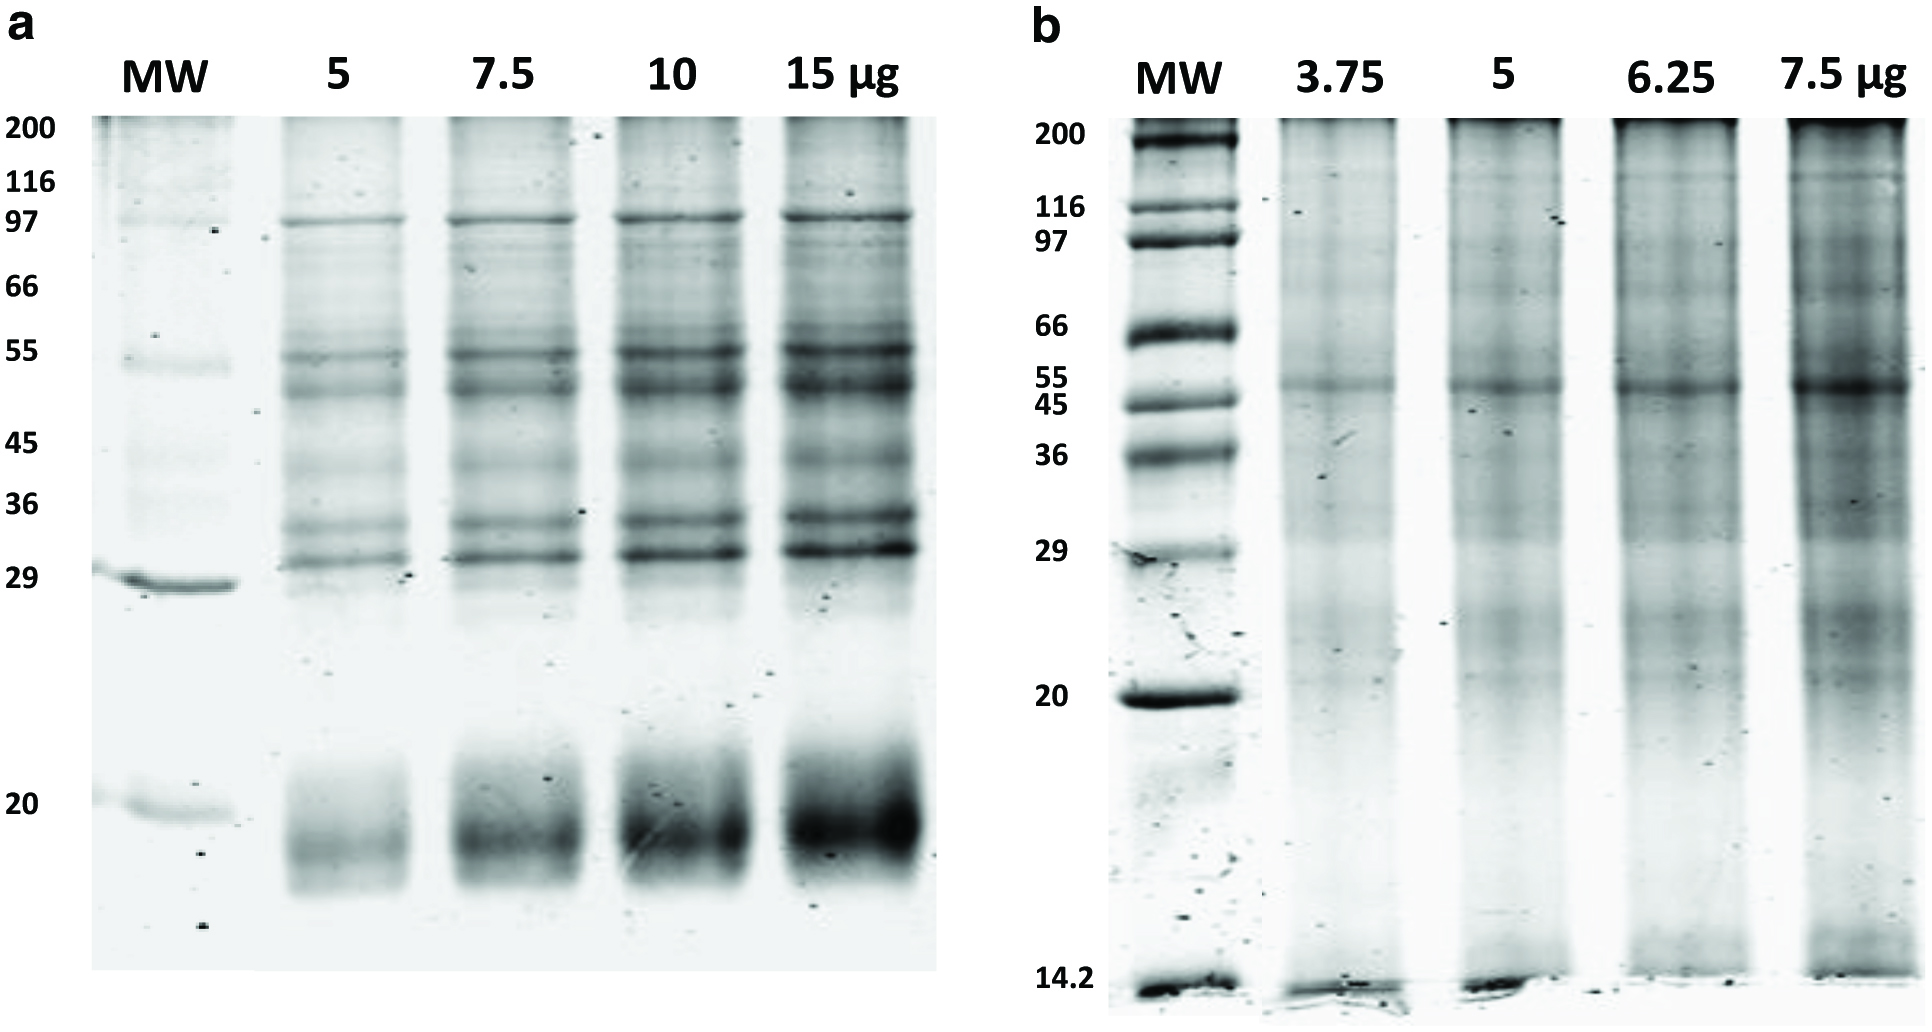
Journal of Food Bioactives, ISSN 2637-8752 print, 2637-8779 online
Journal website www.isnff-jfb.com

Original Research

Volume 1, March 2018, pages 153-165


Protein extraction and bioactive hydrolysate generation from two microalgae, Porphyridium purpureum and Phaeodactylum tricornutum

Figures

Figure 1.
Figure 1.

Sodium dodecyl sulphate polyacrylamide gel electrophoresis (SDS-PAGE) profiles of proteins extracted from milled freeze-dried microalgae.

(a) 5.0, 7.5, 10.0 and 15.0 μgof Porphyridium purpureum proteins were loaded in lanes 2 to 5. (b) 2.5, 5.0, 7.5, and 10.0 μg Phaeodactylum tricornutum proteins were loaded in lanes 2 to 5. The molecular weight markerswere loaded in lane 1.
Figure 2.
Figure 2.

Effects of various factors on the recovery of alkaline soluble protein from milled freeze-dried Porphyridium purpureum and Phaeodactylum tricornutum.

(a) pH; (b) extraction temperature; (c) extraction duration and (d) effect of prior aqueous extraction. All results are reported as mg of total protein extracted per g dry weight microalgal biomass. Mean ± SD (n = 3).For each experiment, samples with different letters are significantly different at p < 0.05.
Figure 3.
Figure 3.

SDS-PAGE profiles of Porphyridium purpureum and Phaeodactylum tricornutum protein extracts.

Lane MW: Molecular weight marker, lane 1: aqueous protein fraction from P. purpureum, lane 2: alkaline soluble protein fraction from P. purpureum, lane 3: combined aqueous and alkaline soluble protein fractions from P. purpureum, lane 4: combined aqueous and alkaline soluble protein fractions from P. tricornutum. 15 μg of all samples was loaded onto the gel.
Figure 4.
Figure 4.

Monitoring the hydrolysis of Porphyridium purpureum and Phaeodactylum tricornutum protein extracts.

(a) Concentration of amino groups liberated during the hydrolysis of P. purpureum and P. tricornutum protein extracts. (b) SDS-PAGE profile of P. purpureumprotein extracts and hydrolysates. (c) SDS-PAGE profile of P. tricornutum protein extracts and hydrolysates. 15 μg of all samples was loaded onto both gels. Lane MW: Molecular weight marker;Lane 1: 0 h hydrolysate sample; Lane 2: 1 h hydrolysate sample; Lane 3: 2 h hydrolysate sample; Lane 4: 3 h hydrolysate sample; Lane 5: 4 h hydrolysate sample; Lane 6: 0 h no-enzyme control; Lane 7: 4 h no-enzyme control.
Figure 5.
Figure 5.

Gel permeation high performance liquid chromatography (GP-HPLC) profiles showing the molecular mass distribution of the soluble proteinaceous components in Porphyridium purpureum and Phaeodactylum tricornutumprotein hydrolysates after 4 h hydrolysis.

Vertical lines show the retention times corresponding to 0.5, 2 and 10 kDa.

Tables

Table 1. Total nitrogen (TN), non-protein nitrogen (NPN) and protein nitrogen (PN) contents of Porphyridium purpureum and Phaeodactylum tricornutum
 
TNNPNPN
(mg Nitrogen per gram of dry weight)
Mean ± SD (n = 3).
P. purpureum2.03 ± 0.020.47 ± 0.081.5 ± 0.04
P. tricornutum2.86 ± 0.011.02 ± 0.021.93 ± 0.02


Table 2. Endoproteinase activity in Porphyridium purpureum and Phaeodactylum tricornutum protein extracts
 
SamplesEndoproteinase Activity
ΔA (λ440 nm)/min/mg protein × 102
22 °C40 °C
*No Activity Detected. Mean ± sd (n = 3).
ControlCorolase PP17.42 ± 1.1523.46 ± 1.13
P. purpureumAqueous extract**
Alkali extract0.17 ± 0.030.02 ± 0.01
P. tricornutumAlkali extract0.18 ± 0.021.58 ± 0.08


Table 3. Dipeptidyl peptidase (DPP) IV inhibitory activity, ferric reducing antioxidant power (FRAP) and oxygen radical antioxidant capacity (ORAC) of Porphyridium purpureum and Phaeodactylum tricornutum protein hydrolysates
 
P. purpureumP. tricornutum
ControlHydrolysateControlHydrolysate
Mean ± SD (n = 3). For each assay and microalgae, samples with different letters are significantly different at p < 0.05. IC50: inhibitory concentration that inhibits enzyme activity by 50%. μmol TE/g FDP: μmol Trolox Equivalent per gram Freeze Dried Powder.
DPP-IV IC50 (mg/ml)5.07 ± 0.21a2.28 ± 0.21b3.34 ± 0.26a2.67 ± 0.19b
FRAP (μmol TE/g FDP)3.16 ± 0.35a13.97 ± 0.97b1.69 ± 0.43a15.04 ± 0.54b
ORAC (μmol TE/g FDP)143.58 ± 11.33a478.94 ± 34.43b83.76 ± 7.73a155.74 ± 38.30b