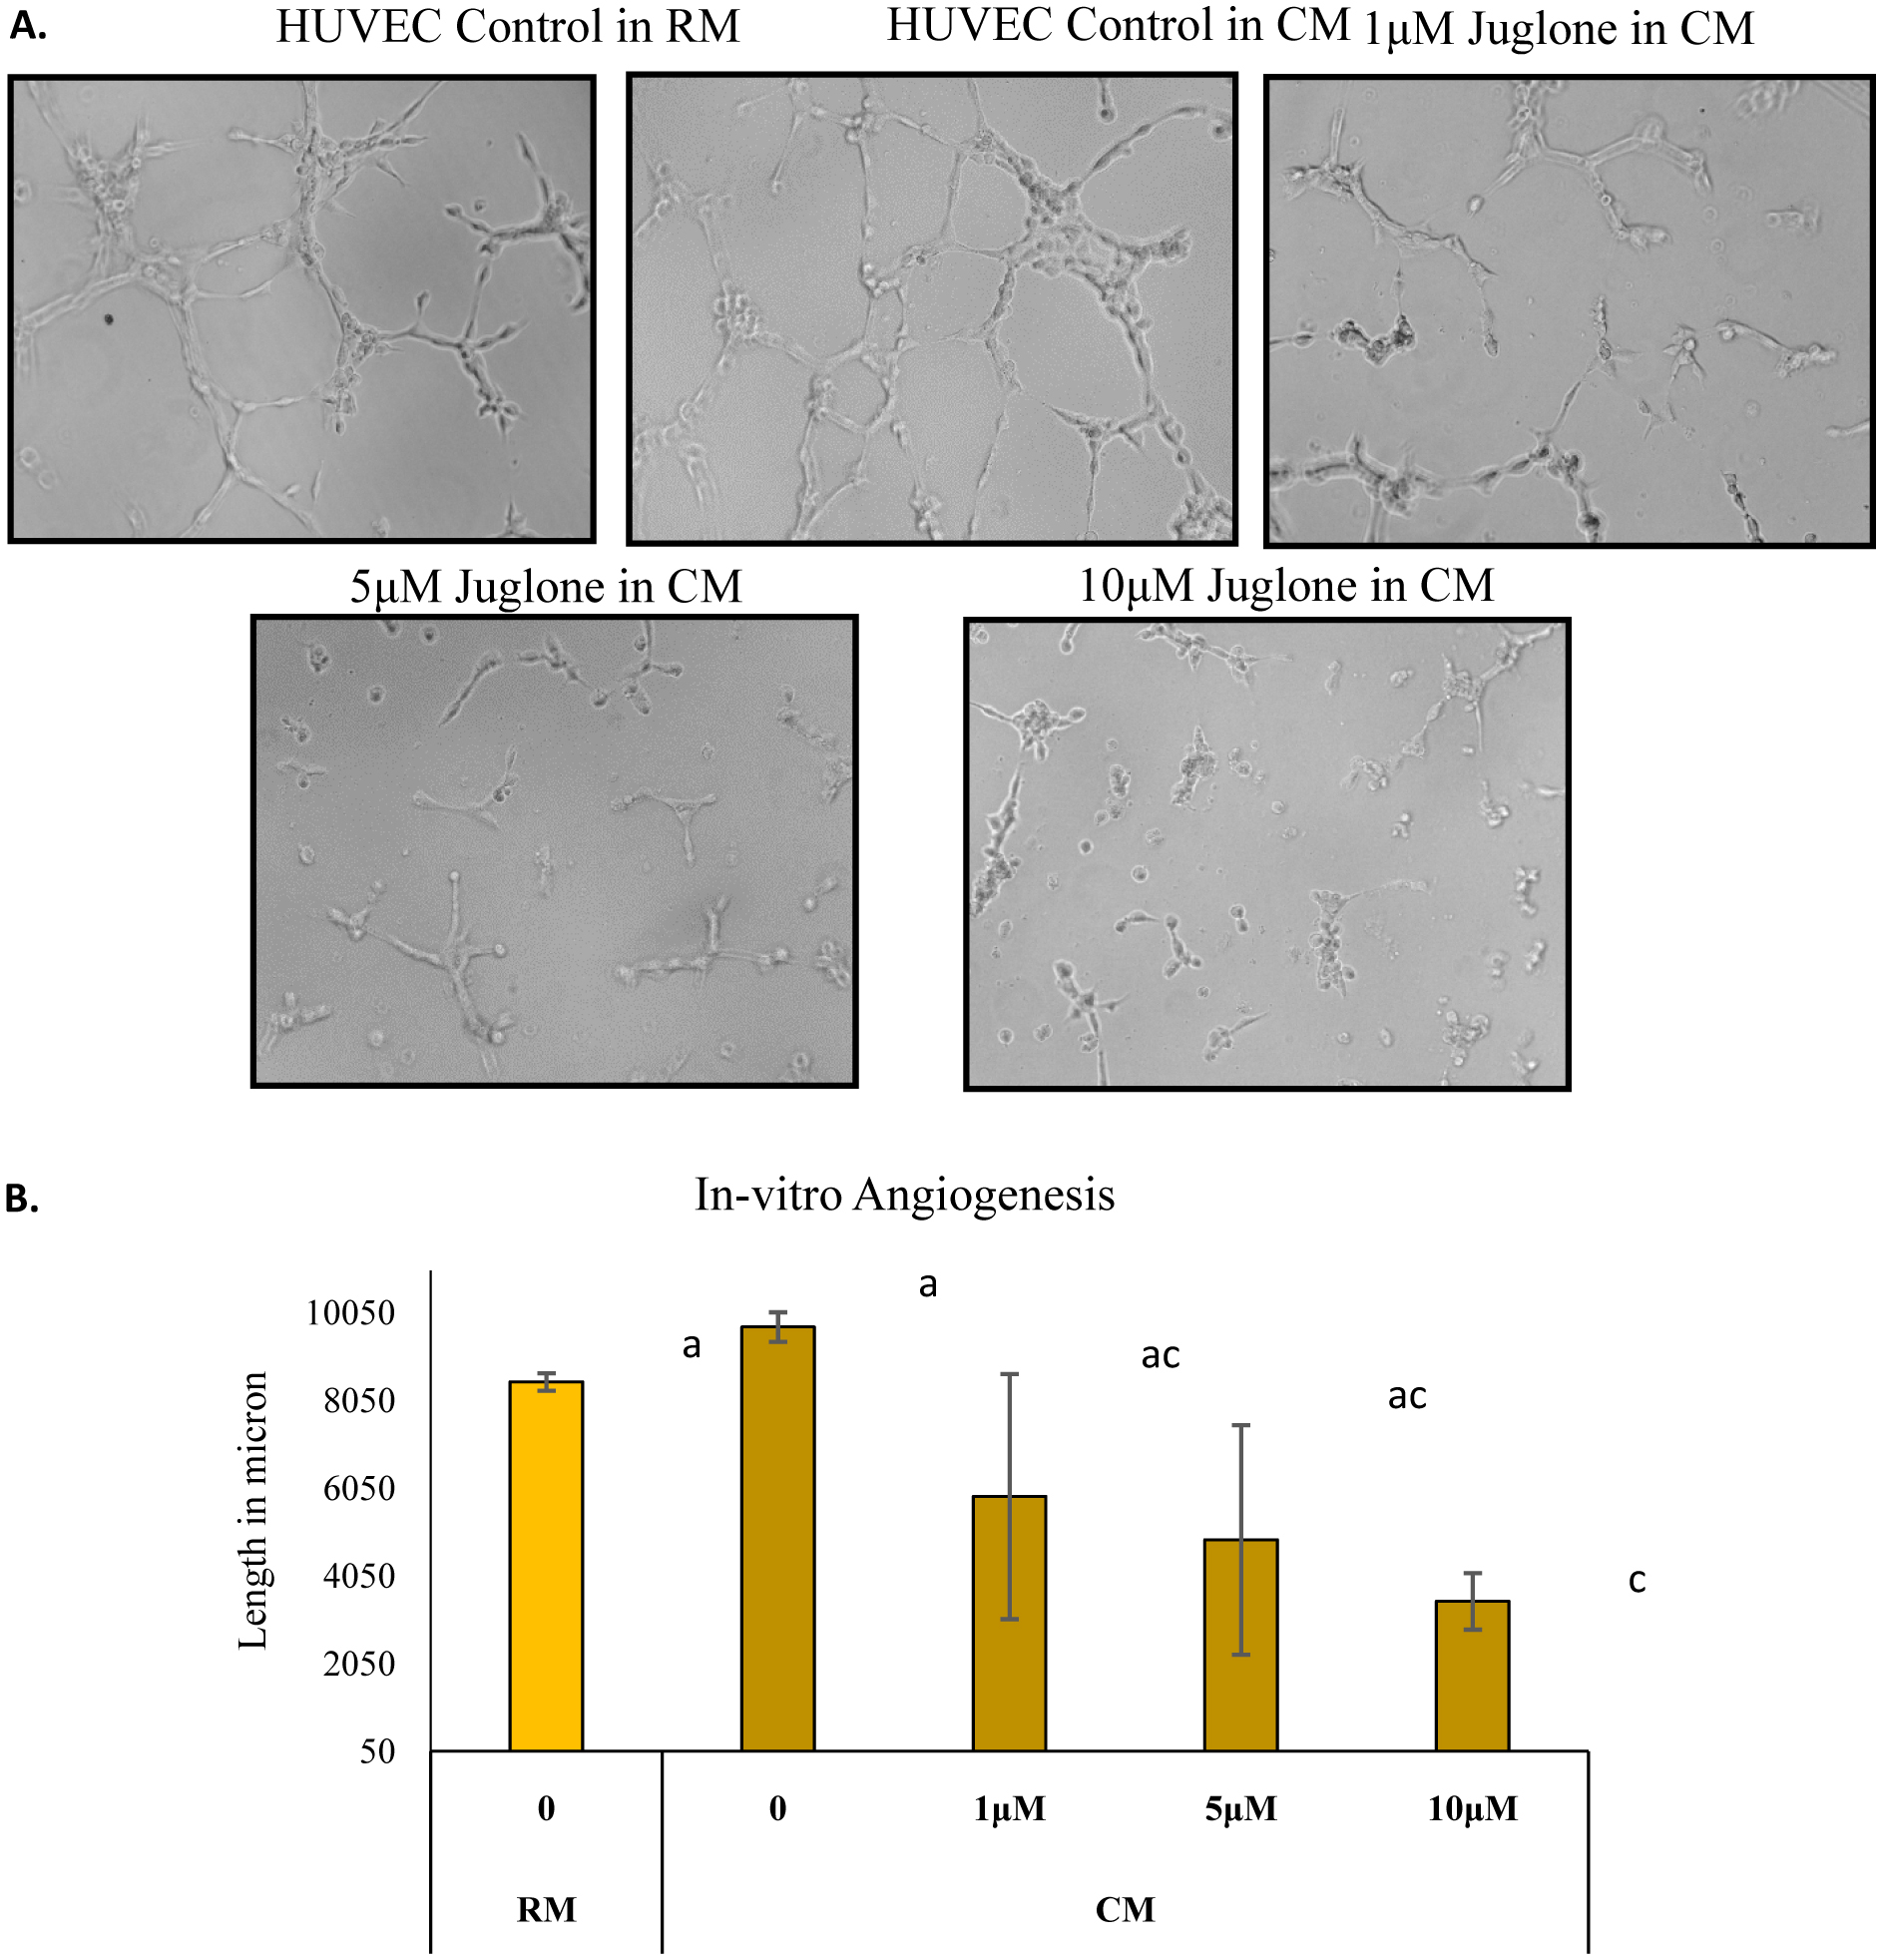
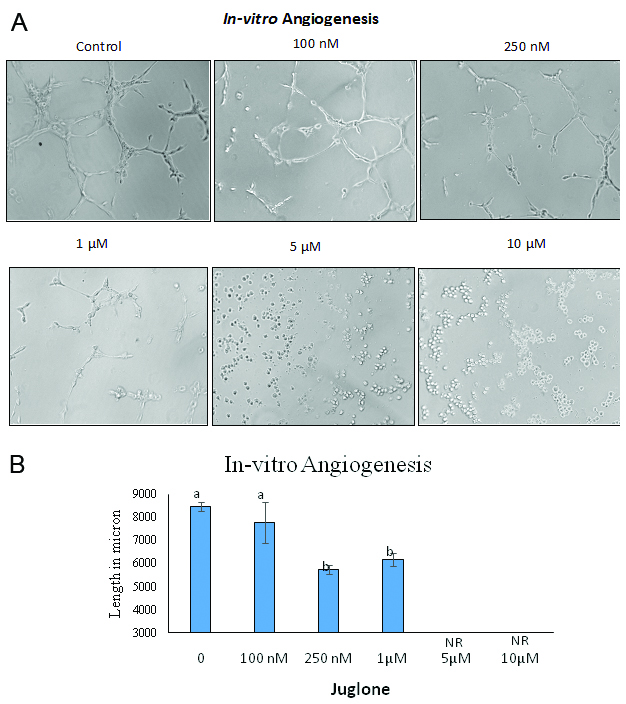
Journal of Food Bioactives, ISSN 2637-8752 print, 2637-8779 online
Journal website www.isnff-jfb.com

Original Research

Volume 1, March 2018, pages 143-152


Juglone down-regulates the Akt-HIF-1α and VEGF signaling pathways and inhibits angiogenesis in MIA Paca-2 pancreatic cancer in vitro

Figures

Figure 1.
Figure 1.

Effect of juglone on HUVEC tube formation assay

HUVEC were plated on top of polymerized matrigel, incubated with various concentrations of juglone and tube formation was observed after 6 h of incubation (A). The length of capillaries formed was measured using ImagePro software and represented (B). At concentrations 5 and 10 µM the lengths were unreadable (NR).
Figure 2.
Figure 2.

Effect of juglone on HUVEC tube formation using conditioned media (CM) from MIA Paca-2 cells

Results were compared to HUVEC grown in regular media (RM). HUVEC were plated on top of polymerized matrigel, incubated with various concentrations of juglone containing conditioned media (CM) from MIA Paca-2 cells and tube formation was observed after 6 h of incubation (A). The length of capillaries formed was measured using ImagePro software and represented (B).
Figure 3.
Figure 3.

Effect of juglone on wound closure.

A. Confluent layer of MIA Paca-2 cells were scratched with micropipette tips (upper panel A) and cells with wounds were incubated with varying concentrations (1–10 μM) of juglone for 24 h. Photographs of the wound were taken at 0 h (upper panel A) and at 24 h (lower panel B) of incubation. Quantitative representation of wound closure was measured using Image Pro software and ratio of width of the wound before and after treatment is presented (B).
Figure 4.
Figure 4.

Effect of juglone on the migration of MIA Paca-2 cells.

Cells were treated with various concentrations of juglone for 6 h. After treatment, cells were harvested and live cells were plated (5 × 10⁴) on the upper chamber of transwell inserts and allowed to migrate for 48 h. Invaded cells on the undersurface of the inserts were stained with crystal violet and photographs were captured with a phase contrast microscope (A). Retained crystal violet by migrated cells were dissolved in acetic acid and optical density was measured at 595 nm and expressed as percentage of control (B).
Figure 5.
Figure 5.

Effect of juglone on the invasion ability of MIA Paca-2 cells.

Cells were treated with various concentrations of juglone for 6 h and after treatment, cells were harvested and plated (1 × 10⁵) on the upper chamber of transwell inserts with matrigel layer and allowed to invade for 48 h. Invaded cells on the undersurface of the inserts were stained with crystal violet and photographs were captured with a phase contrast microscope.
Figure 6.
Figure 6.

Expression of HIF-1α in MIA Paca-2 cells treated with juglone as measured by a cell based ELISA assay.

Figure 7.
Figure 7.

Western Blot analysis of VEGF expression in MIA Paca-2 cells.

Cells were treated with various concentrations of juglone (1–10 μM) for 6 h and cell lysates were collected. Western blot was performed with 30 μg of protein/lane (A). Expression of VEGF was quantified using Quantity One software and reported as percentage of control (B).
Figure 8.
Figure 8.

Western Blot analysis of Akt and p-Akt expression in MIA Paca-2 cells.

Cells were treated with juglone (1–5 μM) for 6 h and cell lysate were collected. Western blot was performed with 70 μg of protein/lane (A). Quantification of p-Akt/Akt ratio was done using Quantity One software and reported as percentage of control (B).