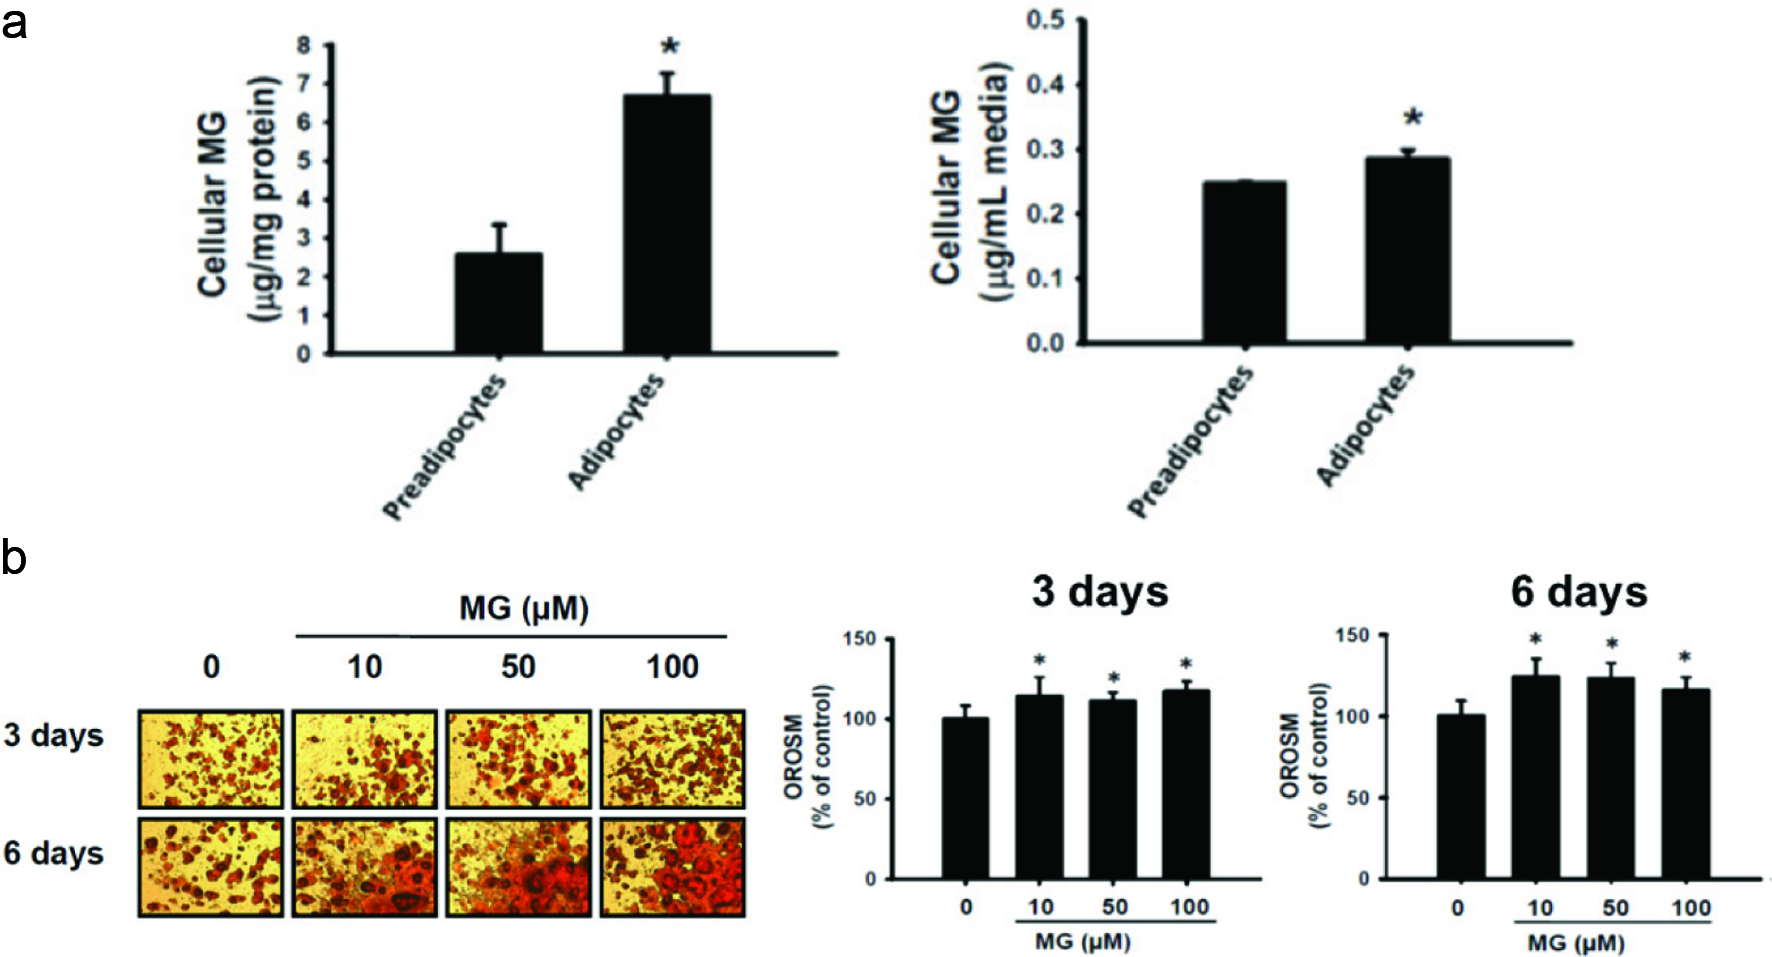
Journal of Food Bioactives, ISSN 2637-8752 print, 2637-8779 online
Journal website www.isnff-jfb.com

Original Research

Volume 4, Number , December 2018, pages 139-149


Effect of Phyllanthus emblica L. fruit on improving regulation of methylglyoxal-induced insulin resistance in 3T3-L1 cells

Figures

Figure 1.
Figure 1.

Oil droplets accumulation by methylglyoxal (MG) treatment. (a) Determination of both intracellular and extracellular MG as 2-methylquinoxaline by high-performance liquid chromatography (HPLC). The data were expressed as the mean ± SD (n = 3). * p < 0.05 compared to preadipocyte. (b) Effects of methylglyoxal (MG) on Oil red O stained material (OROSM) in 3T3-L1 adipocytes. Cells were treated with 10, 50, and 100 μM of MG for 3 days and 6 days.

Figure 2.
Figure 2.

Inflammatory relative cytokine and chemokine production promoted by MG initiated signaling. 3T3-L1 adipocytes were treated with 10, 50, and 100 μM of MG for 48 h, respectively. (a) p-JNK protein, (b) p-p65 protein, (c) IL-6 release, (d) IL-6 protein, and (e) MCP-1 protein expression were measured using western blot and ELISA assay. The data were expressed as the mean ± SD (n = 3). * p < 0.05 compared to untreated control.

Figure 3.
Figure 3.

MG not only reduced glucose uptake also enhanced oil droplets accumulation-associated PPARγ and C/EBPα proteins expression. (a) Cells were treated with MG for 24 h. The glucose uptake assay was performed using flow cytometry. After MG treatment for 48 h, protein expressions of (b) PPARγ and (c) C/EBPα were assessed by western blot. The data were expressed as the mean ± SD (n = 3). * p < 0.05 compared to untreated control.

Figure 4.
Figure 4.

WEPE effectively inhibited glucose uptake and attenuated inflammatory relative signaling initiated by MG treatment. (a) MG treatment combined with or without WEPE and 5 mM AG treatment in 3T3-L1 adipocytes for 24 h. The glucose uptake assay was performed using flow cytometry. (b) IL-6 secretion and (C-F) protein expressions of IL-6, p-p65, MCP-1, and p-JNK in MG-treated 3T3-L1 adipocytes combined with or without WEPE and 5 mM AG treatment for 48 h. The data were expressed as the mean ± SD (n = 3). # p < 0.05 compared to untreated control; * p < 0.05 compared to MG-induced adipocytes.

Figure 5.
Figure 5.

WEPE decreased fat synthesis related proteins expression induced by MG treatment. MG-treated 3T3-L1 adipocytes combined with or without WEPE and 5 mM AG treatment for 48 h. Protein expressions of (a) PTP1B, (b) PPARγ and C/EBPα, and (c) p-ACC and FAS were measured by western blot, respectively. The data were expressed as the mean ± SD (n = 3). # p < 0.05 compared to untreated control; * p < 0.05 compared to MG-induced adipocytes.

Figure 6.
Figure 6.

Ellagic acid dramatically inhibited IL-6 secretion and raised glucose uptake in MG-induced insulin resistance. (a) MG-treated 3T3-L1 adipocytes combined with or without 20 μM ellagic acid and 20 μM gallic acid treatment for 48 h. IL-6 production was accessed using ELIAS assay. (b) MG-treated 3T3-L1 adipocytes combined with or without ellagic acid (5, 10, and 20 μM) treatment for 48 h. IL-6 production was measured by ELIAS assay. (c) Cell treatment condition of glucose uptake was the same as in (b) but treatment for 24 h. Glucose uptake was measured by flow cytometry. The data were expressed as the mean ± SD (n = 3). # p < 0.05 compared to untreated control; * p < 0.05 compared to MG-induced adipocytes.