Figures
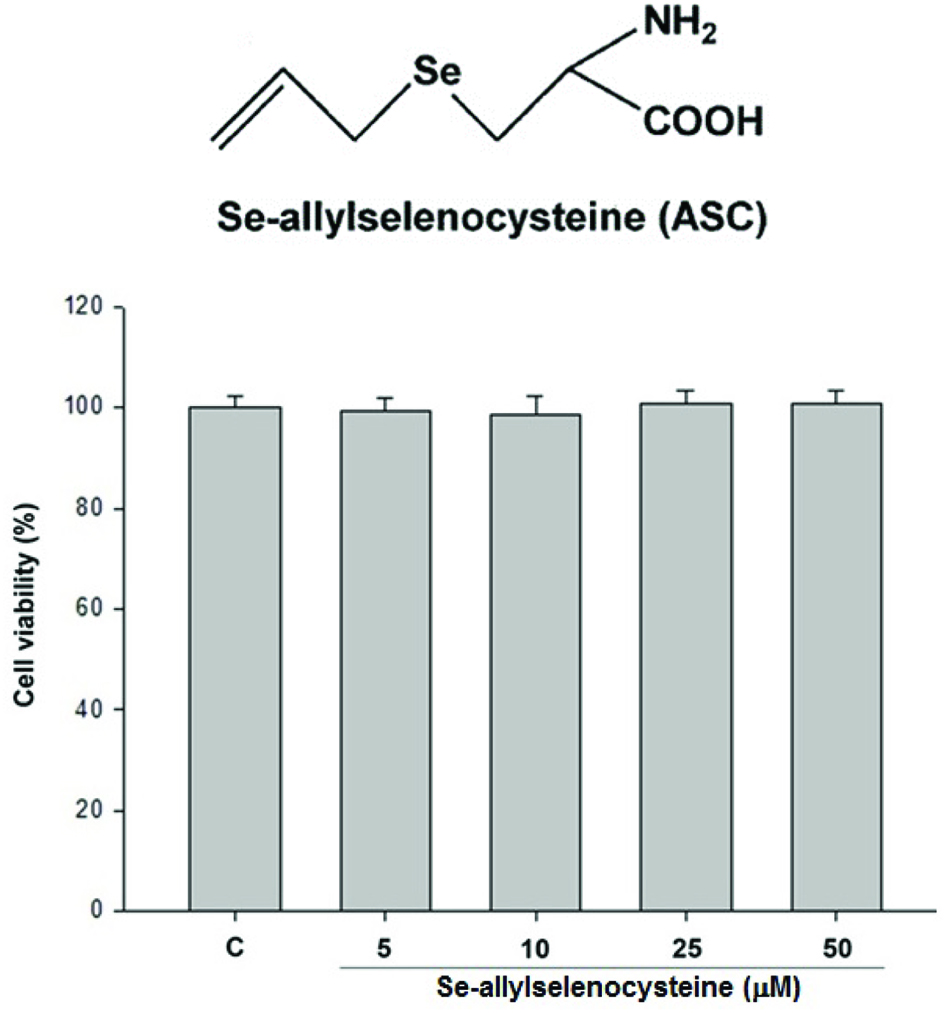
Figure 1. Effects of ASC on cell viability. RAW 264.7 cells were treated with 5, 10, 25, 50 μM of ASC for 24 hr. The viability of cells was determined by trypan blue assay. The values are expressed as means S.E. of triplicate tests. *P < 0.05, **P < 0.01, ***P < 0.001.
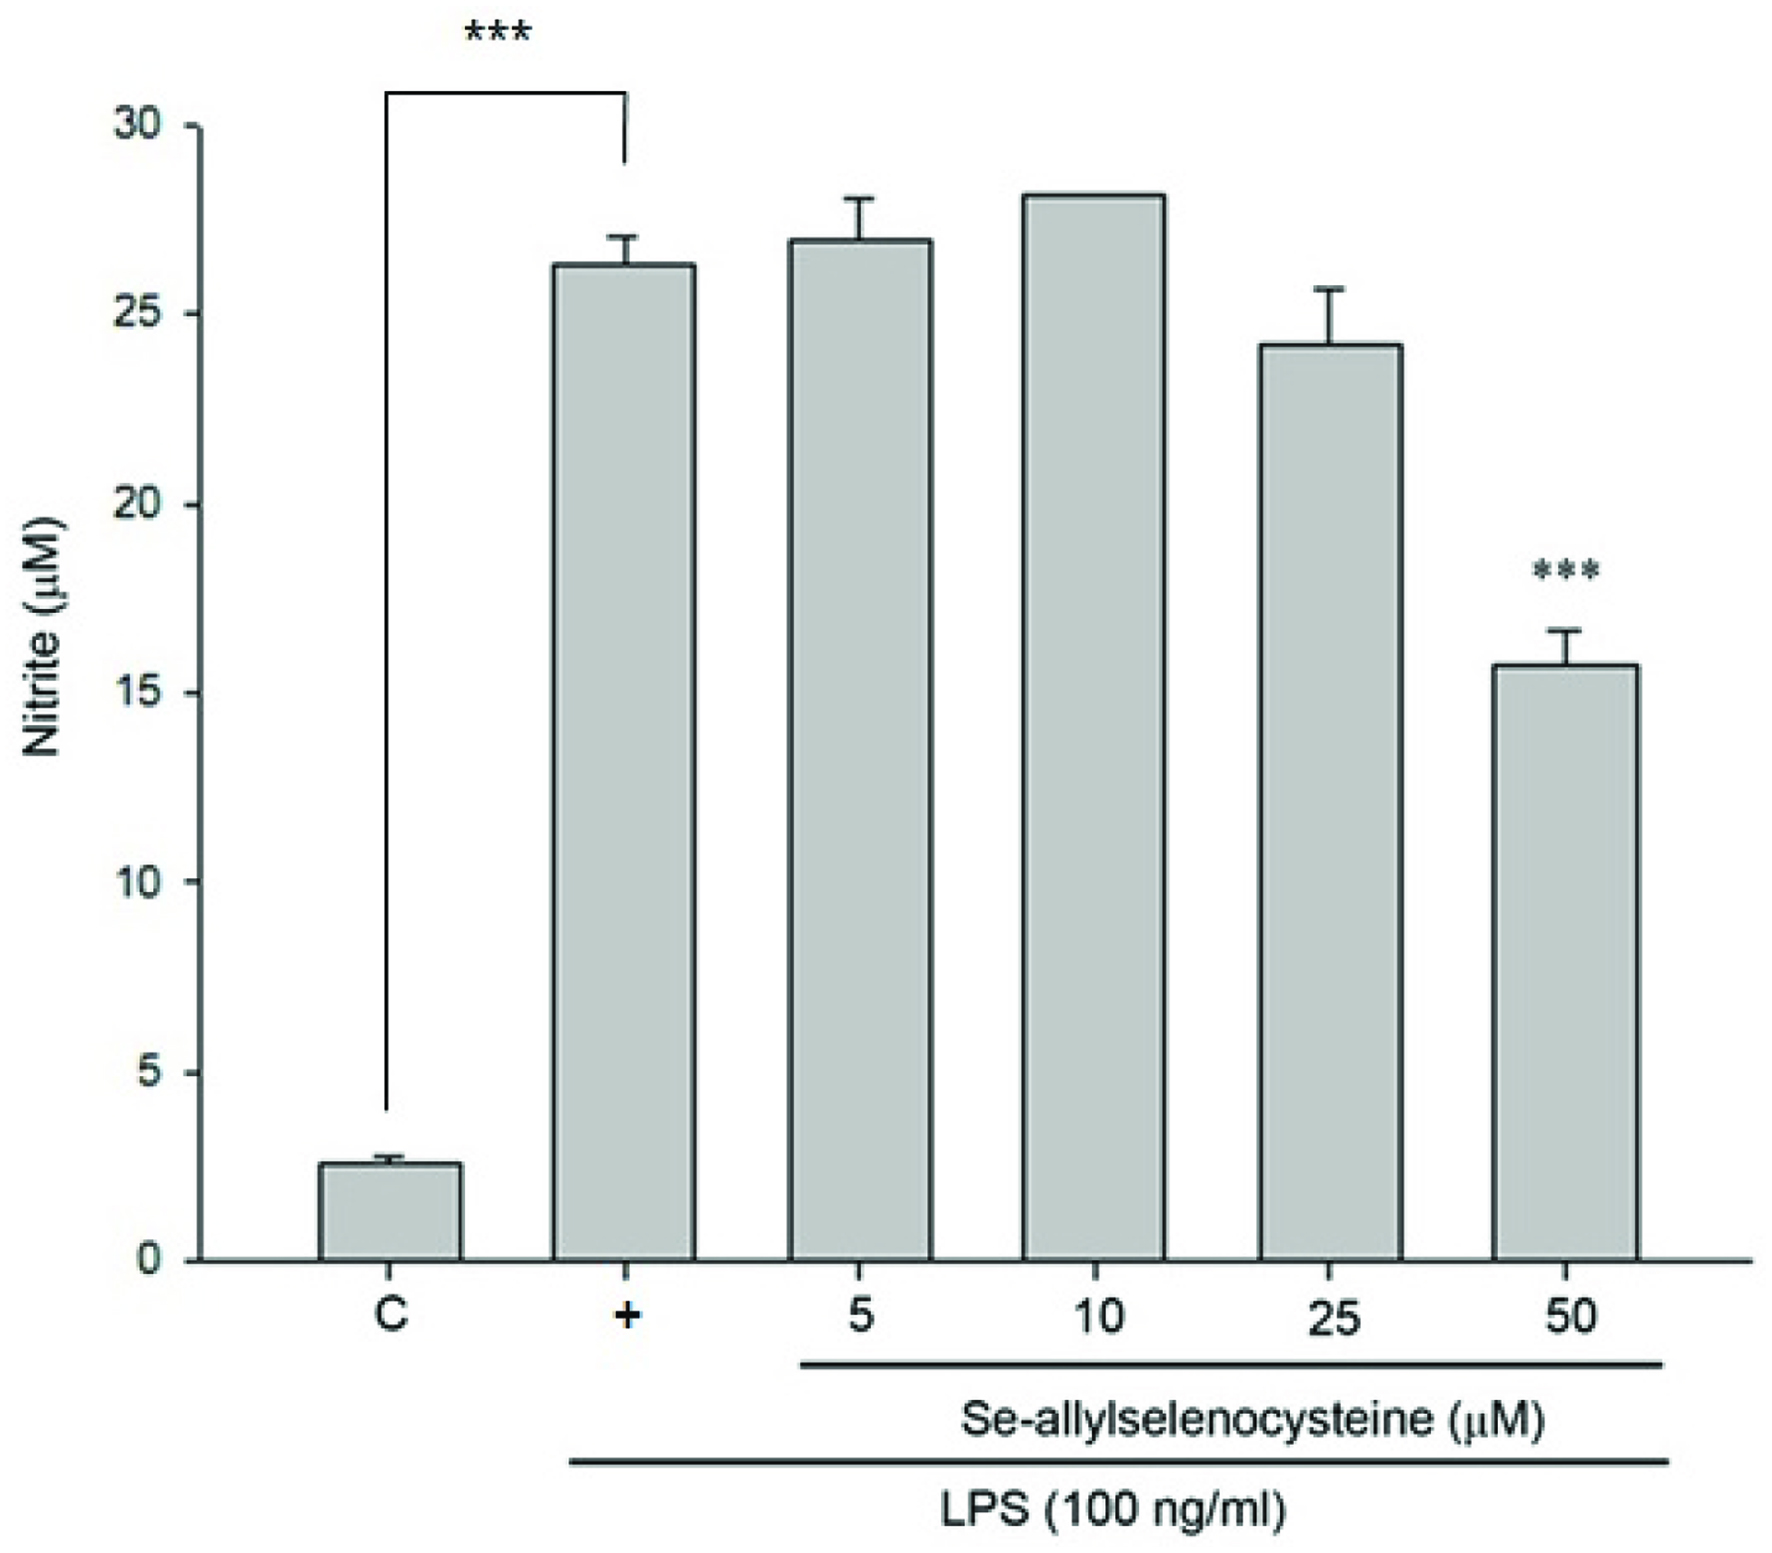
Figure 2. Inhibitory effects of ASC on NO production in LPS-stimulated RAW 264.7 cells. The cells were treated with LPS (100 ng/mL) only or with different concentrations of ASC for 24 hr. At the end of incubation time, 100 μL of the culture medium was collected for nitrite assay. The values are expressed as means S.E. of triplicate tests. *P < 0.05, **P < 0.01, ***P < 0.001 (control versus LPS alone; LPS alone versus ASC 5, 10, 25 and 50 μM).
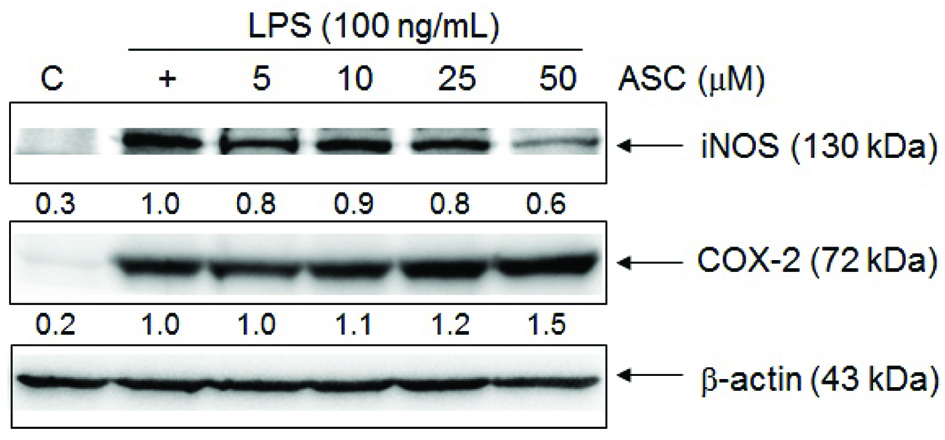
Figure 3. Effects of ASC on LPS-induced iNOS and COX-2 protein level in RAW 264.7 cells. The cells were treated with different concentrations of ASC and LPS (100 ng/mL) for 24 hr. An equal amount of total proteins (50 μg) were subjected to 8% SDS-PAGE. The expression of iNOS, COX-2 and β-actin was detected by western blot using specific antibodies. These experiments were repeated three times with similar results. Relative protein levels were quantified using Image J.
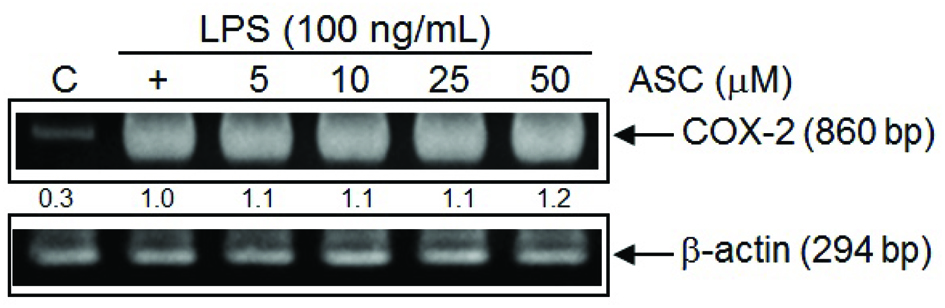
Figure 4. RT-PCR analysis of the effects of ASC on LPS-induced COX-2 mRNA expression. Cells were treated with LPS (100 ng/mL) and ASC (5, 10, 25, 50 μM) for 6 hr, and total RNA was subjected to RT-PCR with the primers COX-2 with β-actin as internal control. The PCR product was resolved in 2% agarose gel. These experiments were repeated three times with similar results. Quantification of COX-2 expression was normalized to β-actin using Image J.
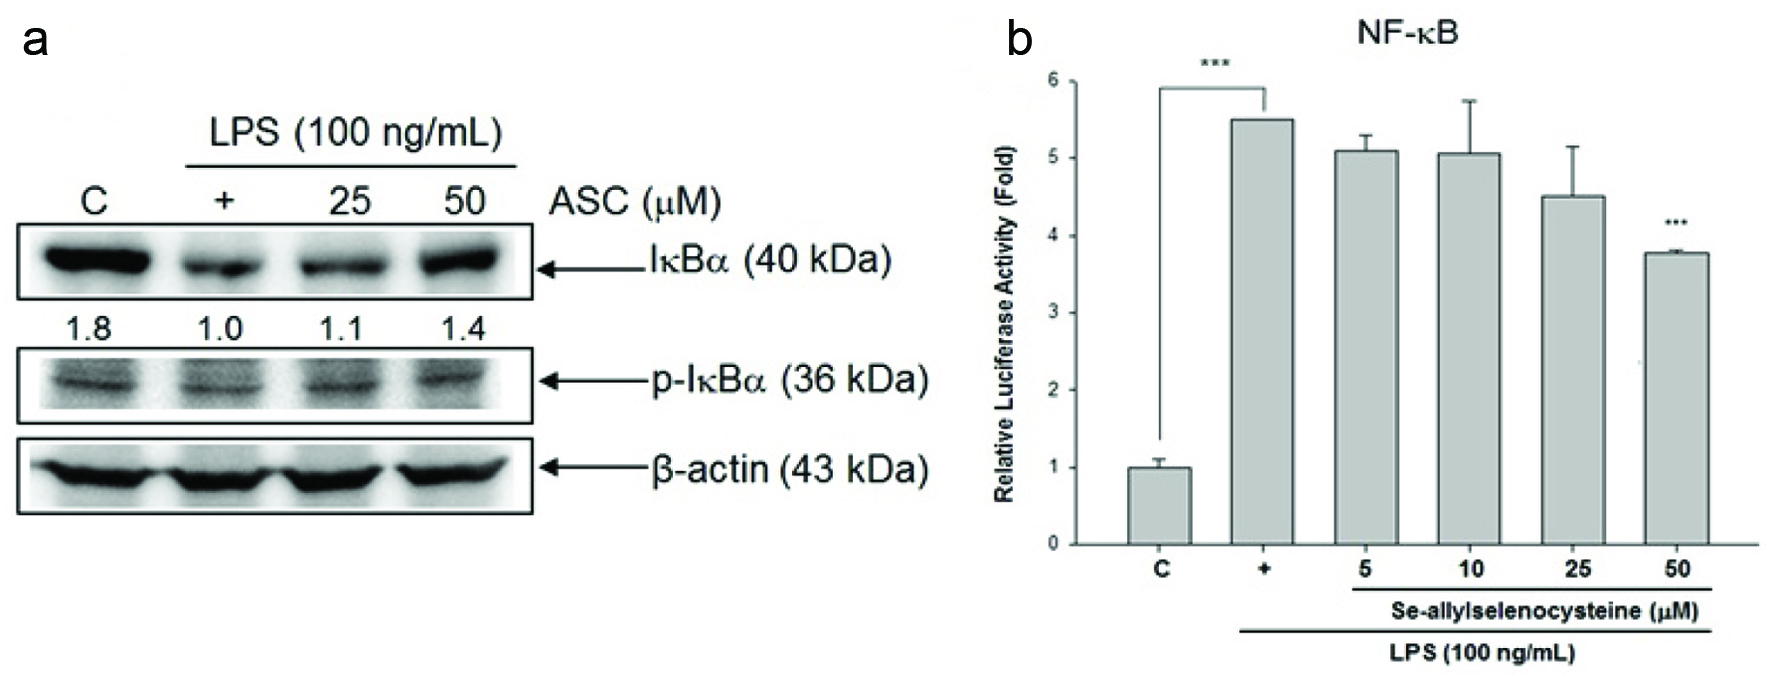
Figure 5. Effects of ASC on LPS-induced phosphorylation and degradation of IκB and NF-κB-luciferase (luc) activation. (a) RAW 264.7 cells were treated with LPS (100 ng/mL) and ASC, and total cellular lysates were prepared and analysed for the content of IκBα, p-IκBα, and β-actin by western blot. Quantification of IκB and p-IκBα protein level were normalized to β-actin using Image J. (b) The cells were treated with LPS (100 ng/mL) with or without ASC for 24 hr. Then, cells were collected for measuring luciferase activity assay. *P < 0.05, **P < 0.01, ***P < 0.001 (control versus LPS alone; LPS alone versus ASC 5, 10, 25, and 50 μM)
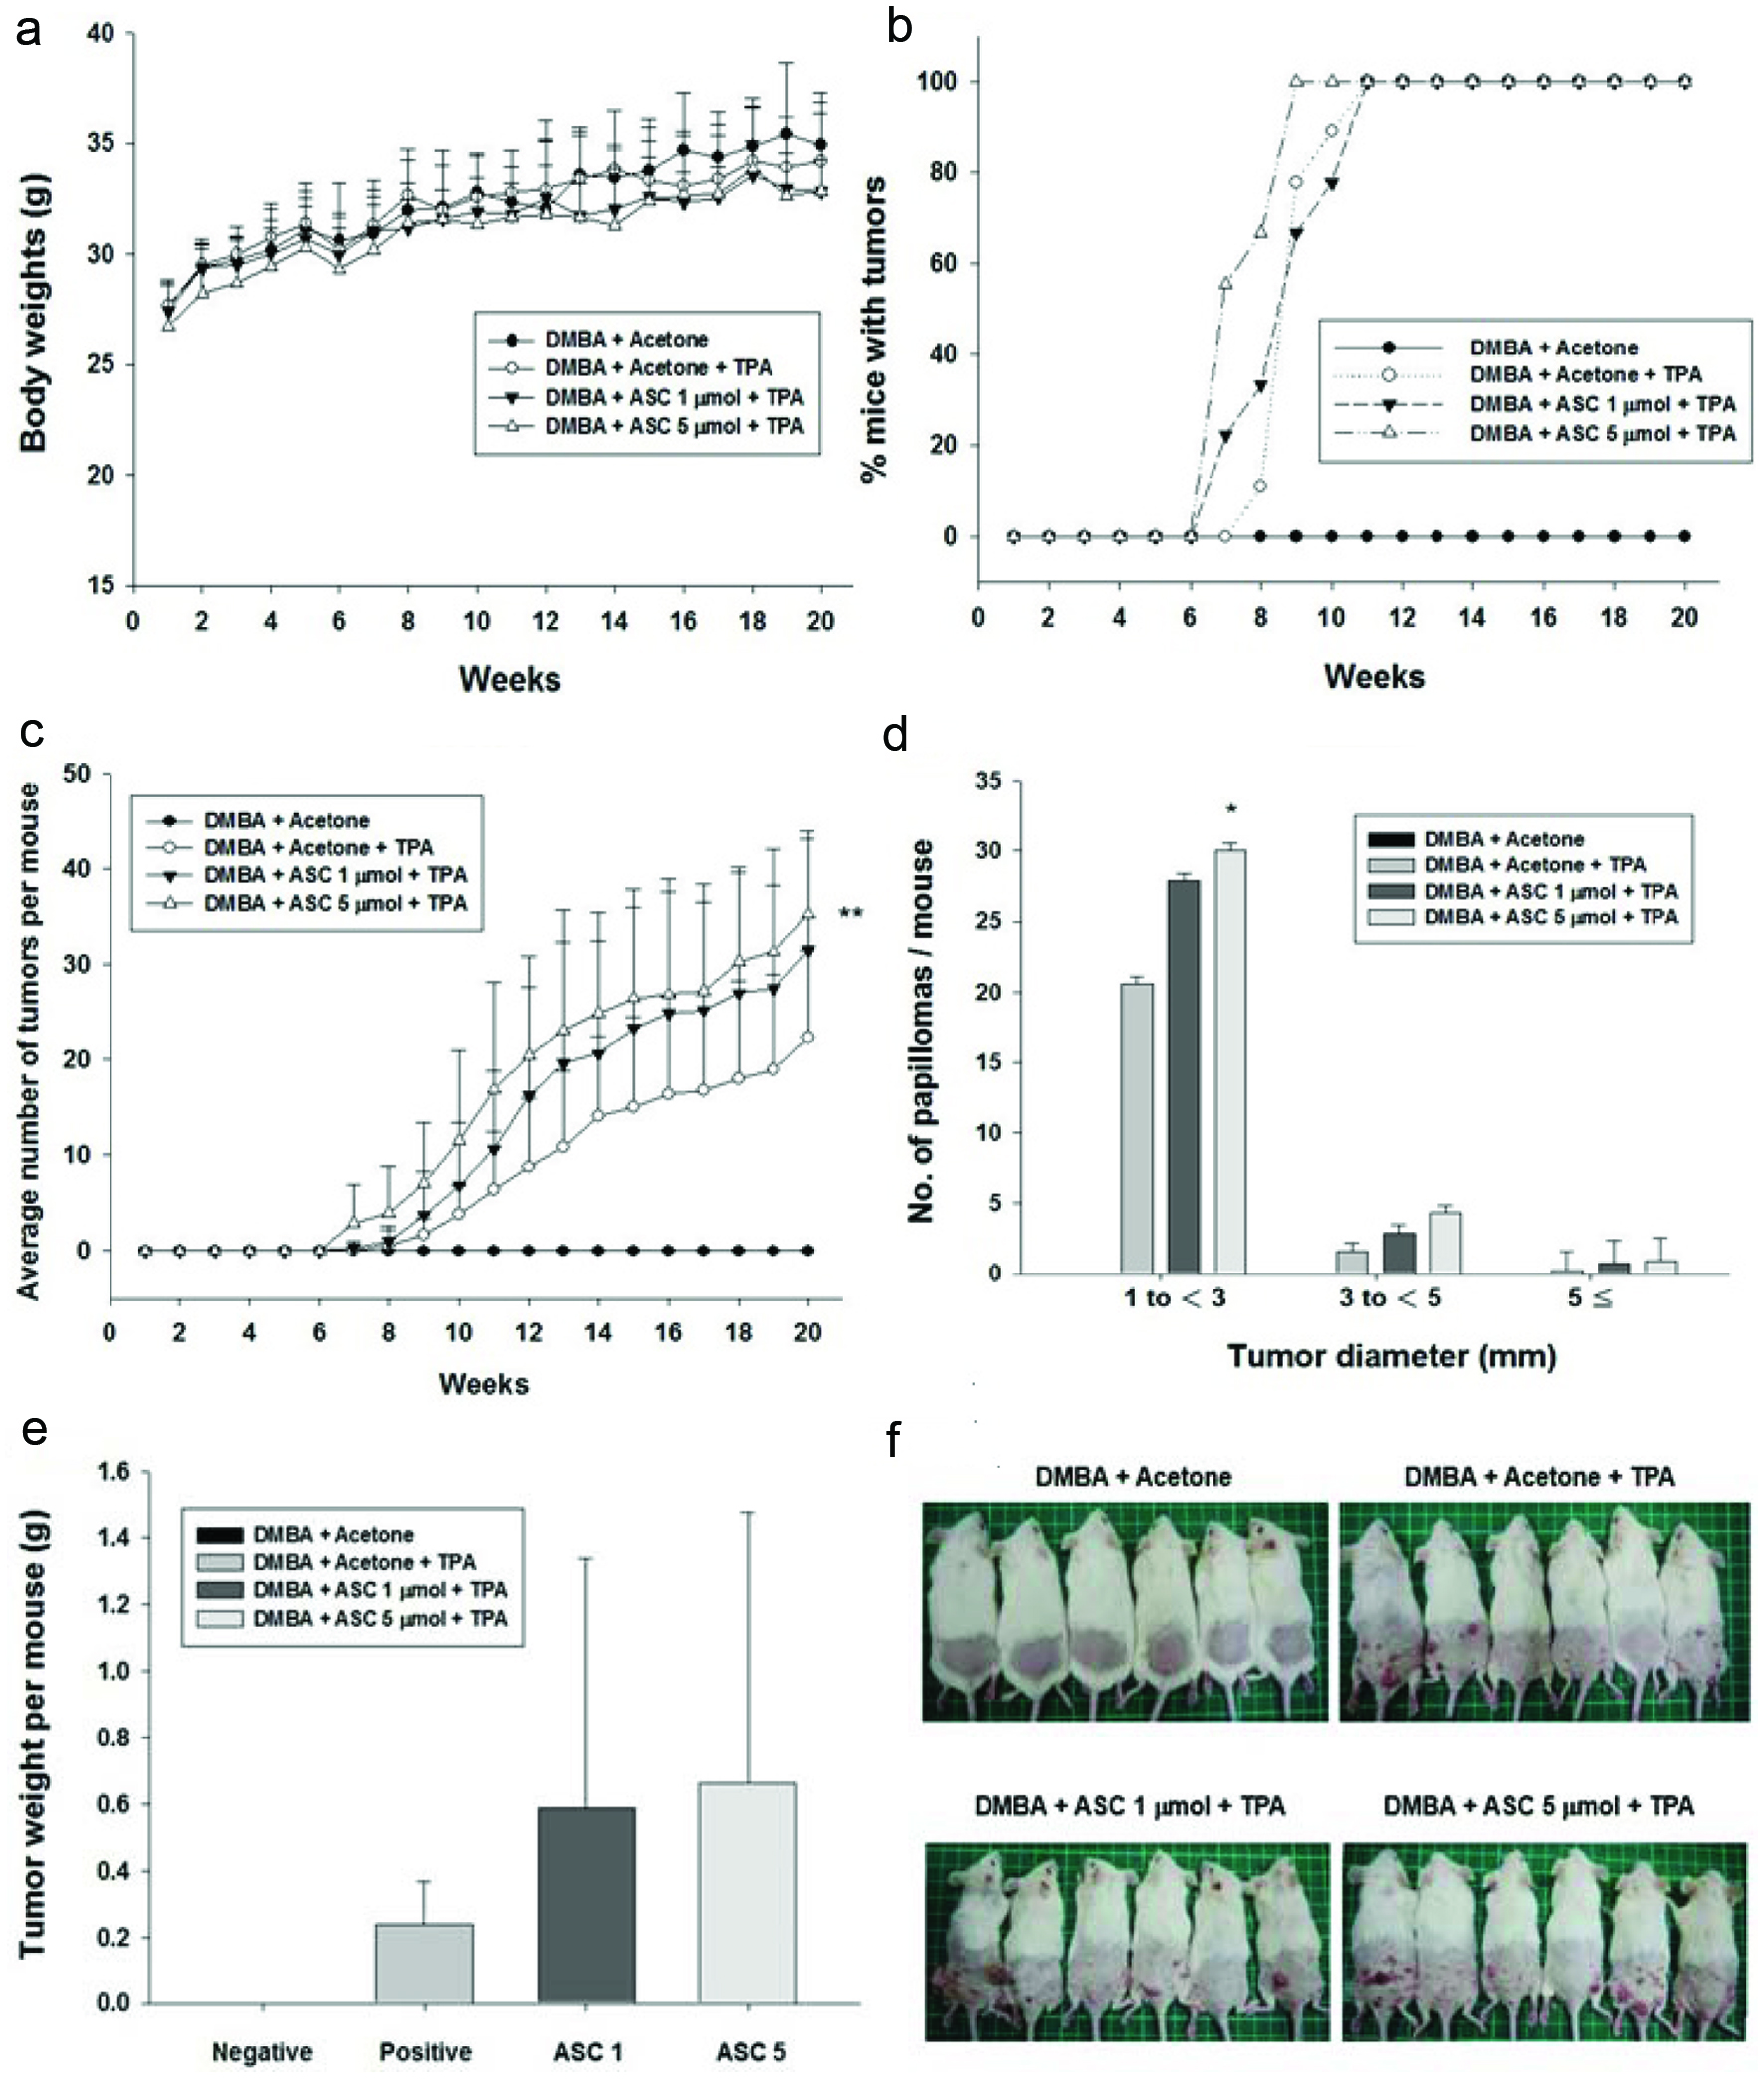
Figure 6. The promoting effect of ASC on DMBA/TPA-induced skin tumorigenesis in ICR mice. Female ICR mice received vehicle (acetone) or ASC (1 or 5 μmol) 30 min prior to each topical application of TPA (5 nmol) twice weekly for 20 weeks following DMBA-initiation, as described in materials and methods. Control animals received vehicle alone and did not produced papillomas. (a) The body weight of mice during skin tumour promotion. (b) Average number of tumours per mouse (tumour multiplicity). (c) Percentage of mice with papillomas (tumour incidence). (d) Size distribution of papillomas. (e) Tumour weight per mouse on control groups and ASC-treated mice. (f) Representative photographs of each group are shown at the end of week 20. *Significantly different from the corresponding TPA value at *P<0.05, **P<0.01, and ***P<0.001.
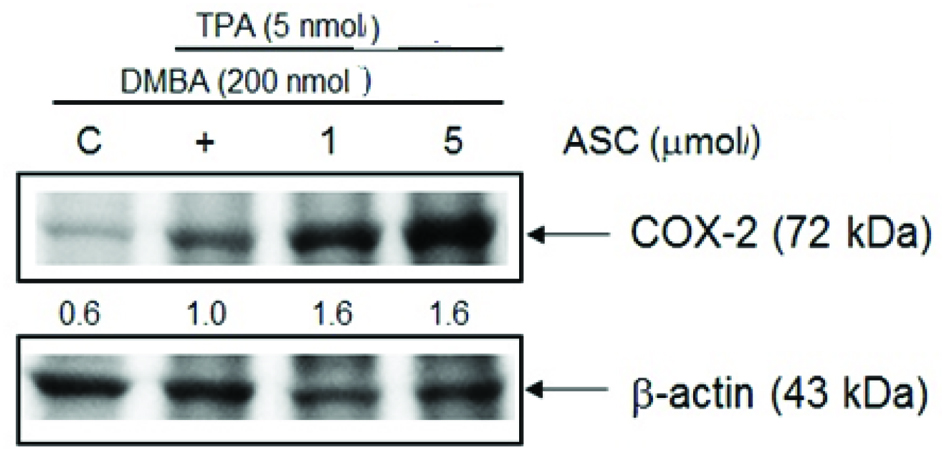
Figure 7. ASC up-regulate COX-2 protein level on DMBA/TPA-induced skin tumorigenesis. Shaven backs of female ICR mice were treated with ASC (1 or 5 μmol) 30 min prior to TPA (5 nmol) twice weekly for 20 weeks following DMBA-initiation, and control animals were treated with acetone only for 20 weeks following DMBA-initiation. Mice were sacrificed after 20 weeks and skin fractions were prepared from the skin/tumours of each group. The protein expression was determined by western blot analysis as described in the text. Quantification of COX-2 protein levels were normalized to β-actin using Image J. The data is representative of three different sets of animals giving a similar trend.