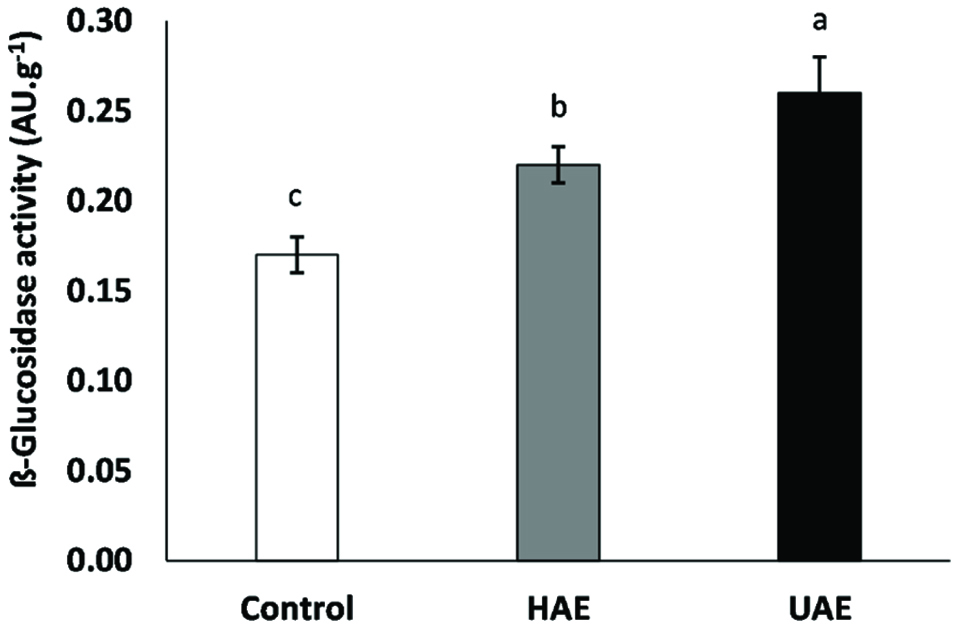
Figure 1. Effect of hemicellulaseassisted extraction (HAE) and ultrasound-assisted extraction (UAE) on the activity of endogenous ß-glucosidase. Means with different letters show difference among treatments (p < 0.05).
| Journal of Food Bioactives, ISSN 2637-8752 print, 2637-8779 online |
| Journal website www.isnff-jfb.com |
Original Research
Volume 6, June 2019, pages 140-147
Ultrasound- and hemicellulase-assisted extraction increase β-glucosidase activity, the content of isoflavone aglycones and antioxidant potential of soymilk
Figures
Tables
| control | HAE | UAE | |
|---|---|---|---|
| Data represent mean values ± standard deviation (n = 3). Values followed by the same letters within a column are not significantly different (p > 0.05). DW is dry weight. The contents (µmol g−1 dw) of isoflavones in the original soybean were 1.84 ± 0.27 (malonylglucosides); 0.62 ± 0.03 (malonyldaidzin); 0.34 ± 0.01 (malonylglycitin); 0.88 ± 0.02 (malonylgenistin); 0.71 ± 0.02 (β-glucosides); 0.26 ± 0.01 (daidzin); 0.22 ± 0.01 (glycitin); 0.23 ± 0.01 (genistin); 0.17 ± 0.00 (aglycones); 0.06 ± 0.00 (daidzein); 0.06 ± 0.00 (glyctein); 0.06 ± 0.00 (genistein).. | |||
| Malonylglucosides | 1.72 ± 0.01a | 1.41 ± 0.02c | 1.55 ± 0.01b |
| malonyldaidzin | 0.57 ± 0.00a | 0.45 ± 0.01c | 0.51 ± 0.01b |
| malonylglycitin | 0.25 ± 0.00a | 0.21 ± 0.00c | 0.23 ± 0.00b |
| malonylgenistin | 0.91 ± 0.00a | 0.76 ± 0.01c | 0.82 ± 0.00b |
| β-Glucosides | 0.47 ± 0.01a | 0.28 ± 0.01b | 0.28 ± 0.00b |
| daidzin | 0.19 ± 0.00a | 0.12 ± 0.01b | 0.12 ± 0.00b |
| glycitin | 0.12 ± 0.00a | 0.07 ± 0.00b | 0.07 ± 0.00b |
| genistin | 0.16 ± 0.00a | 0.09 ± 0.00b | 0.09 ± 0.00b |
| Aglycones | 0.26 ± 0.01c | 0.44 ± 0.00b | 0.63 ± 0.04a |
| daidzein | 0.10 ± 0.01c | 0.15 ± 0.00b | 0.21 ± 0.00a |
| glycitein | 0.05 ± 0.00c | 0.11 ± 0.00b | 0.14 ± 0.00a |
| genistein | 0.11 ± 0.02b | 0.17 ± 0.00b | 0.28 ± 0.04a |
| Ratio | |||||||||
|---|---|---|---|---|---|---|---|---|---|
| aISO/cISO | aDAI/cDAI | aGLY/cGLY | aGEN/cGEN | ||||||
| Abbreviations: aISO, aglycone isoflavones; cISO, conjugated isoflavones; aDAI, daidzein; cDAI, conjugated daidzein; aGly, glycitein; cGly, conjugated glycitein; aGEN, genistein; cGEN, conjugated genistein; Data represent mean values ± standard deviation (n = 3). Values followed by the same letters within a column are not significantly different (p > 0.05). *significant at p < 0.05. | |||||||||
| feedstock | 0.068 ± 0.003d | 0.063 ± 0.002d | 0.105 ± 0.005d | 0.053 ± 0.001d | |||||
| control | 0.120 ± 0.006c | 0.132 ± 0.009c | 0.146 ± 0.005c | 0.102 ± 0.015c | |||||
| HAE | 0.258 ± 0.002b | 0.268 ± 0.003b | 0.404 ± 0.005b | 0.204 ± 0.000b | |||||
| UAE | 0.345 ± 0.021a | 0.327 ± 0.005a | 0.475 ± 0.005a | 0.314 ± 0.046a | |||||
| Correlation | |||||||||
| Abbreviations: aISO, aglycone isoflavones; cISO, conjugated isoflavones; aDAI, daidzein; cDAI, conjugated daidzein; aGly, glycitein; cGly, conjugated glycitein; aGEN, genistein; cGEN, conjugated genistein; Data represent mean values ± standard deviation (n = 3). Values followed by the same letters within a column are not significantly different (p > 0.05). *significant at p < 0.05. | |||||||||
| ORAC | 0.8846* | 0.9273* | 0.8899* | 0.8332* | |||||
| ABTS | 0.8471* | 0.8860* | 0.8436* | 0.8053* | |||||