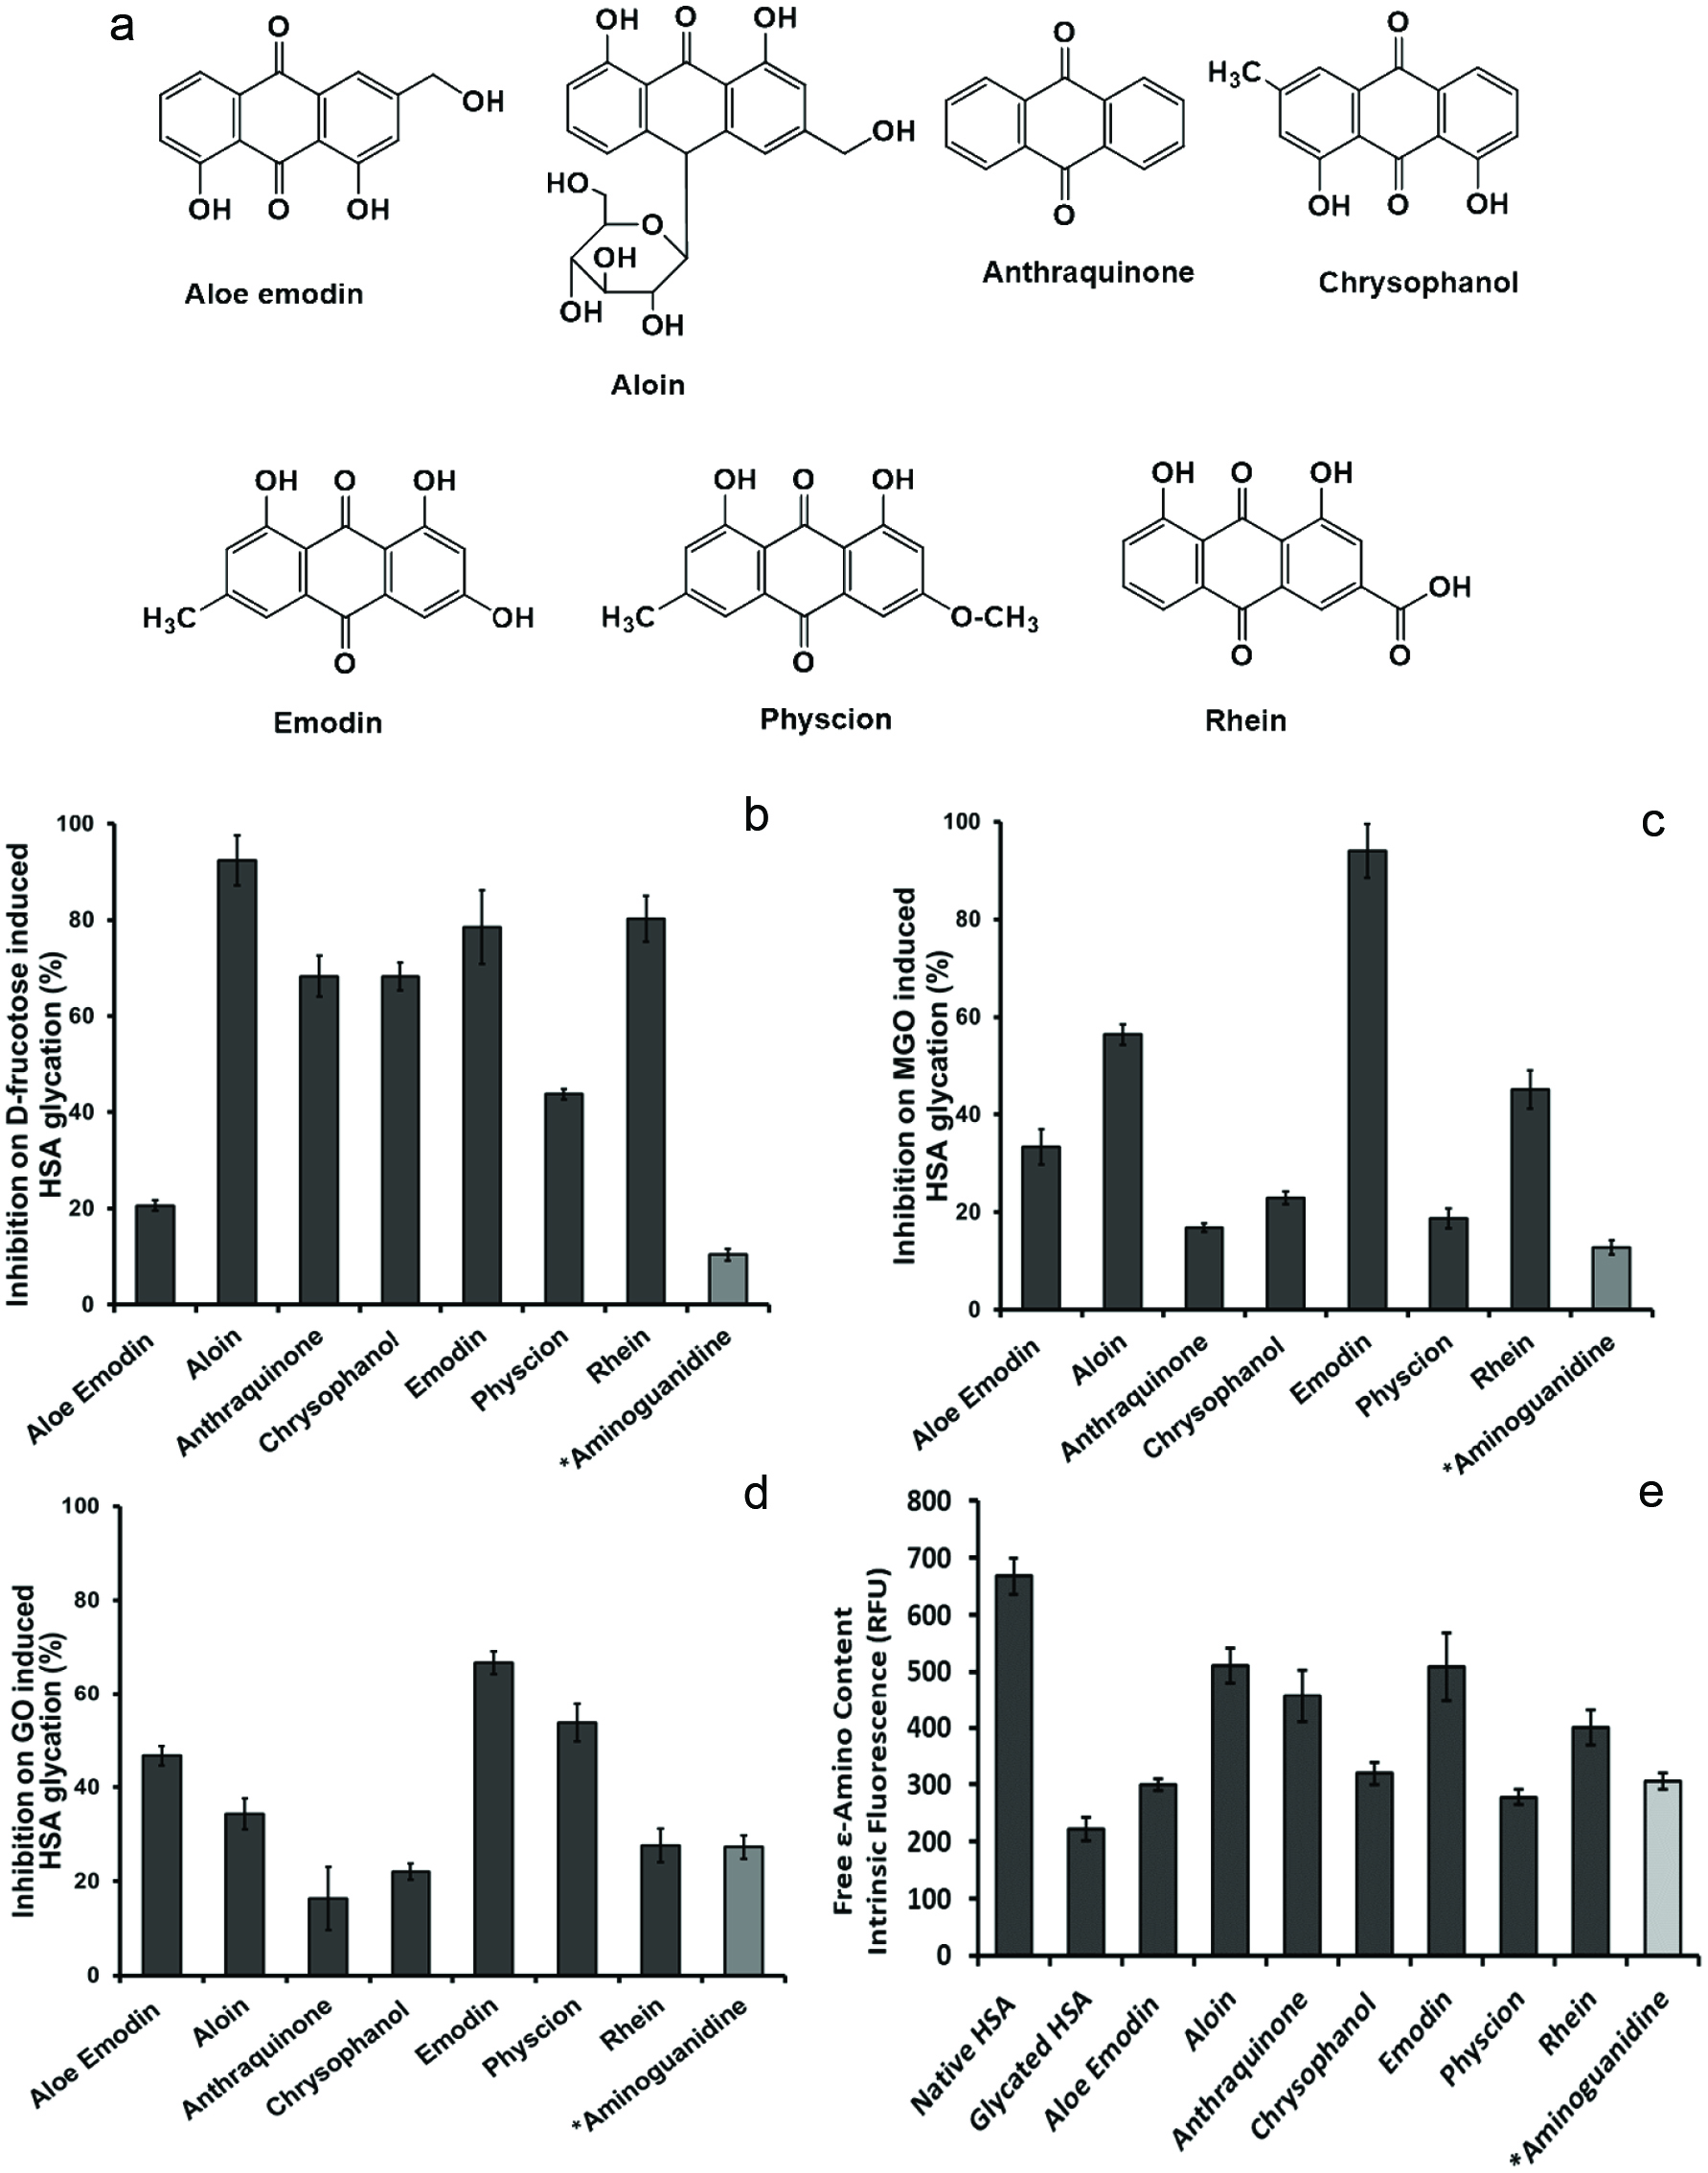
Journal of Food Bioactives, ISSN 2637-8752 print, 2637-8779 online
Journal website www.isnff-jfb.com

Original Research

Volume 4, Number , December 2018, pages 130-138


Bioactive anthraquinones found in plant foods interact with human serum albumin and inhibit the formation of advanced glycation endproducts

Figures

Figure 1.
Figure 1.

Chemical structures of anthraquinone derivatives (a). The intrinsic fluorescence characterization of effects of the anthraquinones (at 100 µM) on the formation of HSA AGEs with different inducers including fructose (b), methylglyoxal (MGO) (c), and glyoxal (GO) (d). The inhibitory effects of the anthraquinones (at 100 µM) on HSA side chain modification induced by fructose (e). All data points represent the average of triplicate measurements with the bars at each point representing the respective standard derivation. *Aminoguanidine, AG (100 µM), served as a positive control.

Figure 2.
Figure 2.

Protective effects of the anthraquinones (at 100 µM) on the secondary structures of HSA against glycation-induced structural changes as characterized by circular dichroism (CD) experiments. Aminoguanidine, AG, (at 100 µM) served as the positive control.

Figure 3.
Figure 3.

Thermodynamic binding capacity of rhein and HSA obtained by isothermal titration calorimetry (ITC). Raw data plot of heat flow against time for the titration of rhein into HSA.

Figure 4.
Figure 4.

The UV-visible absorption spectra of HSA (0.25 mg/mL) with rhein at concentrations ranging from 25 to 100 µM (a) and rhein (25 µM) with HSA at concentrations ranging from 0.125 to 0.5 mg/mL (b).

Figure 5.
Figure 5.

Computational docking of HSA and rhein. The binding site of rhein on HSA (a). The binding mode of rhein and HSA in a zoomed view (b), and illustrations of types of interactions between rhein and HSA (c).

Tables

Table 1. Scavenging effects of anthraquinones on free radicals in the DPPH assay and reactive carbonyl species in the MGO trapping assay
 
SampleFree radical scavenging capacity; IC50 (µM)MGO trapping capacity (%)
an.d. = not detectable at a concentration of 100 µM. bBHT: butylated hydroxytoluene, positive control for the DPPH assay. cAG: aminoguanidine, positive control for the MGO trapping assay.
aloe emodin80.1 ± 1.7n.d.a
emodin125.7 ± 3.37.2
aloin502.9 ± 6.911.7
chrysophanol> 1000n.d.
rhein> 10002.3
anthraquinone> 1000n.d.
physcion> 1000n.d.
BHTb397.5 ± 4.8
AGc96.1


Table 2. Protective effects of anthraquinones on the secondary structure of HSA protein as the percentages of the HSA secondary structures including α-helix, β-sheet, and irregular
 
Secondary structuresα-Helix (%)β-Sheet (%)Irregular (%)
The raw CD data were obtained from three replicates of experiments and their average values were used to calculate the percentage of the secondary structures.
native HSA66.125.38.6
glycated HSA32.549.717.8
aloe emodin43.542.214.3
aloin46.341.811.9
anthraquinone44.841.613.6
chrysophanol56.934.38.8
emodin57.7339.3
physcion43.041.915.1
rhein44.339.116.6
aminoguanidine46.638.714.7


Table 3. Thermodynamic parameters for ligand (rhein) binding to HSA
 
LigandN [rhein/HSA]Ka [104 M−1]c valueΔG [104 kcal mol−1]ΔH [104 kcal mol−1]TΔS [104 kcal mol−1K−1]
rhein1.92.10.6−0.6−1.20.6